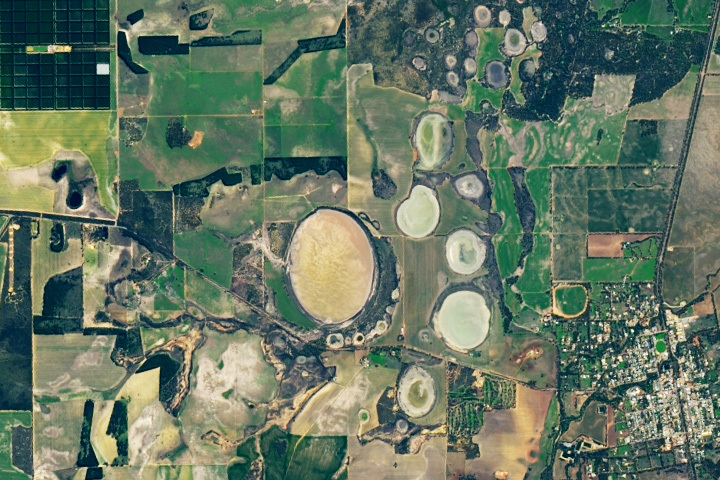
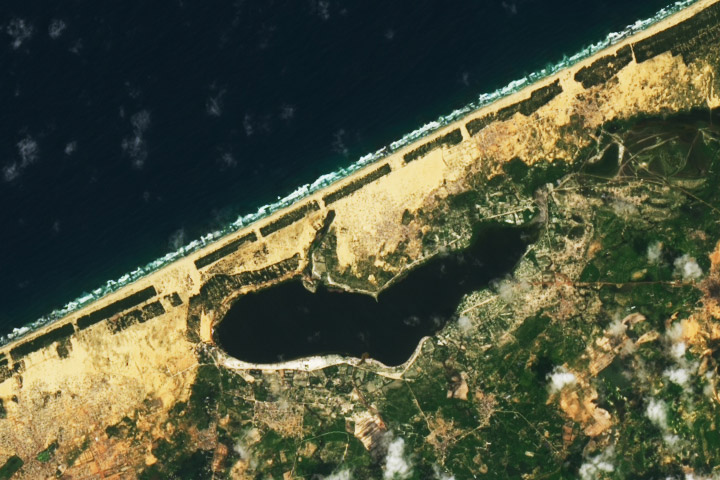
Update on September 5, 2023: This puzzler image shows Lake Dalaroo and clusters of “fairy circles” that seep hydrogen gas near the town of Moora in Western Australia. Congratulations to Ian Cathcart for being the first reader to correctly identify the image. Read more about the location in our Image of the Day story.
Every month on Earth Matters, we offer a puzzling satellite image. The August 2023 puzzler is shown above. Your challenge is to use the comments section to tell us where it is, what we are looking at, and why it is interesting.
How to answer. You can use a few words or several paragraphs. You might simply tell us the location, or you can dig deeper and offer details about what satellite and instrument produced the image, what spectral bands were used to create it, or what is compelling about some obscure feature. If you think something is interesting or noteworthy, tell us about it.
The prize. We cannot offer prize money or a trip on the International Space Station, but we can promise you credit and glory. Well, maybe just credit. Within a week after a puzzler image appears on this blog, we will post an annotated and captioned version as our Image of the Day. After we post the answer, we will acknowledge the first person to correctly identify the image at the bottom of this blog post. We also may recognize readers who offer the most interesting tidbits of information. Please include your preferred name or alias with your comment. If you work for or attend an institution that you would like to recognize, please mention that as well.
Recent winners. If you have won the puzzler in the past few months, or if you work in geospatial imaging, please hold your answer for at least a day to give less experienced readers a chance.
Releasing comments. Savvy readers have solved some puzzlers after a few minutes. To give more people a chance, we may wait 24 to 48 hours before posting comments. Good luck!
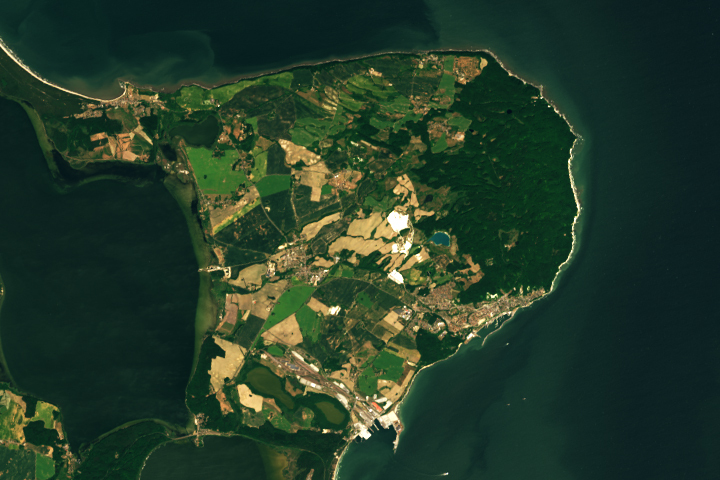
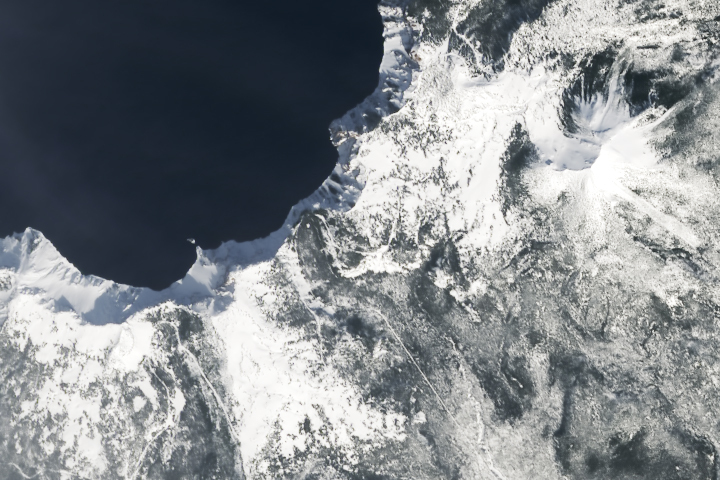
Update on July 5, 2023: This puzzler image shows Germany’s Jasmund National Park on the island of Rügen in the Baltic Sea. Congratulations to Holger Wille for being the first reader to correctly identify the image. Read more about the location in our Image of the Day story.
Every month on Earth Matters, we offer a puzzling satellite image. The June 2023 puzzler is shown above. Your challenge is to use the comments section to tell us where it is, what we are looking at, and why it is interesting.
How to answer. You can use a few words or several paragraphs. You might simply tell us the location, or you can dig deeper and offer details about what satellite and instrument produced the image, what spectral bands were used to create it, or what is compelling about some obscure feature. If you think something is interesting or noteworthy, tell us about it.
The prize. We cannot offer prize money or a trip on the International Space Station, but we can promise you credit and glory. Well, maybe just credit. Within a week after a puzzler image appears on this blog, we will post an annotated and captioned version as our Image of the Day. After we post the answer, we will acknowledge the first person to correctly identify the image at the bottom of this blog post. We also may recognize readers who offer the most interesting tidbits of information. Please include your preferred name or alias with your comment. If you work for or attend an institution that you would like to recognize, please mention that as well.
Recent winners. If you have won the puzzler in the past few months, or if you work in geospatial imaging, please hold your answer for at least a day to give less experienced readers a chance.
Releasing comments. Savvy readers have solved some puzzlers after a few minutes. To give more people a chance, we may wait 24 to 48 hours before posting comments. Good luck!
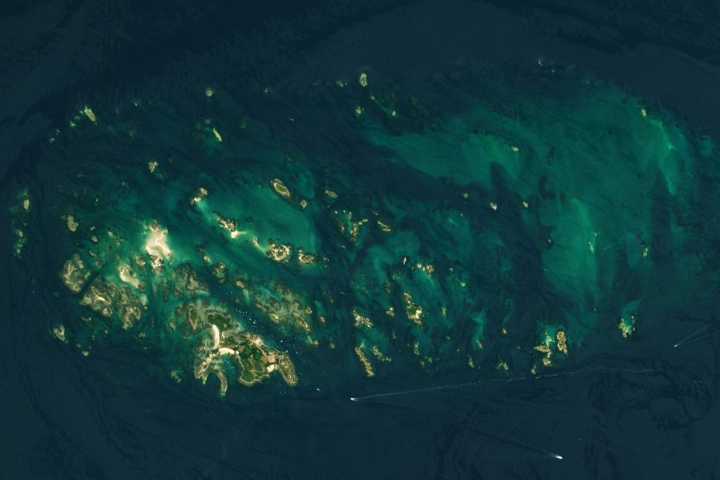
Update on June 13, 2023: This puzzler image shows France’s Chausey Islands (Îles Chausey), around low tide on July 22, 2018. The islands are subject to some of the largest tidal ranges on Earth. Congratulations to Michelangelo Grillo, who was the first to identify the correct location. Grillo was also the first to mention the region’s extreme tides. View the same area during high tide in our Image of the Day story.
Every month on Earth Matters, we offer a puzzling satellite image. The May 2023 puzzler is shown above. Your challenge is to use the comments section to tell us where it is, what we are looking at, and why it is interesting.
How to answer. You can use a few words or several paragraphs. You might simply tell us the location, or you can dig deeper and offer details about what satellite and instrument produced the image, what spectral bands were used to create it, or what is compelling about some obscure feature. If you think something is interesting or noteworthy, tell us about it.
The prize. We cannot offer prize money or a trip on the International Space Station, but we can promise you credit and glory. Well, maybe just credit. Within a week after a puzzler image appears on this blog, we will post an annotated and captioned version as our Image of the Day. After we post the answer, we will acknowledge the first person to correctly identify the image at the bottom of this blog post. We also may recognize readers who offer the most interesting tidbits of information. Please include your preferred name or alias with your comment. If you work for or attend an institution that you would like to recognize, please mention that as well.
Recent winners. If you have won the puzzler in the past few months, or if you work in geospatial imaging, please hold your answer for at least a day to give less experienced readers a chance.
Releasing Comments. Savvy readers have solved some puzzlers after a few minutes. To give more people a chance, we may wait 24 to 48 hours before posting comments. Good luck!
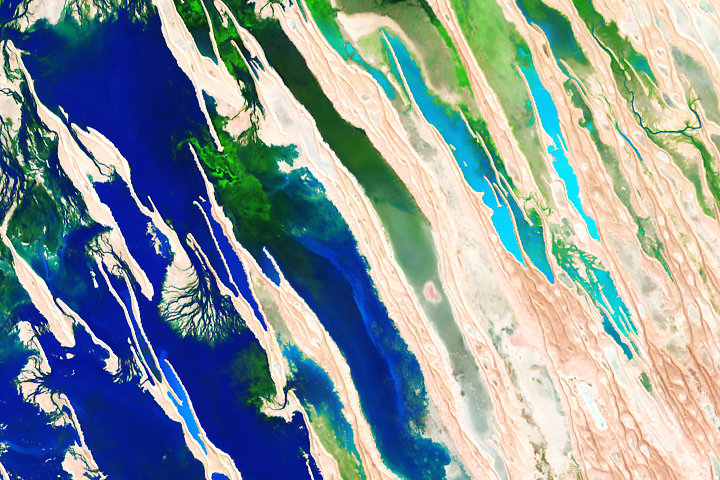
Update on May 2, 2023: This puzzler image is a false-color view of seasonal flooding of Australia’s Diamantina River in April 2023. Congratulations to Steve Hawkins for being the first reader to correctly identify the image and to David Smith for finding its exact location. Read more about the location in our Image of the Day story.
Every month on Earth Matters, we offer a puzzling satellite image. The April 2023 puzzler is shown above. Your challenge is to use the comments section to tell us where it is, what we are looking at, and why it is interesting.
How to answer. You can use a few words or several paragraphs. You might simply tell us the location, or you can dig deeper and offer details about what satellite and instrument produced the image, what spectral bands were used to create it, or what is compelling about some obscure feature. If you think something is interesting or noteworthy, tell us about it.
The prize. We cannot offer prize money or a trip on the International Space Station, but we can promise you credit and glory. Well, maybe just credit. Within a week after a puzzler image appears on this blog, we will post an annotated and captioned version as our Image of the Day. After we post the answer, we will acknowledge the first person to correctly identify the image at the bottom of this blog post. We also may recognize readers who offer the most interesting tidbits of information. Please include your preferred name or alias with your comment. If you work for or attend an institution that you would like to recognize, please mention that as well.
Recent winners. If you have won the puzzler in the past few months, or if you work in geospatial imaging, please hold your answer for at least a day to give less experienced readers a chance.
Releasing Comments. Savvy readers have solved some puzzlers after a few minutes. To give more people a chance, we may wait 24 to 48 hours before posting comments. Good luck!
Update on April 17, 2023: This puzzler image shows Crater Lake in south-central Oregon in March 2023. The lake is especially scenic in early spring when its deep-blue waters contrast with a blanket of snow on land. Congratulations to Dan Taylor for being the first reader to correctly identify the image. Read more about the location in our Image of the Day story.
Every month on Earth Matters, we offer a puzzling satellite image. The March 2023 puzzler is shown above. Your challenge is to use the comments section to tell us where it is, what we are looking at, and why it is interesting.
How to answer. You can use a few words or several paragraphs. You might simply tell us the location, or you can dig deeper and offer details about what satellite and instrument produced the image, what spectral bands were used to create it, or what is compelling about some obscure feature. If you think something is interesting or noteworthy, tell us about it.
The prize. We cannot offer prize money or a trip on the International Space Station, but we can promise you credit and glory. Well, maybe just credit. Within a week after a puzzler image appears on this blog, we will post an annotated and captioned version as our Image of the Day. After we post the answer, we will acknowledge the first person to correctly identify the image at the bottom of this blog post. We also may recognize readers who offer the most interesting tidbits of information. Please include your preferred name or alias with your comment. If you work for or attend an institution that you would like to recognize, please mention that as well.
Recent winners. If you have won the puzzler in the past few months, or if you work in geospatial imaging, please hold your answer for at least a day to give less experienced readers a chance.
Releasing Comments. Savvy readers have solved some puzzlers after a few minutes. To give more people a chance, we may wait 24 to 48 hours before posting comments. Good luck!
Update on October 26, 2022: This puzzler image shows Lake Retba along the coast of Senegal. The lake’s water’s are often rosy, but had darkened by the time this image was acquired in September 2022 after bouts of heavy rainfall and flooding. Congratulations to Keith Trinity, who was the first to correctly identify the lake and its location. Special mention goes to Rakhee Ranjan for pointing out the intense monsoon season in 2022 and other facts about the region. Read more in the related Image of the Day.
Every month on Earth Matters, we offer a puzzling satellite image. The September 2022 puzzler is shown above. Your challenge is to use the comments section to tell us where it is, what we are looking at, and why it is interesting.
How to answer. You can use a few words or several paragraphs. You might simply tell us the location, or you can dig deeper and offer details about what satellite and instrument produced the image, what spectral bands were used to create it, or what is compelling about some obscure feature. If you think something is interesting or noteworthy, tell us about it.
The prize. We cannot offer prize money or a trip on the International Space Station, but we can promise you credit and glory. Well, maybe just credit. Within a week after a puzzler image appears on this blog, we will post an annotated and captioned version as our Image of the Day. After we post the answer, we will acknowledge the first person to correctly identify the image at the bottom of this blog post. We also may recognize readers who offer the most interesting tidbits of information. Please include your preferred name or alias with your comment. If you work for or attend an institution that you would like to recognize, please mention that as well.
Recent winners. If you have won the puzzler in the past few months, or if you work in geospatial imaging, please hold your answer for at least a day to give less experienced readers a chance.
Releasing Comments. Savvy readers have solved some puzzlers after a few minutes. To give more people a chance, we may wait 24 to 48 hours before posting comments. Good luck!
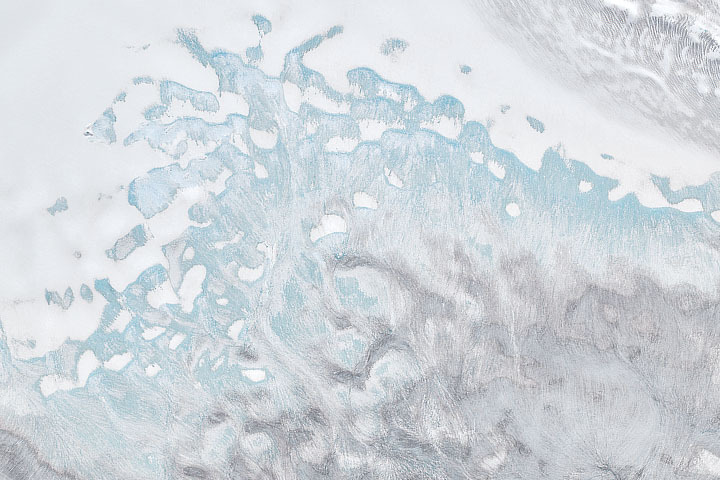
Update on August 5, 2022: This puzzler image shows a portion of Nordaustlandet—a large island in northeast Svalbard. The image was acquired after a record amount of melting took place across the Norwegian archipelago in summer 2022. Notice the extensive light-blue areas where snow and firn have melted away and exposed bare ice (light blue). Congratulations to Yoshihiro Nakayama, who correctly identified the location. Special mention goes to Soren J and others for pointing features associated with melting. Read more in the related Image of the Day.
Every month on Earth Matters, we offer a puzzling satellite image. The August 2022 puzzler is shown above. Your challenge is to use the comments section to tell us where it is, what we are looking at, and why it is interesting.
How to answer. You can use a few words or several paragraphs. You might simply tell us the location, or you can dig deeper and offer details about what satellite and instrument produced the image, what spectral bands were used to create it, or what is compelling about some obscure feature. If you think something is interesting or noteworthy, tell us about it.
The prize. We cannot offer prize money or a trip on the International Space Station, but we can promise you credit and glory. Well, maybe just credit. Within a week after a puzzler image appears on this blog, we will post an annotated and captioned version as our Image of the Day. After we post the answer, we will acknowledge the first person to correctly identify the image at the bottom of this blog post. We also may recognize readers who offer the most interesting tidbits of information. Please include your preferred name or alias with your comment. If you work for or attend an institution that you would like to recognize, please mention that as well.
Recent winners. If you have won the puzzler in the past few months, or if you work in geospatial imaging, please hold your answer for at least a day to give less experienced readers a chance.
Releasing Comments. Savvy readers have solved some puzzlers after a few minutes. To give more people a chance, we may wait 24 to 48 hours before posting comments. Good luck!
Clouds are an important part of the climate system. They affect how much sunlight reaches the ground and how much heat returns to space, which in turn affects Earth’s temperature and rainfall patterns. Scientists are working to better understand the role that clouds play in the global climate system, but that requires significant amounts of data.
“No single cloud observation method or system … is able to provide a complete and accurate depiction of cloud properties across the Earth under the many conditions that naturally occur,” said Bill Smith, an atmospheric scientist at NASA’s Langley Research Center (LaRC). Cloud observations are gathered by active and passive satellites, ground-based sensors, and, by humans.
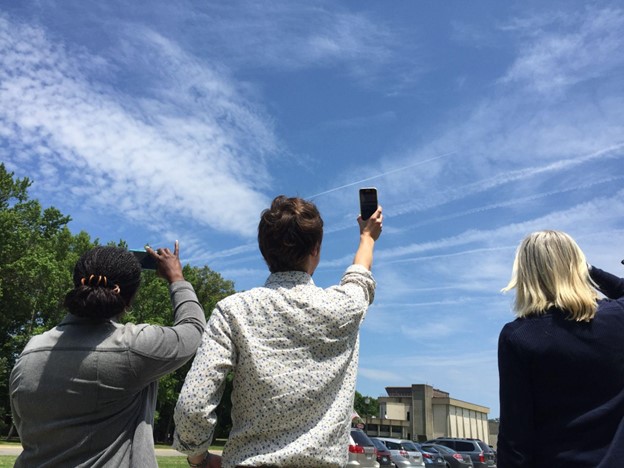
The citizen scientists of the GLOBE Program have been playing a vital role in data collection by observing clouds around the globe, especially at times that “match” a satellite flyover. When that happens, the observations from the citizen scientists on the ground are matched with satellite observations that were made near the same time and place. By combining the ground-up view of GLOBE citizen scientists with the top-down view of satellites, scientists get a more complete view of the atmosphere.
Now, the NASA GLOBE Clouds team is hoping to hit a significant milestone: one million matches by the time of the GLOBE annual meeting in late July 2022.

When a GLOBE cloud observation is taken within 15 minutes of a satellite observation, both points of view are coupled, creating a match. Some satellites are geostationary satellites, such as GOES, Himawari, and Meteosat. Others are polar-orbiting satellites, such as Aqua, Terra, and CALIPSO. The satellite-matched data provides an augmented dataset for research. When a match is made, the NASA GLOBE Clouds team sends a personalized email to participants with the matching satellite data. Approximately 4,000 emails are sent to participants each month.

Participants who want to help GLOBE meet their million-match goal this July can photograph clouds, then upload the photographs and classify the clouds using the GLOBE Observer app. Visit the GLOBE Observer website to learn more about the Match to a Million campaign and how you can help NASA learn more about Earth’s atmosphere.
Read more about the value of combining ground and space measurements in the GLOBE blog Counting to a Million Matches and learn more about matching to satellites on the GLOBE Clouds Science page. You can also follow GLOBE on social media and share what you’re doing to help GLOBE match to a million by using the hashtag #GLOBE1M .
The NASA-funded Global Learning and Observations to Benefit the Environment (GLOBE) program was launched on Earth Day in 1995. Over the past 27 years, millions of students in more than 120 countries have collected and entered more than 200 million environmental measurements into the GLOBE database. Those observations include surface temperatures, rainfall amounts, tree heights, land cover, mosquito habitats, and a variety of other environmental observations, including cloud type and coverage.
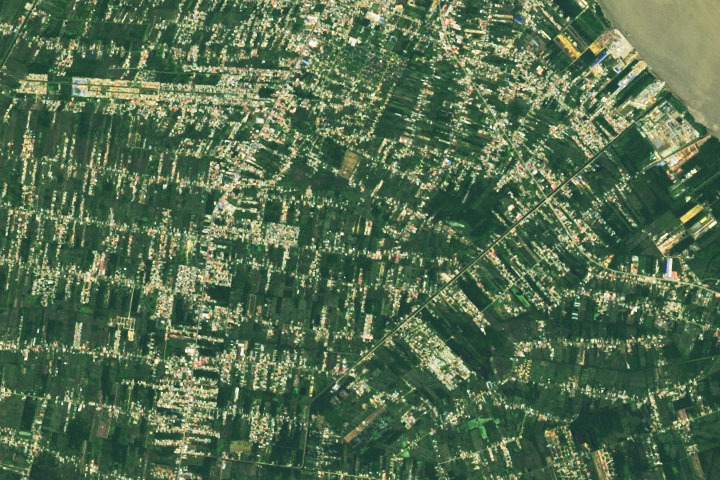
Update on June 28, 2022: Drumroll please…..?????? ….the answer is….PARAMARIBO, SURINAME. The natural-color image was acquired in June 2022 by the satellite’s Operational Land Imager on Landsat 8. Read more about Paramaribo in our June 27 Image of the Day. Congratulations to Firdous Khodabaks, Corey TM, and Nerdonna for being among the first readers to correctly identify the location. Thanks also for sharing interesting details about oil refining, recent flooding, and the presidential palace.
Every month on Earth Matters, we offer a puzzling satellite image. The June 2022 puzzler is shown above. Your challenge is to use the comments section to tell us where it is, what we are looking at, and why it is interesting.
How to answer. You can use a few words or several paragraphs. You might simply tell us the location, or you can dig deeper and offer details about what satellite and instrument produced the image, what spectral bands were used to create it, or what is compelling about some obscure feature. If you think something is interesting or noteworthy, tell us about it.
The prize. We cannot offer prize money or a trip on the International Space Station, but we can promise you credit and glory. Well, maybe just credit. Within a week after a puzzler image appears on this blog, we will post an annotated and captioned version as our Image of the Day. After we post the answer, we will acknowledge the first person to correctly identify the image at the bottom of this blog post. We also may recognize readers who offer the most interesting tidbits of information. Please include your preferred name or alias with your comment. If you work for or attend an institution that you would like to recognize, please mention that as well.
Recent winners. If you have won the puzzler in the past few months, or if you work in geospatial imaging, please hold your answer for at least a day to give less experienced readers a chance.
Releasing Comments. Savvy readers have solved some puzzlers after a few minutes. To give more people a chance, we may wait 24 to 48 hours before posting comments. Good luck!
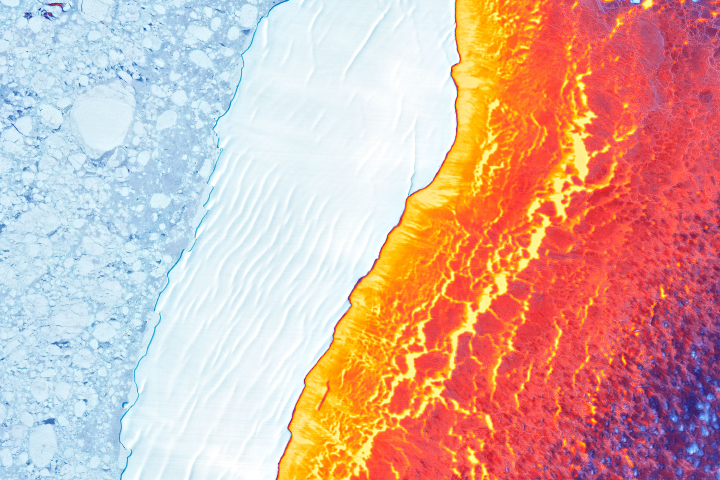
Update on March 22, 2022: This puzzler image shows Iceberg D-30A drifting amid sea ice in Antarctica’s Weddell Sea. The false-color image was created by blending data from the Landsat 8 satellite’s satellite’s Operational Land Imager (for detail and texture) and its Thermal Infrared Sensor (TIRS). The warmest areas (yellow, orange, and red) depict open water and thin, newly formed sea ice. The coldest areas (blue and white) are older, thicker ice, including the icebergs and broken ice rubble in their paths. Congratulations to Jan Lieser who correctly identified the iceberg and various sea ice types. Honorable mention goes to Sergio Vidal-Luengo and Veronica Zapata for correctly identifying the thermal component of the image. Read more in the related Image of the Day.
Every month on Earth Matters, we offer a puzzling satellite image. The March 2022 puzzler is shown above. Your challenge is to use the comments section to tell us where it is, what we are looking at, and why it is interesting.
How to answer. You can use a few words or several paragraphs. You might simply tell us the location, or you can dig deeper and offer details about what satellite and instrument produced the image, what spectral bands were used to create it, or what is compelling about some obscure feature. If you think something is interesting or noteworthy, tell us about it.
The prize. We cannot offer prize money or a trip on the International Space Station, but we can promise you credit and glory. Well, maybe just credit. Within a week after a puzzler image appears on this blog, we will post an annotated and captioned version as our Image of the Day. After we post the answer, we will acknowledge the first person to correctly identify the image at the bottom of this blog post. We also may recognize readers who offer the most interesting tidbits of information. Please include your preferred name or alias with your comment. If you work for or attend an institution that you would like to recognize, please mention that as well.
Recent winners. If you have won the puzzler in the past few months, or if you work in geospatial imaging, please hold your answer for at least a day to give less experienced readers a chance.
Releasing Comments. Savvy readers have solved some puzzlers after a few minutes. To give more people a chance, we may wait 24 to 48 hours before posting comments. Good luck!
