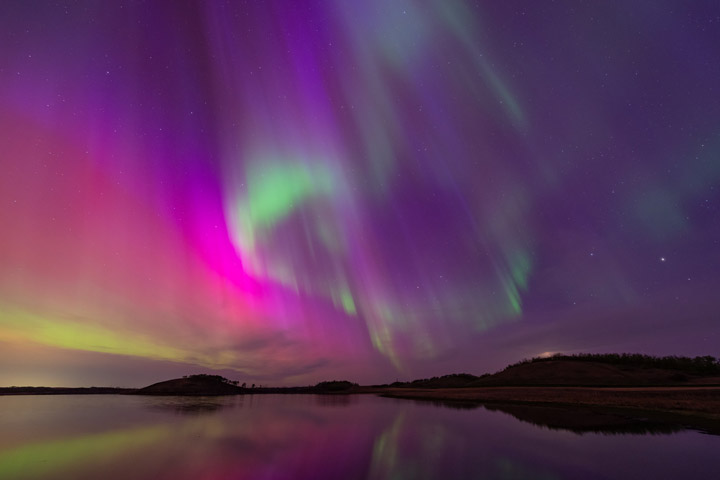
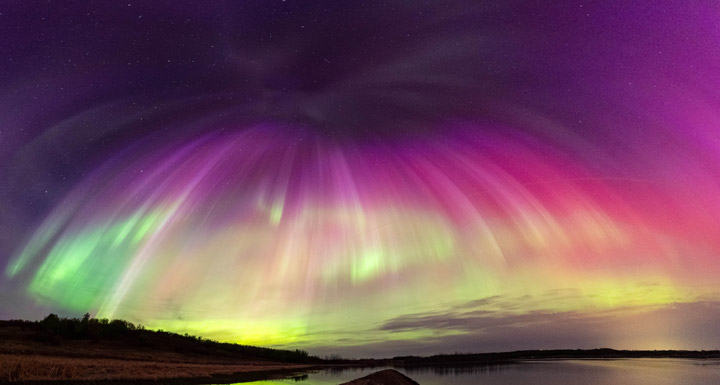
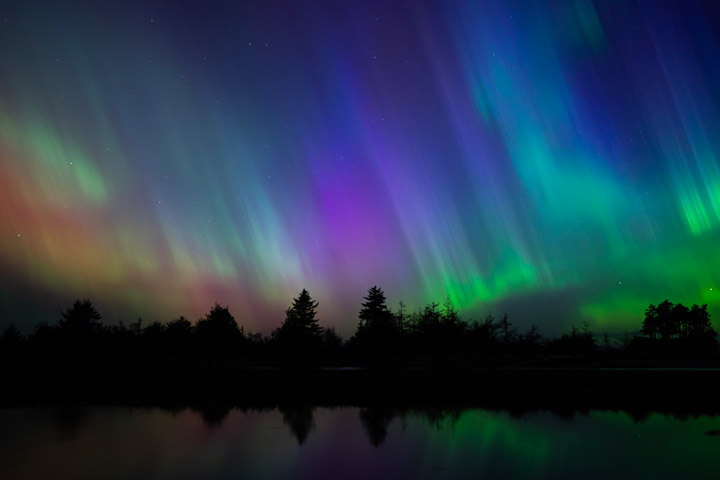
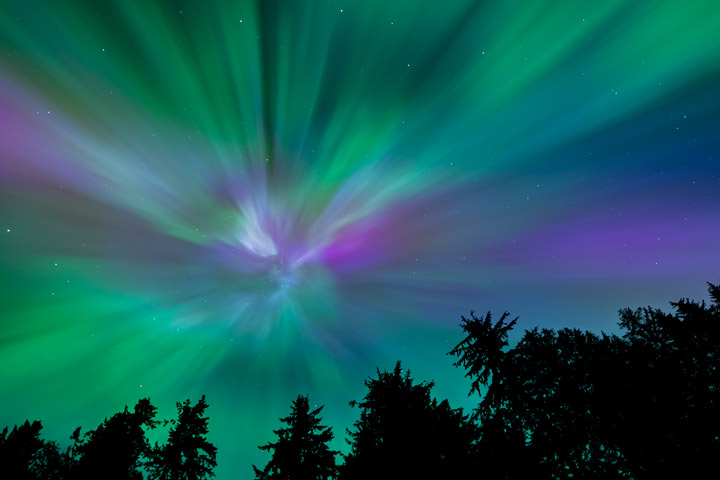
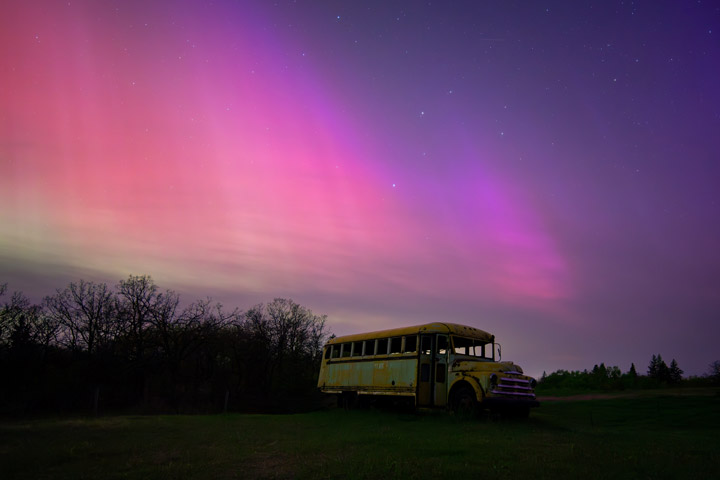
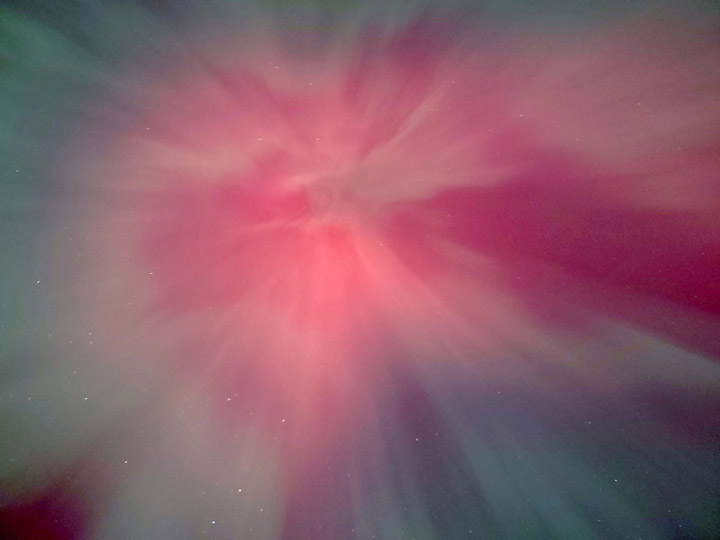
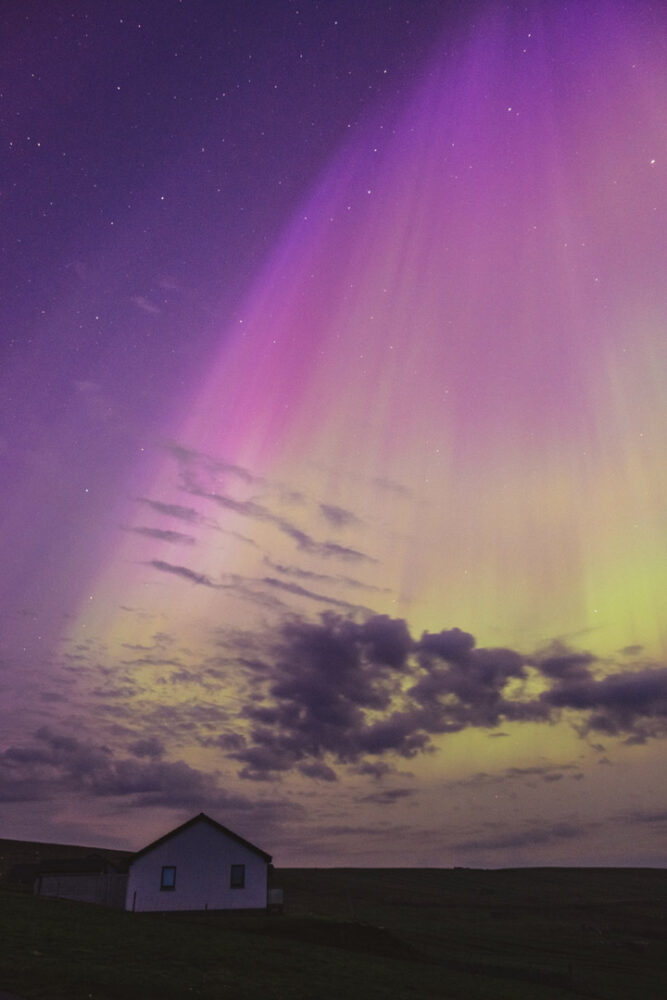
On May 11, 2024, the day-night band of VIIRS (Visible Infrared Imaging Radiometer Suite) on the Suomi NPP satellite spotted the aurora borealis over the United States during the strongest geomagnetic storm in over two decades. That same night, observers on the ground captured spectacular photographs of the dazzling light. The following photos represent just a handful of those shot by citizen scientists as part of NASA’s Aurorasaurus project, which tracks aurora sightings around the planet.


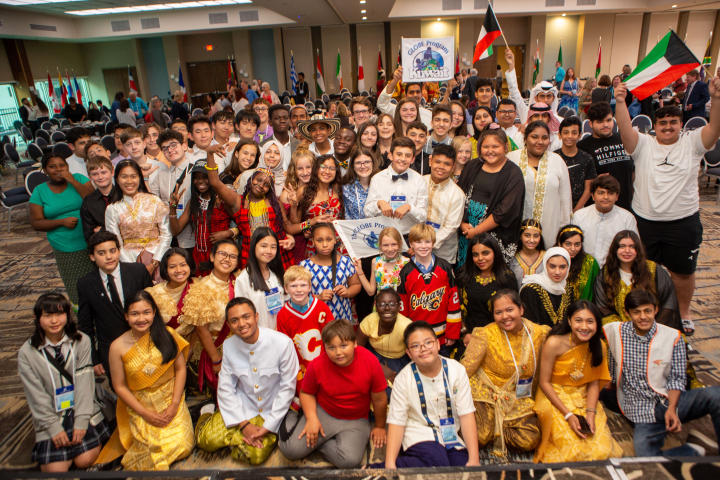
The NASA-sponsored Global Learning and Observations to Benefit the Environment (GLOBE) Program has received the American Geophysical Union (AGU) 2021 Excellence in Earth and Space Science Education Award. According to AGU, the annual award honors an individual, group, or team committed to promoting excellent geophysical education.
Through GLOBE, people around the world learn how to document and share useful information about their local environment with scientists. Launched on Earth Day in 1995, GLOBE connects scientists, teachers, and students in 126 countries with hands-on scientific activities.
“GLOBE is a phenomenal program that has a special place at NASA,” said Dr. Allison Leidner, program manager for education and communication in the Earth Science Division of NASA’s Science Mission Directorate. “Enabling students and citizen scientists to investigate our home planet gives them a greater appreciation of our environment, ignites their interest in science-related careers, and connects them to the international Earth science community. We are so happy to see AGU recognize GLOBE with this award.”
Through teachers that have been trained in GLOBE protocols, students learn how to conduct scientific investigations and collect data in their community. GLOBE science protocols were developed with Earth scientists and many protocols have connections to NASA’s satellite missions. So far, GLOBE participants have gathered and shared more than 200 million Earth science observations.
“The GLOBE Program has made outstanding achievements and contributions by pushing the frontiers of our science forward,” said AGU President Susan Lozier in a statement, on behalf of the AGU Earth and space science community. “GLOBE has also embodied AGU’s shared vision of a thriving, sustainable and equitable future for all, powered by discovery, innovation, and action. And you did this with integrity, respect, diversity, and collaboration while creating deep engagement in education and outreach.”
In addition to being sponsored by NASA, GLOBE is supported by the National Science Foundation (NSF), National Oceanic and Atmospheric Administration (NOAA), and the U.S. Department of State.
Dr. Tony Murphy, GLOBE Implementation Office director, and Dr. Caryn Long, middle school science teacher at Montverde Academy (Florida), share more about the program and its recent recognition. Their responses have been edited for clarity.
Tony Murphy: GLOBE has a strong community of citizen scientists, students, and teachers all over the world who are eager to contribute to Earth system science research. GLOBE allows people to contribute to data collection and submission, to understand the scientific research process and the work of scientists, and to see how their local environment fits into the regional and global environment.
Caryn Long: I have used GLOBE in my classroom for five years now. GLOBE is different from other science education programs because it educates students while also immersing them in the practical and applied nature of science. Knowing they are contributing to real research with NASA scientists is a powerful motivational tool to get them to practice the skills of observation, data collection, and analysis in a real and meaningful way. They want to practice the skills they are developing because what they are doing is valued.
Long: Our classroom participates in the Cloud, Aerosols and Hydrology Protocols and the Surface Temperature Field Campaign at the lake behind our school. We are adding more protocols each year. Each time I share with my students that we are learning a new protocol to add to their toolbox, they are excited to get started. What my students have enjoyed most about GLOBE is meeting some of the scientists that are involved with the program. Another highlight for them is gathering the cloud data because it involves NASA satellites. Receiving the email matches with the satellites is exciting to the kids because they love comparing what they saw from a ground level to what the satellite has viewed.
Murphy: Seeing students communicate their research at meetings, and especially at the two GLOBE Learning Expeditions I have attended, has been truly amazing. GLOBE Learning Expeditions are week-long, student-focused events held every few years at sites around the world. I gave a scientific presentation at a national science competition in Ireland when I was in middle school. That experience had a major influence on my life, so it’s incredible to see so many GLOBE participants have a similar opportunity.
Murphy: The GLOBE community has grown tremendously from a small number of countries in 1995 to 126 countries today with a database of over 200 million measurements for use in research by students and scientists. New technology advancements including the GLOBE Program’s app, GLOBE Observer, have impacted the ways in which the program is implemented and enables citizen scientists to participate. The GLOBE community worldwide, including students, country coordinators, teachers, program support staff, government officials, and program sponsors, have allowed GLOBE to earn this recognition.
Trees connect us scientifically, environmentally, and culturally. We all know that trees are vital to our planet’s health. As trees grow, they absorb carbon from the atmosphere, playing a vital role in Earth’s global carbon cycle and helping to regulate Earth’s carbon budget.
But before you read any further, look around…especially if you are outside. Most of you can look in any direction and see a tree. You might wonder about a few things like: “What type of tree is that?” or “Why is that tree so tall or short?” or “How old is that tree?” or even “Was that tree planted by someone, or did the wind blow a seed to where the tree is now standing?”
Or what if you don’t see any trees? What does that signify about the environment? Did nature make it that way, or did humans? All of these are great questions that can help us understand and connect with the environment.
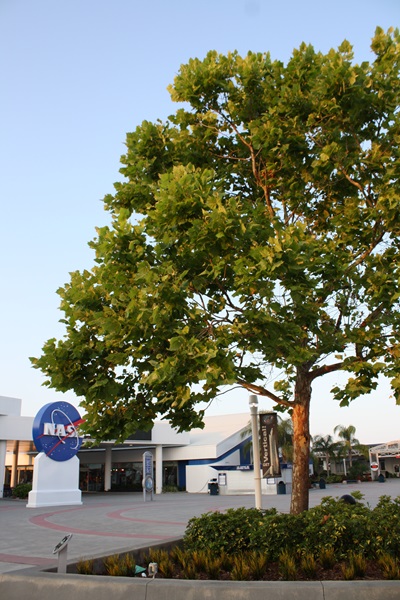
A few trees on Earth also connect us to the Moon. Have you ever heard of “Moon Trees?”
“Moon Trees” never actually grew on the Moon, but their seeds were taken into lunar orbit 50 years ago this week. The NASA Moon Trees history website explains:
Apollo 14 launched in the late afternoon of January 31, 1971, on what was to be our third trip to the lunar surface. Five days later, Alan Shepard and Edgar Mitchell walked on the Moon while Stuart Roosa, a former U.S. Forest Service smoke jumper, orbited above in the command module. Packed in small containers in Roosa’s personal kit were hundreds of tree seeds, part of a joint NASA/USFS project. Upon return to Earth, the seeds were germinated by the Forest Service. Known as the “Moon Trees,” the resulting seedlings were planted throughout the United States (often as part of the nation’s bicentennial in 1976) and the world. They stand as a tribute to astronaut Roosa and the Apollo program.
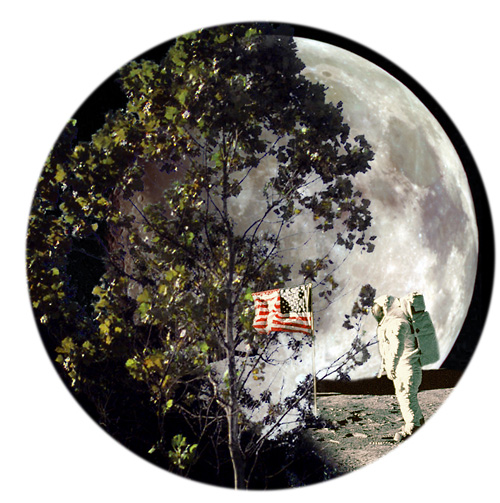
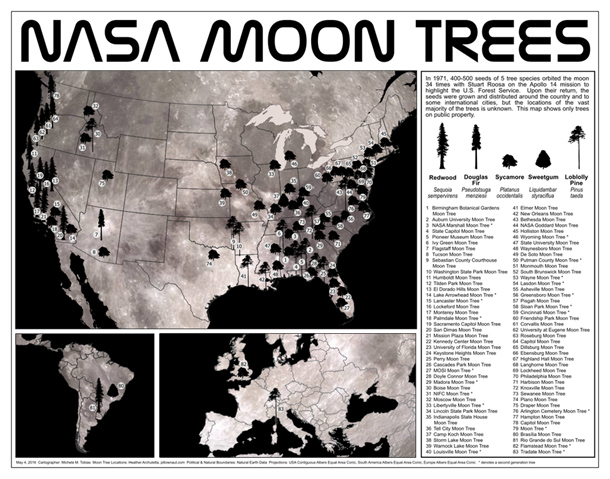
Among the Moon Trees that were eventually planted around the United States and the world were sycamores, Loblolly pines, redwoods, sweetgums, and Douglas firs. Though it is unlikely the Moon Tree seeds were changed much by their brief lunar orbit, it is still a wonder that they made it into space and back, and that many of the trees are growing and thriving today.
So, where can you find them? The NASA Moon Trees site has a list, and there is also an article and photographs from our friends at National Geographic. UC Davis data scientist Michele M. Tobias created the map below. You can also learn more about the trees from our colleagues at Marshall Space Flight Center.
Perhaps you might see some Moon Trees in person in the next year or two. If you do, consider making tree height observations using the tree tools on the NASA GLOBE Observer app. When completing your observation, let us know in the app.
Have you ever visited and seen a Moon Tree? Tell us about it below.
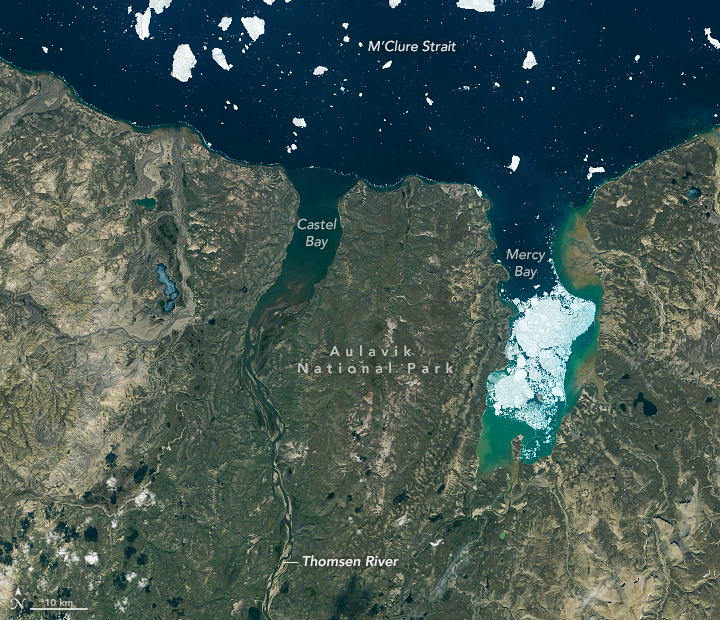
In a typical year, perhaps a dozen people visit Auluvik National Park in Canada’s Northwest Territories. Luckily, one of those visitors brought back some outstanding photos.
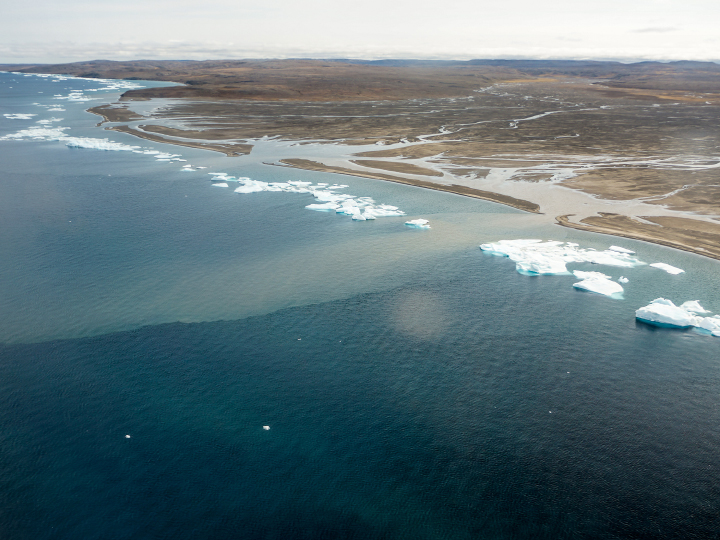
In November 2020, we highlighted a few compelling features around the Thomsen River estuary on Banks Island, including lines of sea ice tracing the shoreline and the braided pattern of the river. But there’s so much more to explore across this remote lowland tundra and river valley.
Robie Macdonald, a scientist at the University of Manitoba, shared some photos that he shot while doing fieldwork in the region between 2014 and 2016. The purpose of that project, led by Matt Alkire of the University of Washington, was to collect geochemical measurements from small rivers across the Canadian Arctic Archipelago.
“I really do love working in these places,” Macdonald said. “Once the aircraft has landed, one is bathed in a tremendous silence broken only by waves breaking on shingle. Then you have this incredible tundra spreading out toward the hills that define the river floodplain.”
Here are ten of Macdonald’s favorite photographs.
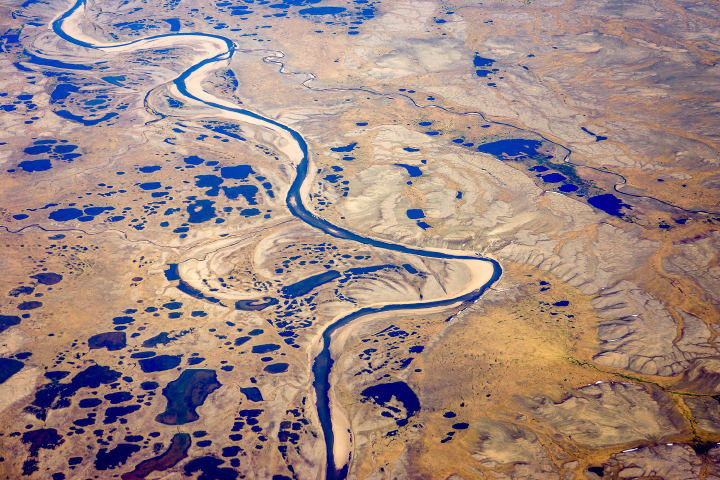
“Numerous ponds of all sizes populate the drainage basins of Banks Island, and you can see several clusters of them in the satellite image (top), especially along the small river to the west of the Thomsen. This photograph provides a closer look at one such pond cluster. In the image, you can also see textbook oxbows, which have become the setting for more ponds.”
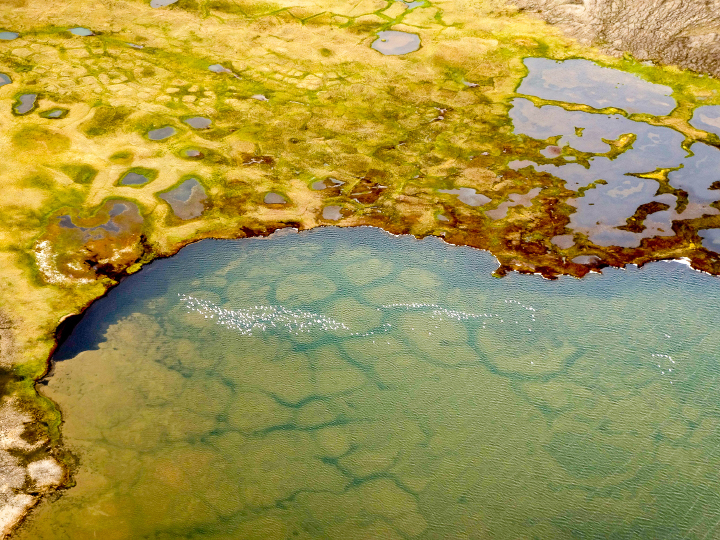
“During breeding season, it seems like almost every pond on Banks Island has its own population of snow geese (visible in this photo). You can also see old permafrost polygons that are now submerged within the pond. Polygons are widespread features of the permafrost in soil-rich locations and are produced over time by freeze-thaw cycles of the surface active layer. Permafrost thaw is widely impacting these regions, leading to feedbacks in the carbon system (CO2, CH4).”
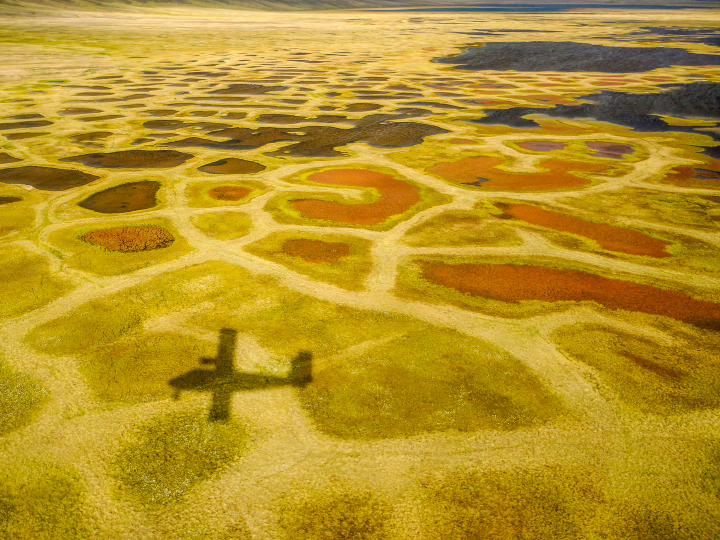
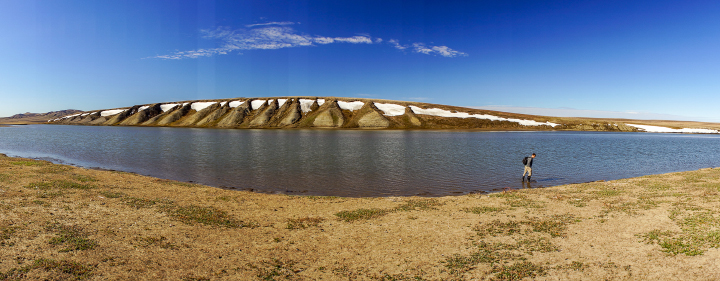
“Perhaps the most surprising characteristic of the valley bottoms in this ‘Arctic desert’ is the vibrant color of the vegetation: yellows, greens, and reds mark a dense ground cover that can be seen on the satellite image as areas with a yellowish-brownish cast.”
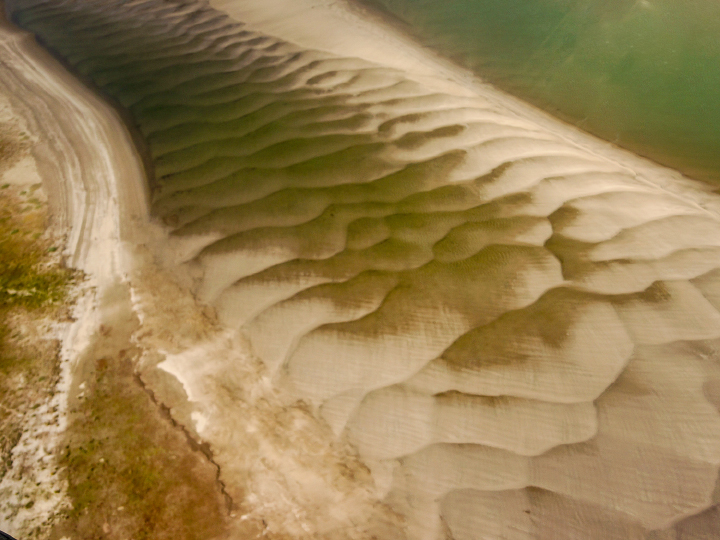
“As a result of the strong sediment supply, the large embayment at the Thomsen River mouth has been practically filled with sediment. The shallow water reveals itself in the satellite image by the lighter-greenish tone compared to water out in the channel north of Banks Island. More evidence of the ample sediment supply can be seen in beautiful displays of sand/silt ripples in the lower river between the islands. In the satellite image (top), the ripples are almost visible as grey zones between the islands before the river enters the open bay.”
“When walking on these islands near the river mouth, you can see evidence of bank erosion and ‘ice shoves.’ These are produced when wind forces newly formed ice to ride up over the river bank and gouge out the top layer of the silty material that makes up these islands. Unfortunately, ice shoves are too small to show on the satellite image.”
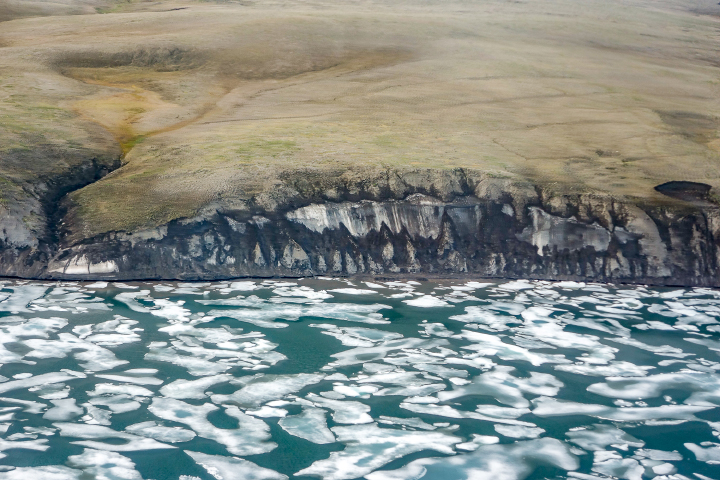
“Global warming and the extensive loss of sea-ice cover in late summer have helped accelerate coastal erosion and permafrost slumping. This image shows a section of coastline just to the east of the Thomsen River mouth that consists of a lot of frozen ice. This sort of permafrost is especially vulnerable to the changing temperature regime.”
“Thaw slumps are also a sign of the permafrost warming. These can be seen just barely in the satellite image as small dark regions along cliff faces–both facing the ocean and within the river drainage basins. Erosion and slumping expose ancient organic carbon to the air and the hydrosphere, thus providing an extensive positive feedback to climate warming.”
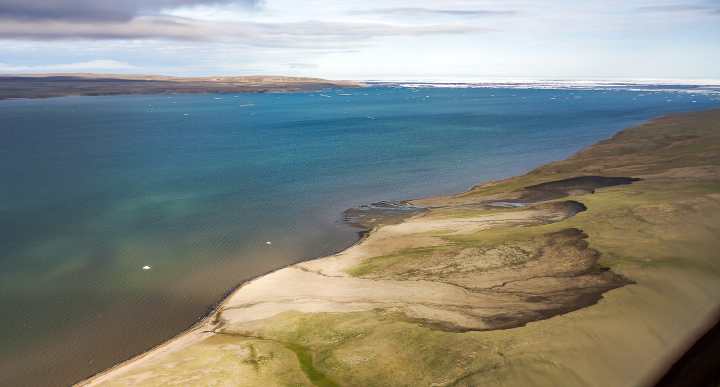
“Lines of bergy bits has collected along a thin shore margin at the point where the sea bottom rapidly deepens below ice keel depths, likely at approximately 2-4 meters. Although the grounded ice bits are continually melting, they are resupplied by more ice chunks shed from the permanent pack out in the channel. Two turbid plumes supplied by a river to the west of the Thomsen easily pass through the necklace of ice.”

“When we were sampling the water in this region, we found this ice barrier to be a bit more of a problem to navigate in our small inflatable boats, but ice along the shore did make it simple to sample sea ice. This image shows Greg Lehn preparing to launch our boat.”
Sampling in the Thomson River itself was somewhat simpler, once we had found a suitable place to land the plane. This image shows Greg Lehn scoping out the shore of the Thomsen River near its mouth.”
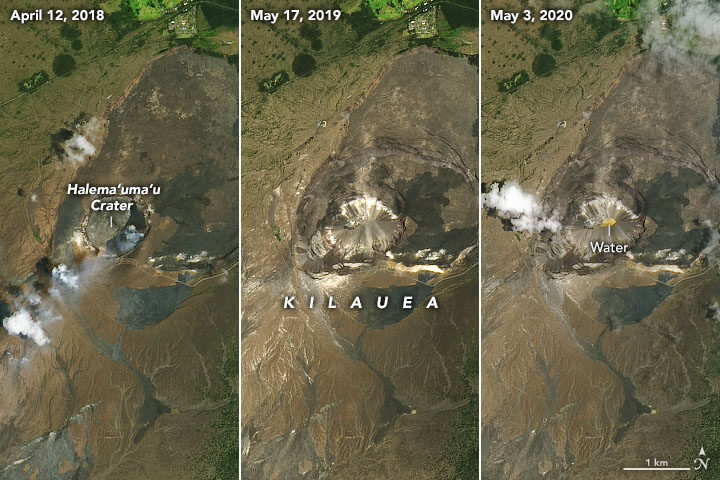
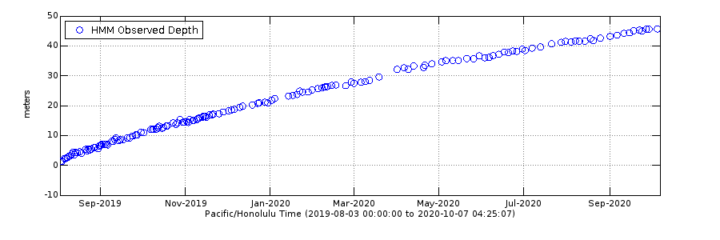
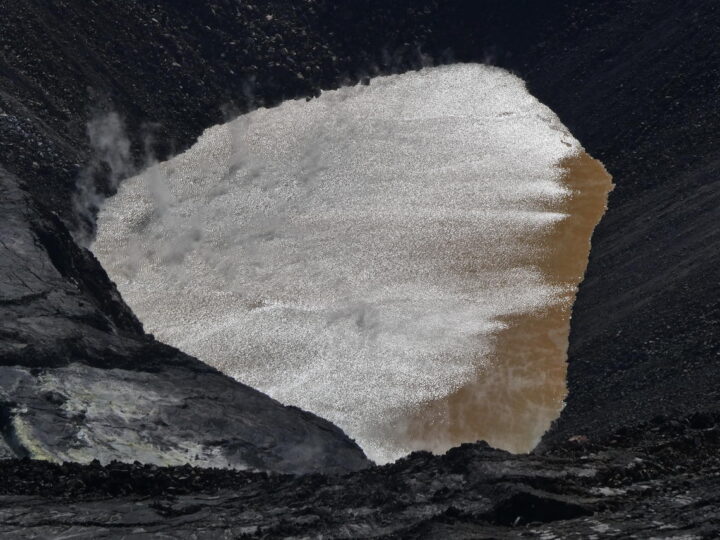
In May 2020, we published a story about a new lake growing in the summit caldera of Hawaii’s Kīlauea volcano. Six months later, the heated lake continues to rise. The water level now tops 40 meters (130 feet), according to U.S Geological Survey (USGS) measurements made with a laser rangefinder.
Though gentle “effusive” eruptions have been the norm at Kīlauea across the past two centuries, the geologic record shows plenty of evidence that the volcano has had periods when violent, explosive eruptions were common. The presence of water in magma is a key factor contributing to explosive eruptions, so USGS scientists have been carefully monitoring the volcano for signs that it may be entering a more explosive and dangerous phase.
As detailed in a September 2020 EOS article, that monitoring has included sending unoccupied aircraft systems (UAS)—drones—deep into the crater to get a closer look at the lake. Scientists have also been conducting regular helicopter flights over the lake and monitoring a suite of ground-based sensors (seismometers, GPS sites, thermal cameras, and others) that measure the motion of the ground, gaseous emissions, and the appearance and temperature of the lake.
Meanwhile, satellites provide the big-picture view. Landsat satellites periodically collect multi-spectral imagery of the lake; the images at the top of this page provide a natural-color perspective. Other satellites with Interferometric Aperture Radar (InSAR) complement the ground-based GPS sites by offering a crucial, large-scale view of land deformation.
“The chance to monitor an incipient volcanic lake is not unprecedented, but it is rare,” a group of USGS geologists wrote in EOS. “Kīlauea’s crater lake provides an opportunity to improve the scientific community’s understanding of how such lakes evolve and interact with magmatic systems below.”
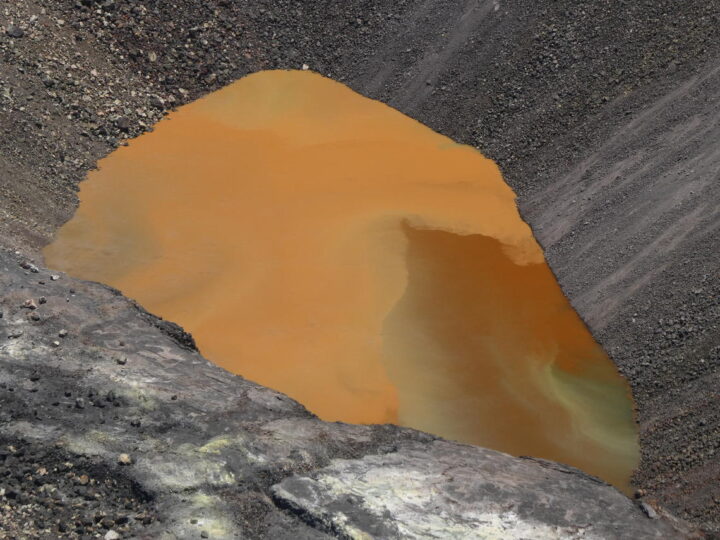
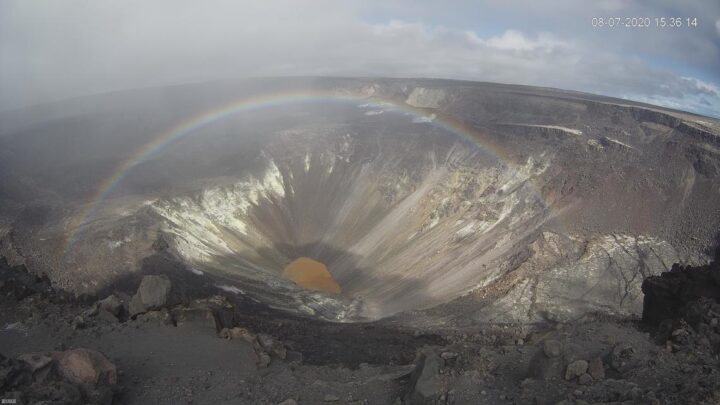
One byproduct of all the scientific monitoring is a steady stream of lake imagery that is visually striking as well as scientifically interesting. In July, for instance, morning sunglint transformed the muddy brown water to something that glittered and shimmered (see photo above). Influxes of new water often set up gradients of color that range from green to rusty orange (also above). And on a day when a light mist moved across the caldera, a webcam at the summit acquired a striking image of a rainbow framing the lake (below). You can find more images in Hawaii Volcano Observatory’s photo and video chronology.
The striking patterns in northeastern Canada’s flood basalts tell a story of continental collisions that played out almost two billion years ago. The large-scale patterns are visible from space—a wide view that provides a sweeping perspective on the region’s steps and folds cut by faults. But look closer, and then closer again, and other patterns and details emerge.
Deanne van Rooyen, a geologist at Cape Breton University, and David Corrigan of the Geological Survey of Canada, have been doing field work in the region to better understand the details of how the flood basalts evolved. They provided the following photos as examples of some of the details that become visible when viewed close up.

As described in detail in the Image of the Day, successive layers of flood basalt eroded and formed step-like features known as “traps.” The cliff face of each flow (or series of flows) represents a step, each standing about 50 to 70 meters (160 to 230 feet) tall. The steps were later folded as ancient, stable parts of Earth’s crust collided. The steps visible in the photograph above, shot from a helicopter, show some of these step-like features amid the central part of a folded structure.
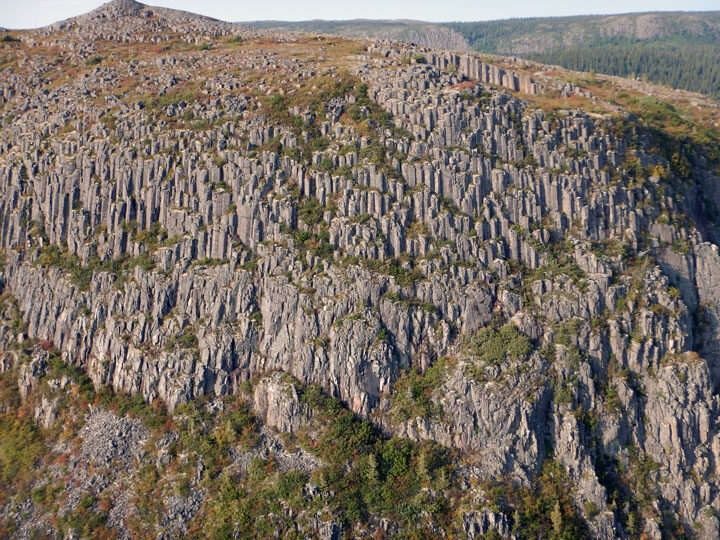
A closer look at the steps (above) reveals hexagonal columns in the flood basalts. These structures are known as “columnar jointing,” and form when layers of basalt cool and contract. They occur elsewhere around the planet too; a well-known example is the Giant’s Causeway in Northern Ireland.
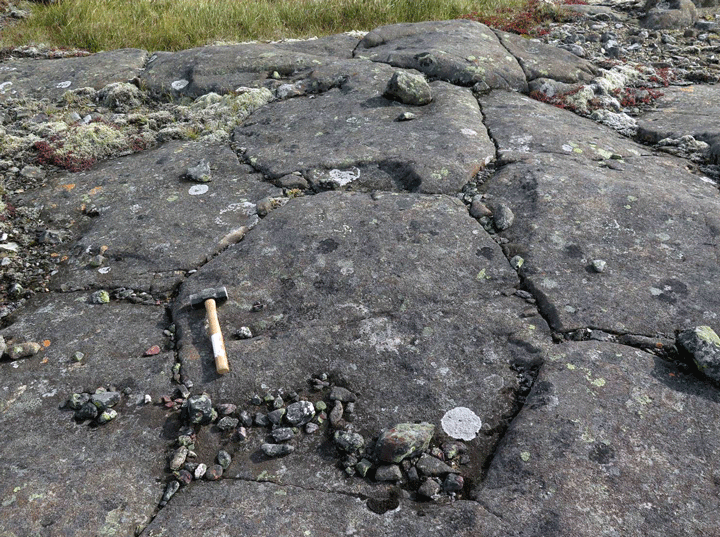
This photograph shows an even closer look at the column tops. Notice the hexagonal shape of the basalt. Corrigan and Van Rooyen are working on a detailed study of these basalts, which they refer to as the “Labrador Traps.”
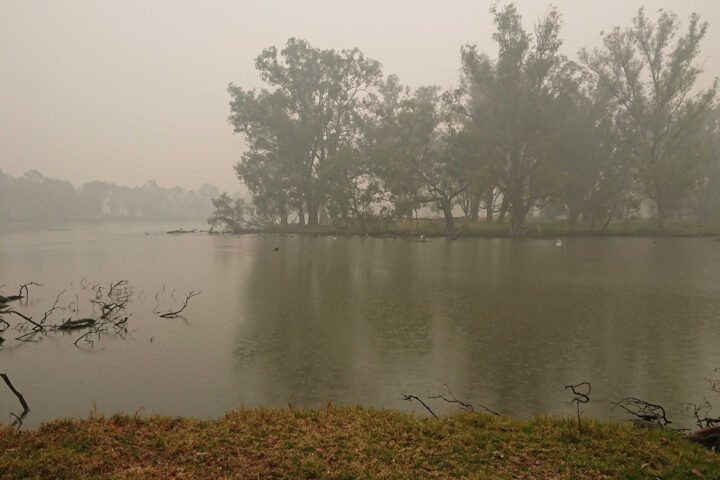
As satellites track Australian wildfire smoke from above, GLOBE Observer citizen scientists have been keeping tabs on hazy skies from the ground.
The photograph above shows smoke blanketing Horseshoe Lagoon in New South Wales on January 6, 2020, a day when clouds limited what sensors on Terra, Aqua, and Suomi NPP could observe as they passed over.
The video below, based on photographs taken by GLOBE citizen scientist Glenn Evans, juxtaposes satellite images and photographs taken of the sky at roughly the same place and time. The contrasting perspectives underscore how easy it can be to miss the forest for the trees — or, rather, the smoke plume for the clouds — if you aren’t careful. Kristen Weaver, the deputy coordinator for GLOBE Observer, compiled the photos and matched them with the corresponding MODIS satellite images.
Victoria and New South Wales are in the midst of one of the most severe fire seasons either state has seen in decades. After months of unusually hot, dry weather, hundreds of fires have charred an area larger than West Virginia, destroying thousands of homes and resulting in dozens of deaths.
GLOBE Observer is a citizen science project that is part of the Global Learning and Observations to Benefit the Environment (GLOBE) Program. Through a free app for their mobile device, anyone in participating countries can make environmental observations of clouds, trees, land cover, and mosquito habitats that complement NASA satellite observations.
In a recent article, we described a study of how road networks in the Congo Basin have changed over the past 15 years and how they have affected deforestation rates. Those networks have grown significantly, but not all roads lead to long-term forest destruction. By closing roads when they are no longer needed, people can help avoid permanent damage to the forest.
Though the researchers conducted much of their research via remote sensing and computer work, they also made several trips into the Congo Basin. Their photos shed more light on some of the economic activities in the rainforest.
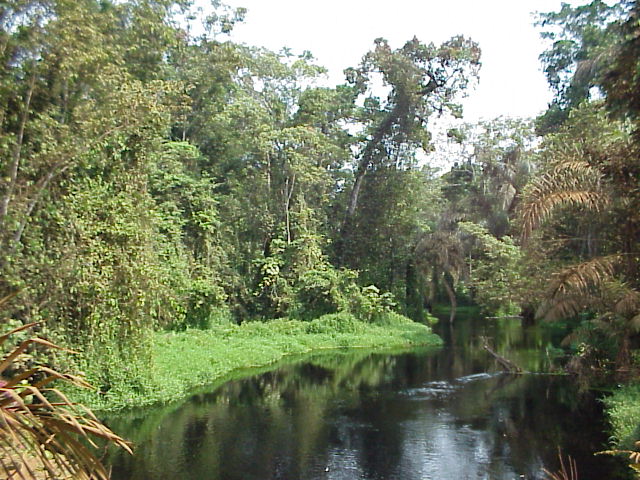
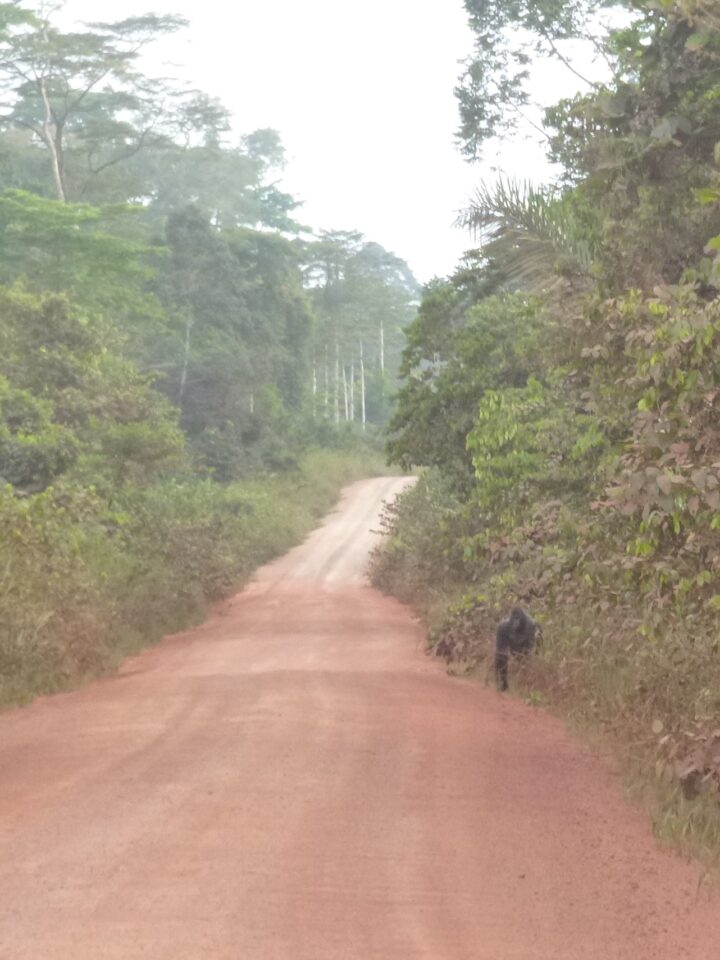
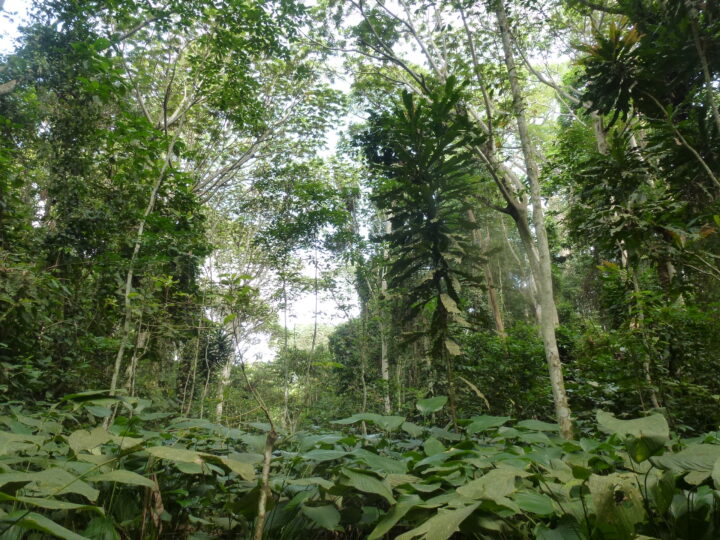
The Congo Basin is covered by tropical rainforests and swamps and is famous for its rich biodiversity. At two million square kilometers (1.2 million square miles), the Congo rainforest is the second largest in the world and about the size of Mexico. The image above shows a forested area near a stream in the Republic of Congo.
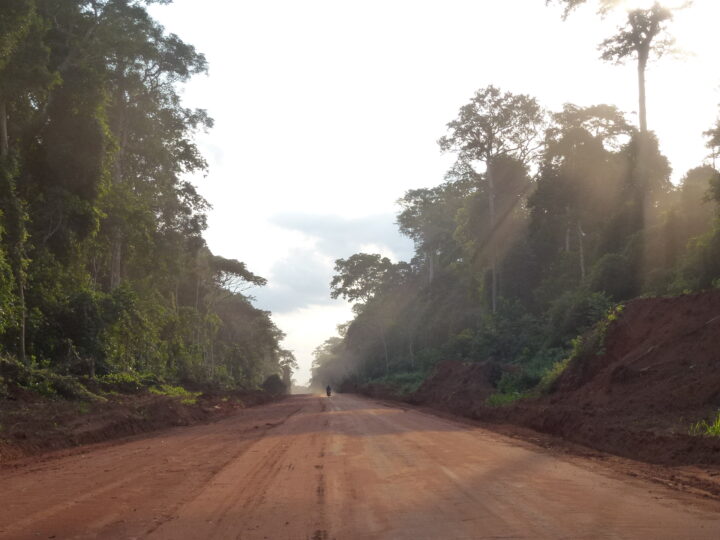
As road networks have expanded, the roads are bringing people deeper into the jungle and closer to wildlife. In general, forest roads lead to more human activity and to unregulated or destructive events, such as poaching, mining, or illegal logging. The image below demonstrates how roads are encroaching on wildlife habitats.
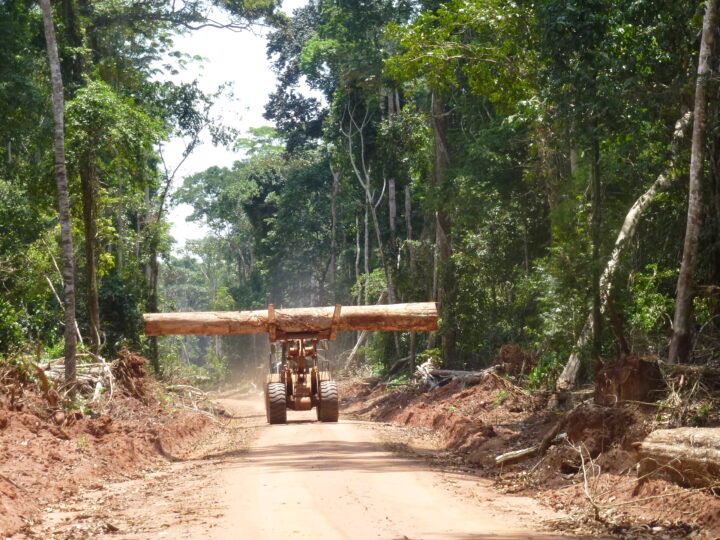
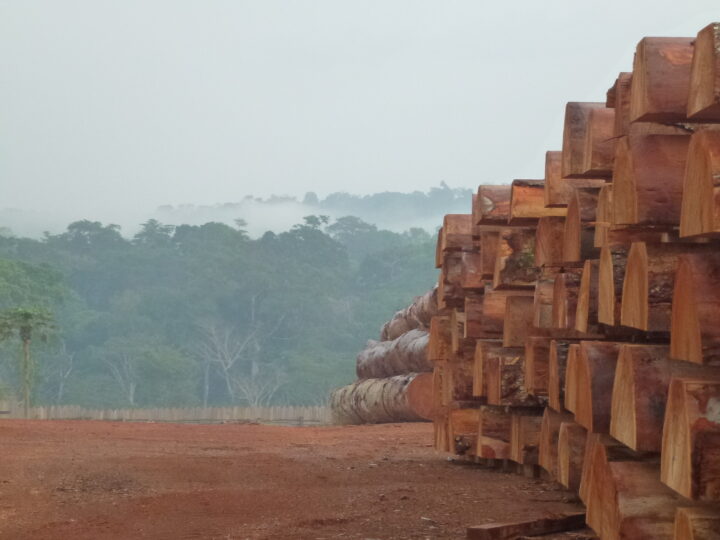
The majority of new roads are built for selective logging activities, which is one of the main economic activities in the rainforest. Companies practice selective logging where only the most valuable tree species are cut, which usually results in cutting one tree per hectare on average. In order to harvest this timber though, the companies must build roads, usually unpaved, that allow the trucks and tractors to drive deep into the forest. The photos below show scenes of timber extraction and a timber yard.
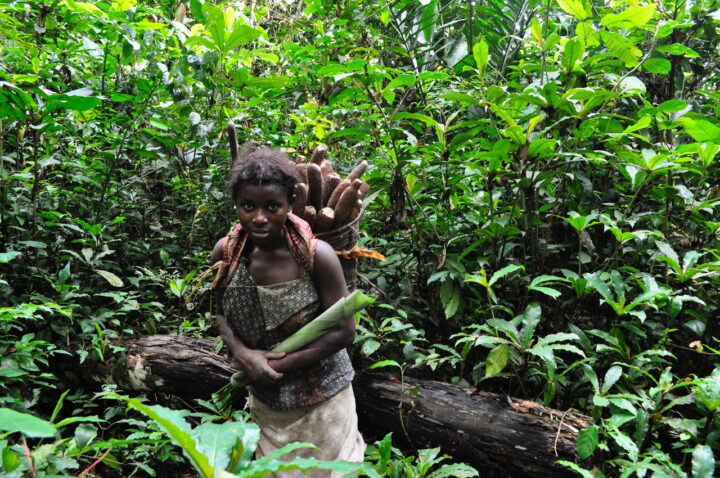
Sometimes roads are used by farmers to reach further into the forest and establish small-scale agricultural plots. The image below shows a small landholder in a forest near Mbandaka in the Democratic Republic of Congo. The woman is carrying a basket of manioc (cassava). She is also holding a maranthaceae leaf, which is commonly used for wrapping and cooking on a fire.
In the recent study, the researchers found that deforestation rates were highest around older, open roads. Specifically, the highest rates were found in the Democratic Republic of Congo due to agriculture and a high population density.
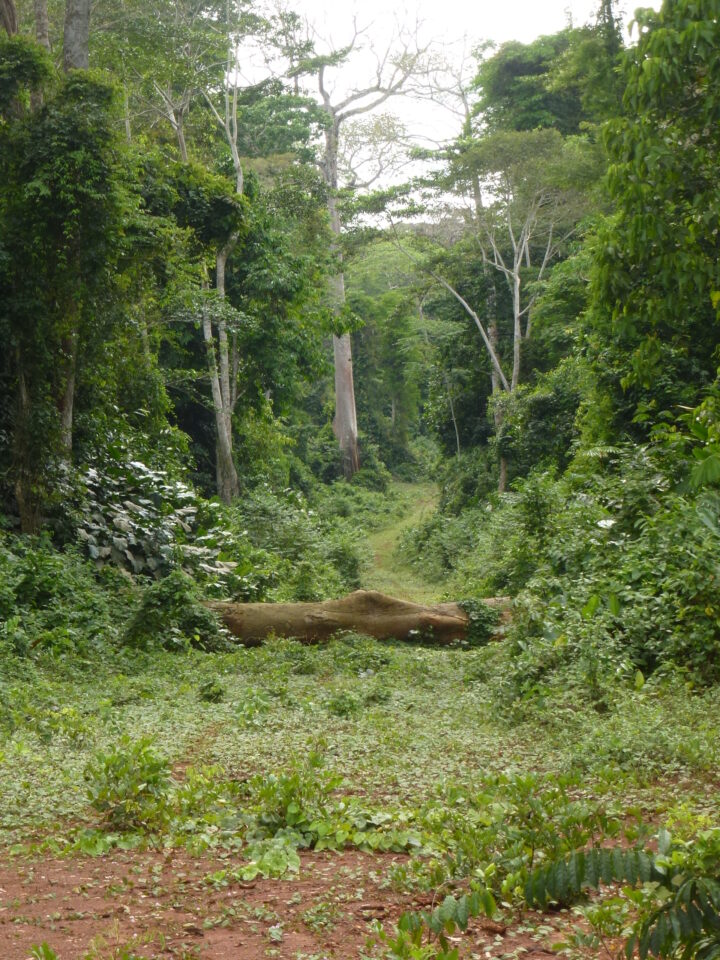
Researchers showed deforestation rates were the lowest around abandoned or closed roads. Abandoned roads reduce human traffic and allow vegetation to grow over the dirt path. The image below shows an abandoned road in the Republic of Congo that is overgrown with regenerating trees and plants. These plant species pictured are popular for gorillas to feed on and can help restore the gorillas’ natural habitat.
Abandoned roads were most commonly found inside logging concession areas. After a logging company was no longer using the road, the road was often closed or abandoned. Sometimes the road can be closed off by simply using a log to prevent vehicles from entering, as shown below.
To read the accompanying article, click here: When a Road Leads to Deforestation
Who knew that being a scientist could be as easy as pointing your phone at the sky? This month, NASA and the GLOBE Program are asking citizen scientists to take out their phones and report what kinds of clouds they see above them.
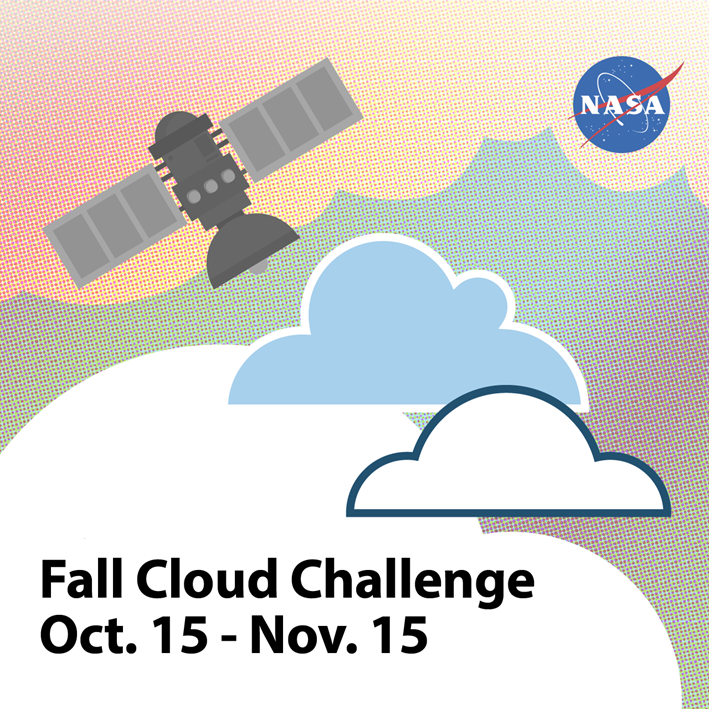
From October 15 to November 15 citizen scientists young, old, and in-between can submit up to ten cloud observations per day using the GLOBE Observer app or one of GLOBE’s other data entry options (for trained members). Participants with the most observations will receive a personalized thank you from a NASA scientist.
“What excites researchers about GLOBE observations is the ability to see what’s up in the sky from volunteers’ perspectives all over the world,” said Marilé Colón Robles, lead for the GLOBE Clouds Team at NASA’s Langley Research Center. “What our eyes can see is difficult to fully duplicate with instruments. Merging these views is what makes a complete and impactful story.”
“We want to do a data challenge in the fall and see if there are any differences from what was observed during the spring data challenge of 2018,” said Colón Robles. “From thin, high clouds that are hard for satellites to detect to dust storms that impact our daily lives, these observations play an important role in better understanding our atmosphere.”
At NASA, scientists work with a suite of satellite instruments known as the Clouds and the Earth’s Radiant Energy System (CERES). Though they have these highly sensitive instruments, it can sometimes be difficult for scientists to distinguish features such as cirrus clouds from snow cover in their imagery because both are cold and bright from a satellite perspective. By comparing satellite images from a particular area with data submitted by citizen scientists, researchers can differentiate between the two.
Lucky GLOBE observers might make an observation while the Cloud-Aerosol Lidar and Infrared Pathfinder Satellite Observation (CALIPSO) is overhead. CALIPSO is a joint mission between NASA and the French space agency (CNES) that uses laser pulses to measure clouds and atmospheric aerosols. Citizen scientists who make observations at the same time and place as CALIPSO will receive an emailed satellite comparison of CALIPSO’s measurements showing features such as high clouds, dust, and smoke. Scientists are especially interested in these observations in order to improve their understanding of dust storms. During the challenge, make sure you turn on daily satellite notifications in the app or use this satellite overpass website to see the schedule for your location.
“Last year’s challenge gave researchers special glimpses into cloud types around the world,” said Colón Robles. “Photographs provided by observers gave insight into events such as dust storms and wildfires. Our hope is to once again learn from the community and together study our atmosphere.”
The 2018 data challenge, which took place in the spring, received more than 56,000 cloud observations from more than 15,000 locations in 99 countries and Antarctica.
NASA is a sponsor of GLOBE, an international science and education program that provides students and the public with the opportunity to participate in data collection and the scientific process. NASA GLOBE Observer is a free smartphone app that lets anyone make citizen science observations from the palm of their hand.
Cloud Identification Resources and Tips
Data collection and data entry help
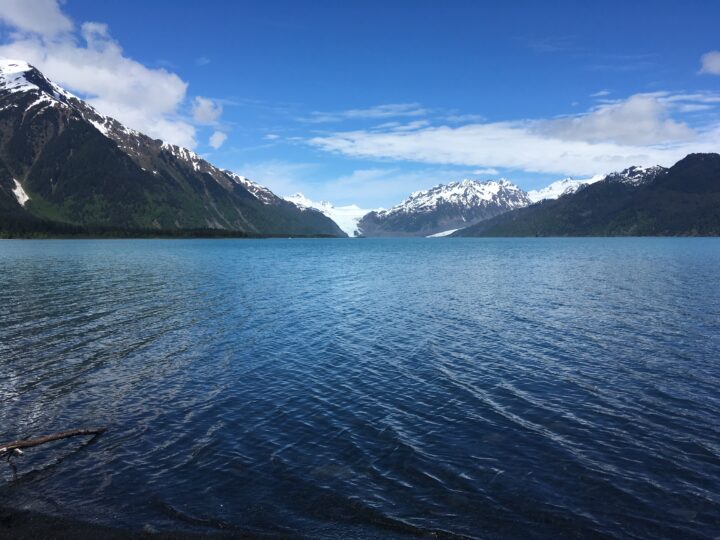
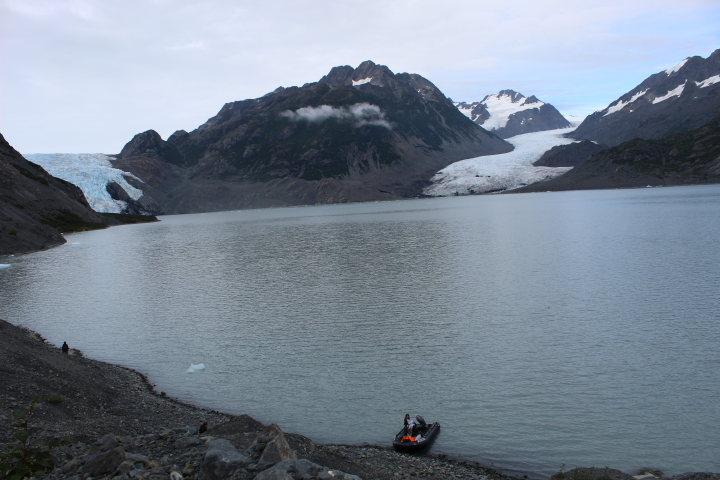
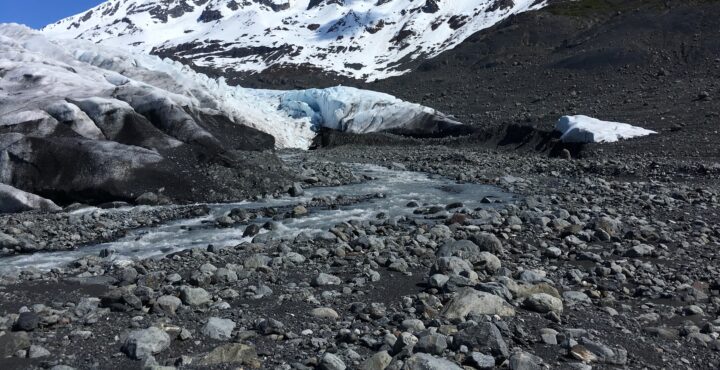
In a recent article, we showed satellite imagery of the dramatic retreat of Alaska’s Excelsior Glacier over the past two decades. The glacier has shortened by 30 percent since 1994, primarily due to rising temperatures and calving. What was once ice is now a pool of meltwater called Big Johnstone Lake. Images collected closer to the ground also show dramatic change.
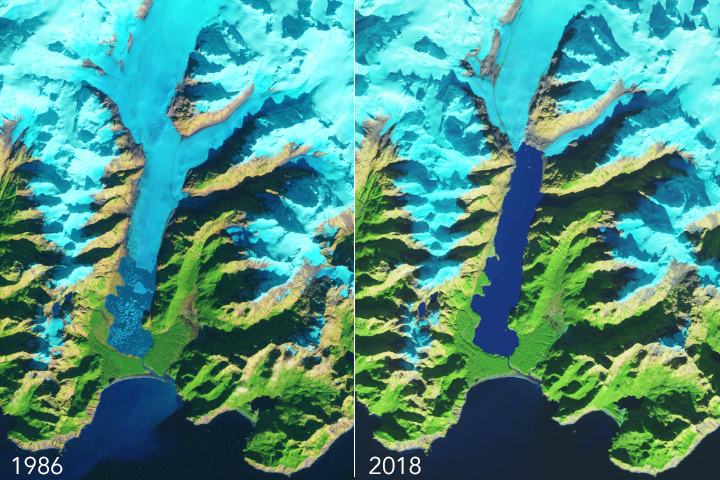
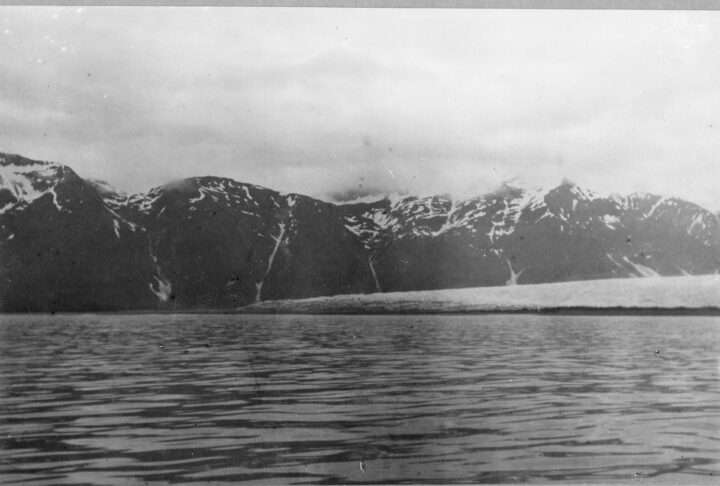
In photos taken in 1909 by the U.S. Geological Survey, Excelsior glacier nearly touched the Pacific Ocean, resting on a sliver of forested land. Today, the glacier is separated from the ocean by Big Johnstone Lake, which measures nearly five times the area of New York City’s Central Park.
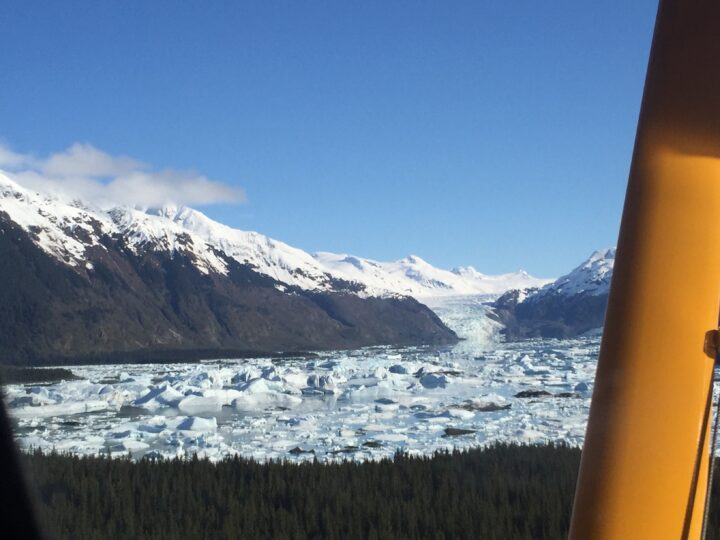
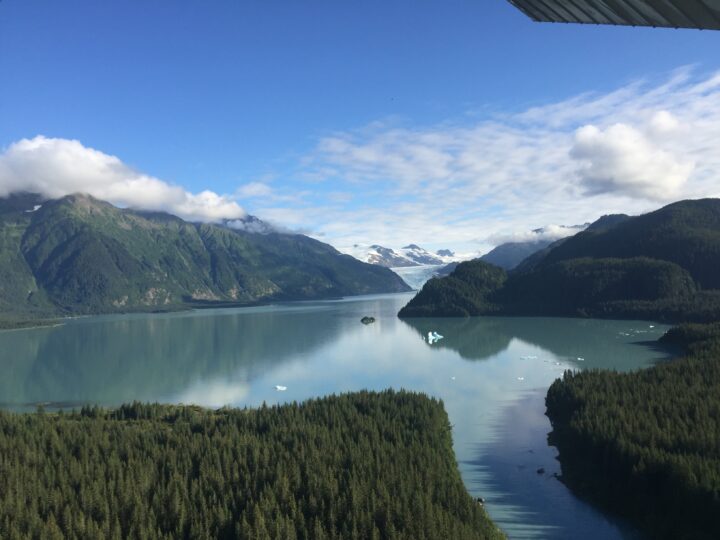
The following images were taken by staff from the Johnstone Adventure Lodge, which was built near the mouth of the glacier.
The image below shows Excelsior Glacier in 2016 (first) compared to 2018 (second). While the second picture was taken from a farther distance, the absence of icebergs in Big Johnstone Lake stands out.
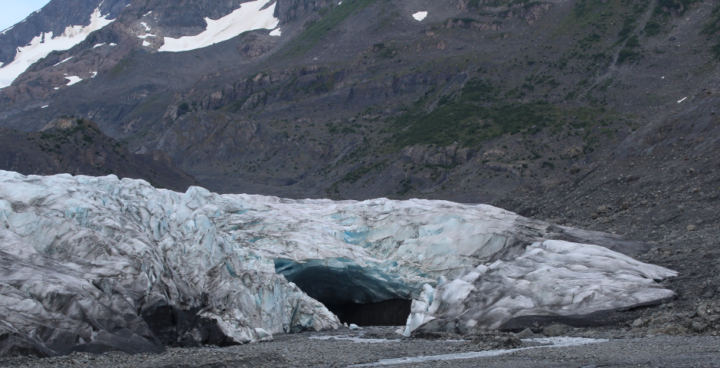
The following image also shows the complete separation of the glacier into its eastern and western tributaries (as seen in the top 2018 satellite photo). The owners of the lodge have named the right tributary “Roan Glacier.”
The following images show changes on Roan Glacier from 2018 to 2019. In 2019, you can see a rogue chunk of ice on right (first image below). According to the owners of the Johnstone Adventure Lodge, the chunk “was certainly not separated in September 2018,” as shown in the second picture.
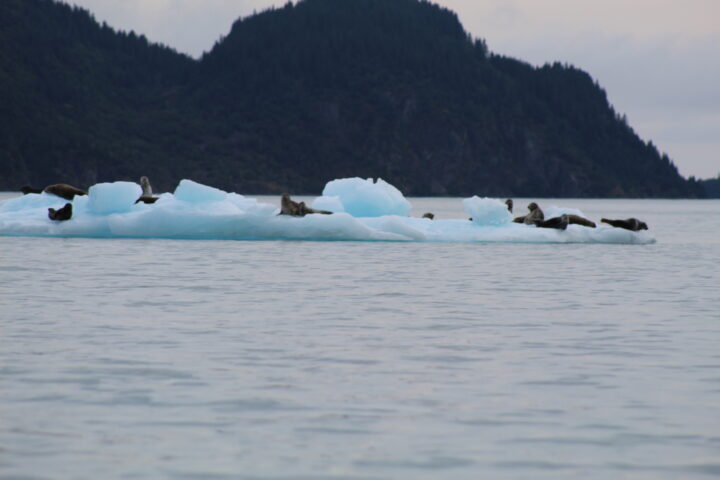
This last image shows 15-20 harbor seals that hang around the glacier. Harbor seals often haul-out on icebergs, so fewer icebergs will likely mean fewer seals as time goes on.