The American West is in the grip of an exceptional drought. Following one of the planet’s hottest years on record — and with rainfall and snowfall in the western U.S. well below average — water managers, policymakers, government agencies, and scientists are facing strapped water supplies and anticipating potentially devastating wildfires.
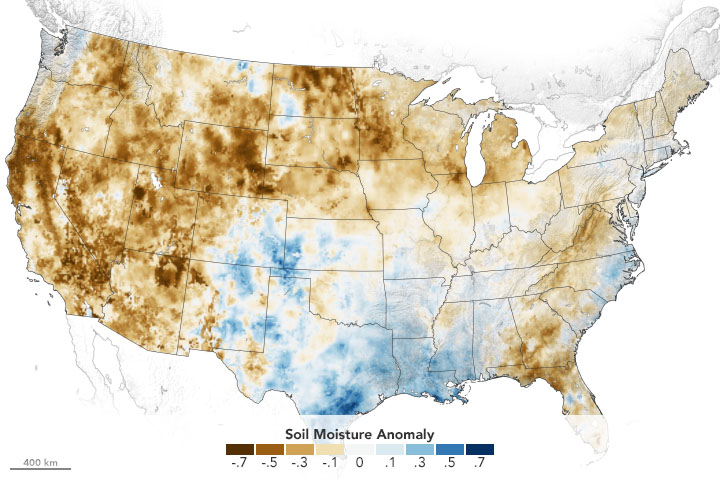
Using its satellites, aircraft, and computer models, NASA is helping water managers respond. NASA’s drought resource page details how the agency is helping farmers, reservoir managers, and decision makers track and monitor the ongoing drought, predict how much water will be available, and help improve how we use the water we have. The site will be updated throughout the year.
Underpinning all of this is NASA’s expertise in water science, our partnerships with water managers across the country, and our leadership in space and remote-sensing technology.
Learn more at the drought resource page.
From Wisconsin to Washington D.C., pollen counts were quite high this spring, making seasonal allergies brutal for many people. Recent research shows that changes in the onset of spring—both early and late—can extend allergy misery and lead to more severe asthma for some people.
Warm springtime temperatures signal shrub buds to burst, trees to leaf-out, and flowers to bloom. As plants produce and release pollen, our bodies can mistakenly identify it as a dangerous intruder to our respiratory systems. Our immune systems produce chemicals to fight it, inducing sneezing, watery eyes, and stuffy noses. Research also shows allergenic pollen is also among the leading risk factors known to worsen asthma.
Amir Sapkota, a professor of public health at the University of Maryland, and his colleagues investigated how changes in the timing of spring onset affected asthma hospitalizations in Maryland over the past decade. The team used the Normalized Difference Vegetation Index (NDVI), which shows the relative “greenness” of vegetation, to determine the timing of the spring onset. (The data come from the Moderate Resolution Imaging Spectroradiometer (MODIS) on NASA’s Aqua and Terra satellites.) The team combined the satellite data with pollen counts and inpatient hospital admissions from the Maryland Department of Health.
They found that very early onset of spring (10 days early) was associated with a 17 percent increase in asthma hospitalizations in Maryland from 2001-2012, while late onset (3 days later) was associated with a 7 percent increase.
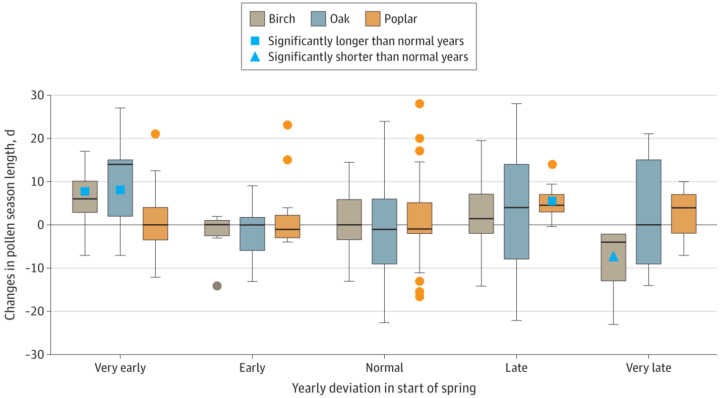
Sapkota explained that the hospitalization risk increased because of changes in pollen dynamics. Tree pollen is common in spring, while grass and weed pollen are more common during summer and fall. According to Sapkota, an early onset of spring leads to earlier and longer tree pollen seasons. At the other end, late onset causes different species of trees to bloom at the same time, thus increasing overall pollen levels in the environment. Both scenarios can lead to increases in asthma hospitalizations.
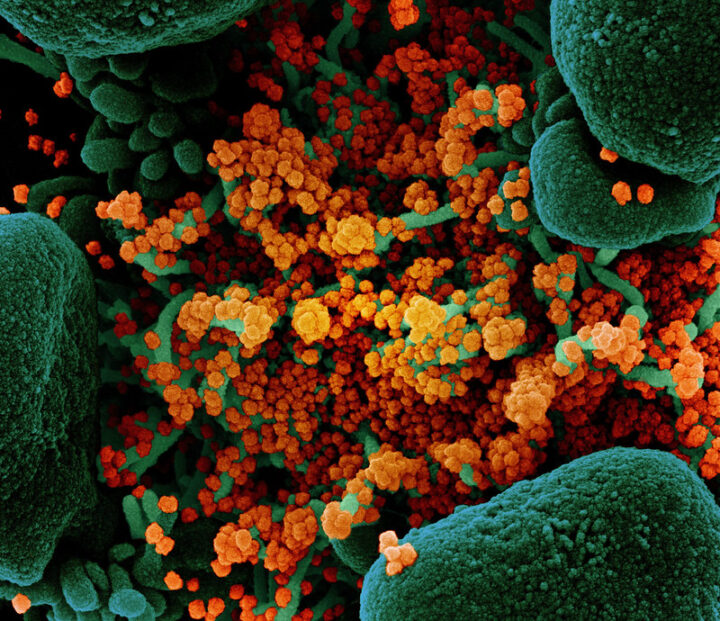
According to a new report from the World Meteorological Organization, seasonal weather conditions have not yet played a large role in influencing the spread of the virus that causes COVID-19. Government interventions and human behavior have been much more influential, according to the group of experts in Earth science, medical sciences, and public health.
“We saw waves of infection rise in warm seasons and warm regions in the first year of the pandemic, and there is no evidence that this couldn’t happen again in the coming year,” said Ben Zaitchik, the co-chair of the World Meteorological Organization team and a Johns Hopkins University earth scientist. At the start of the pandemic, there was some speculation that seasonal weather could influence the spread of COVID-19, with the virus spreading more readily in cooler, drier weather and spreading less in warmer, wetter seasons. “At this stage, evidence does not support the use of meteorological and air quality factors as a basis for governments to relax their interventions aimed at reducing transmission.”
Zaitchik also leads a NASA-funded team assessing the same topic. As we reported in August, that team is using weather reanalysis models and various statistical techniques to look for signals in satellite data and other sources of environmental data. Their goal is to detect potential relationships between environmental conditions (such as temperature, humidity, ultraviolet light, and rainfall) and the spread and severity of COVID-19.
Zaitchik recently published an article in Nature Communications that urges the research community to strive for rigor in designing studies on COVID-19 seasonality and for clarity in communicating findings so as to avoid confusing the public and policymakers with conflicting results. We checked in with Ben in March 2021 for an update on his research as COVID-19 cases were dropping in the United States and other countries.
Earth Observatory: The number of COVID-19 cases has been on quite a roller-coaster ride this year. What are the main drivers of the ups and downs in infection rates?
Zaitchik: It is pretty clear that the primary driver is still human behavior. When we stay home and stay socially distant, there is less transmission. That explains the biggest swings we’ve seen in the case curve in the United States and in other countries. As we see vaccines roll out in some countries, along with accumulating infections, we are likely also seeing the beginnings of herd immunity playing a role.

EO: We saw a surge of cases in the United States in the early part of winter and then a drop in February. Is that related to the weather?
Zaitchik: There are direct ways that weather might affect virus survival or our immune systems, but the most important effect now is indirect. If weather conditions make it easy for people to stay outside and to avoid crowding, then it is possible the weather can reduce transmission rates; vice versa if people are crowding indoors. That understanding is based on our experience with other upper respiratory viruses; on studies that show the potency of transmission in crowded indoor environments; and to some extent statistical analyses of patterns we have seen in the first year of COVID-19. But that last line of evidence still requires investigation. While the number of cases can sometimes align with seasonal patterns, that is not always the case. It does appear that weather conditions can reinforce case trends, but the impact of weather is still highly uncertain.
EO: Is it fair to say that how people behave in cooler, drier seasonal conditions is probably more important than how the virus reacts to the environment?
Zaitchik: It does appear that virus sensitivities exist. Coronaviruses are less stable at higher temperatures, when exposed to intense sunlight, and under certain humidity conditions. It is just not clear yet whether those sensitivities have mattered appreciably for transmission of COVID-19 so far. In general, those sensitivities suggest there are better chances for the virus to survive and thrive under wintertime conditions, leading to greater transmission potential. But in the end, the main driver of the spread is human behavior.
EO: How is your NASA-funded research project on COVID-19 seasonality going? Do you have any results yet?
Zaitchik: We have made a lot of progress on data integration and alignment, which has allowed us to release a consistent and quality-controlled database of COVID cases and hydrometeorological variables that is available to the public via GitHub. We think this is really important for studies of weather and COVID-19 since so many studies have suffered from questionable data or have been unrepeatable. We’ve also begun to understand why there were so many conflicting results in early publications on COVID’s weather sensitivity, and how the contribution of human movement to predictability of transmission rate has changed over time.
EO: How has your thinking changed about the potential seasonality of COVID-19 since the beginning of the pandemic?
Zaitchik: It hasn’t really changed much. Going into this, epidemiologists anticipated that we might see something like a cold weather peak in transmission just because so many other upper respiratory viruses do that. But we also knew that our instincts on seasonality come from endemic diseases like influenza, and that there is plenty of evidence from previous epidemics that viruses can spread even when the weather is unfavorable. That we are seeing some evidence of seasonality — but with lots of unexplained variability — is reasonably consistent with what epidemiologists expected.
EO: Americans are most familiar with how the pandemic has progressed in this country, while satellites excel at showing a global perspective. What are you seeing and learning from global data?
Zaitchik: The global perspective is really important. From a weather and COVID-19 perspective, we have seen interesting hemispheric patterns. For instance, there is some evidence that Southern Hemisphere countries experienced a peak in their winter, while Northern Hemisphere cases rose as our winter settled in. But there are also exceptions to that pattern, like the summertime peak in the US or the consistently low case counts in east Asian countries. Looking at the environment across countries and climate zones, we see a complicated, multi-scale set of patterns that we need to decipher. The global perspective is powerful because it has the potential to yield some general insights. It is also powerful because it can correct some too-simple narratives that have emerged from looking at one country at a time.
NASA, the European Space Agency (ESA), and the Japan Aerospace Exploration Agency (JAXA) have joined forces to create the COVID-19 Earth Observation Dashboard. The web platform combines the collective scientific power of the agencies’ Earth-observing satellites to document changes in the environment and society in response to the pandemic.
The dashboard is a user-friendly tool to track changes in air and water quality, climate change, economic activity, and agriculture.
Air quality changes were among the first noticeable impacts of pandemic-related stay-at-home orders, and the resulting reductions in industrial activity, that could be tracked through satellite observations. Reductions in nitrogen dioxide (NO2) levels — primarily related to temporary reductions in the burning of fossil fuels — show up clearly in satellite data.
A preliminary analysis also indicates that planting (farming) activity dropped during the quarantines and lockdowns. For example, the cultivated area of white asparagus in Brandenburg, Germany, has been 20 to 30 percent lower this year, compared to 2019. More information on agricultural productivity changes will be added to the dashboard in the months to come.
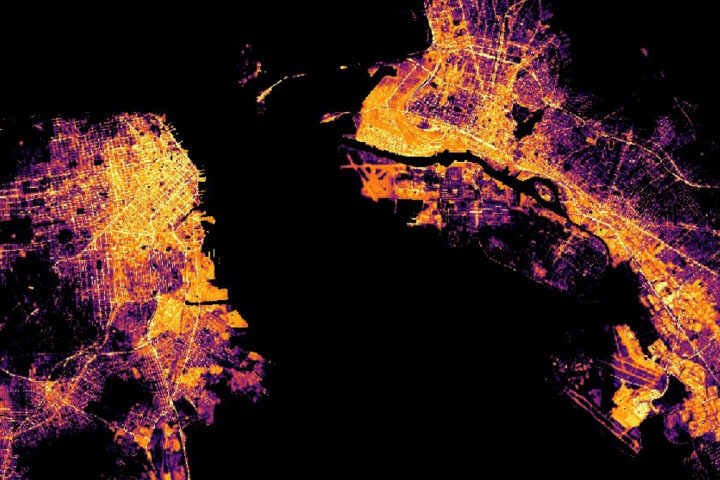
Recent water quality changes have been reported in a few locations that typically have intense industry and tourism — activities that have decreased during the pandemic. Data on ship identification, construction activity, and nighttime lights (above) are featured on the dashboard to keep track of some of the economic ramifications of the virus.
Together, ESA, JAXA, and NASA will continue to add new observations to the dashboard in the coming months to see how these indicators change. Learn more in the NASA press release, the video below, or by exploring the dashboard.
To counter the rapid spread of COVID-19 in the winter and spring of 2020, quarantines and social distancing measures were implemented around the world. Air traffic nearly ceased; non-essential businesses were closed; and the number of vehicles on the road fell well below normal.
Remote sensing scientists have started looking at potential changes in the environment due to these changes in human behavior. They are looking for signs of how environmental factors such as humidity, temperature, and ultraviolet radiation might play a role in the behavior of the virus. Some may also look for data related to access to water resources, which can be critical to the spread or prevention of certain diseases.
NASA’s Earth Science Data Systems program has developed a new web-based tool, the COVID-19 Data Pathfinder, which provides links to datasets that can be used to research changing environmental impacts from modified human behavior patterns, the possibility of seasonal trends in virus transmission, and water availability. The COVID-19 Data Pathfinder is also a resource for participants in NASA’s Space Apps COVID-19 Challenge, providing an intuitive means for new users to find and use NASA data.
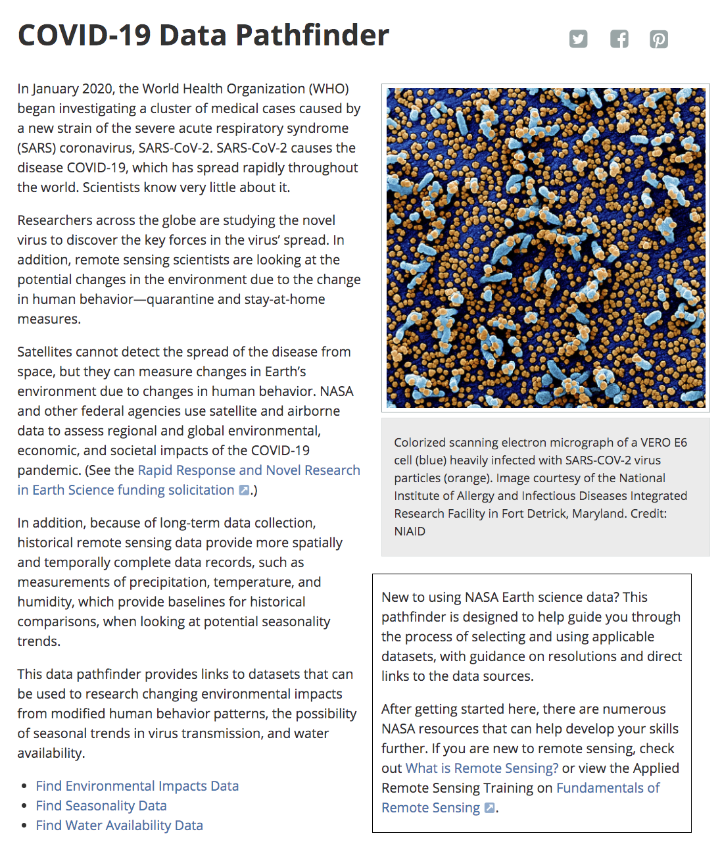
Web view of the COVID-19 Data Pathfinder page
In a recent article, we described a study of how road networks in the Congo Basin have changed over the past 15 years and how they have affected deforestation rates. Those networks have grown significantly, but not all roads lead to long-term forest destruction. By closing roads when they are no longer needed, people can help avoid permanent damage to the forest.
Though the researchers conducted much of their research via remote sensing and computer work, they also made several trips into the Congo Basin. Their photos shed more light on some of the economic activities in the rainforest.
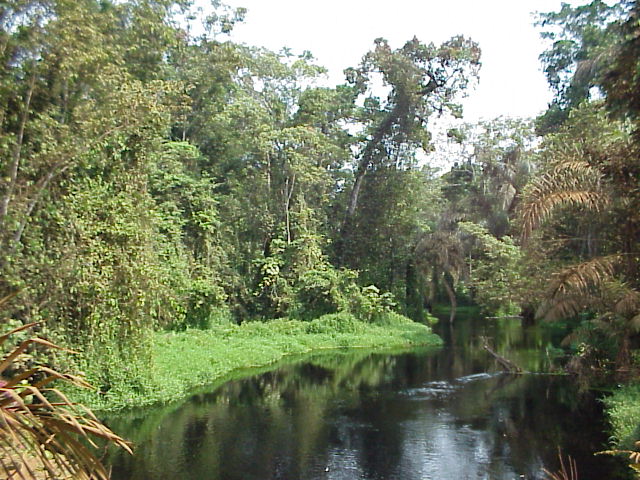
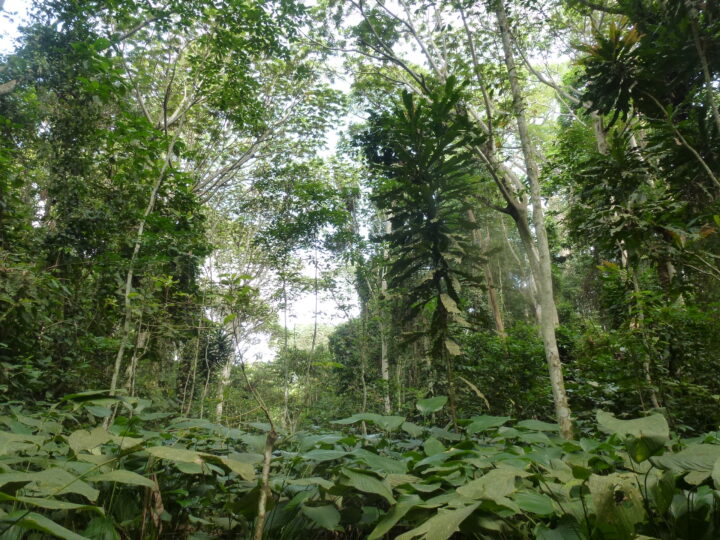
The Congo Basin is covered by tropical rainforests and swamps and is famous for its rich biodiversity. At two million square kilometers (1.2 million square miles), the Congo rainforest is the second largest in the world and about the size of Mexico. The image above shows a forested area near a stream in the Republic of Congo.
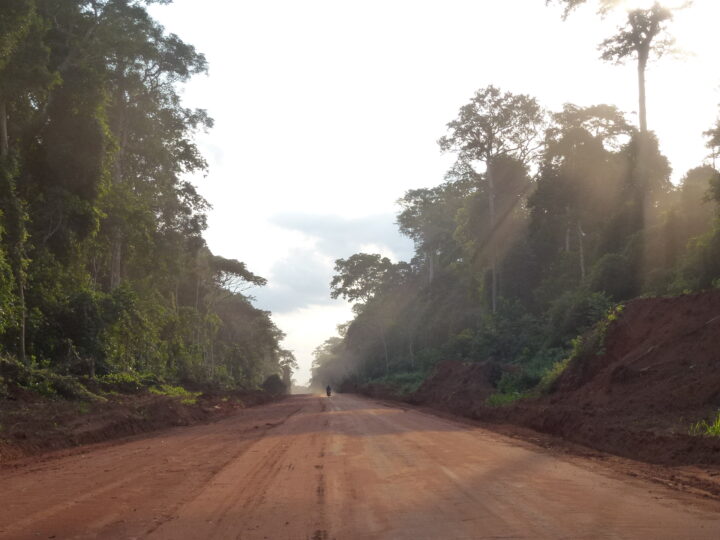
As road networks have expanded, the roads are bringing people deeper into the jungle and closer to wildlife. In general, forest roads lead to more human activity and to unregulated or destructive events, such as poaching, mining, or illegal logging. The image below demonstrates how roads are encroaching on wildlife habitats.
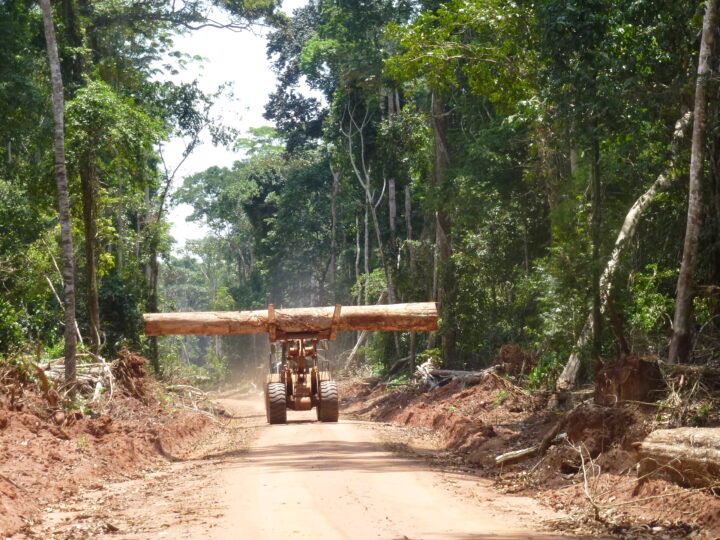
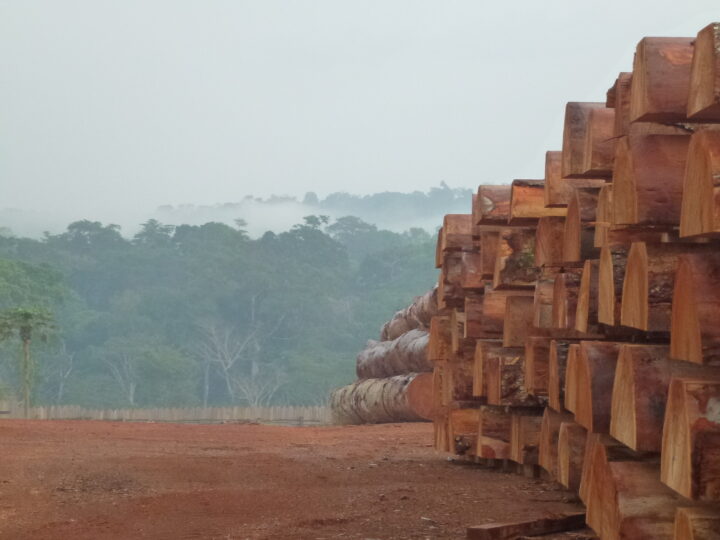
The majority of new roads are built for selective logging activities, which is one of the main economic activities in the rainforest. Companies practice selective logging where only the most valuable tree species are cut, which usually results in cutting one tree per hectare on average. In order to harvest this timber though, the companies must build roads, usually unpaved, that allow the trucks and tractors to drive deep into the forest. The photos below show scenes of timber extraction and a timber yard.
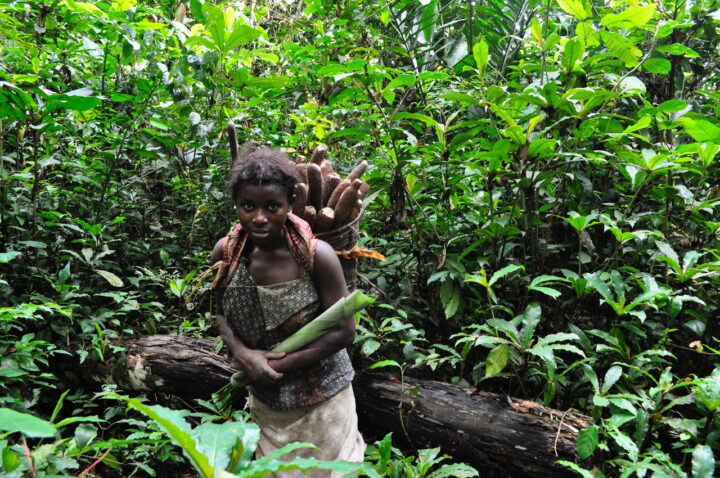
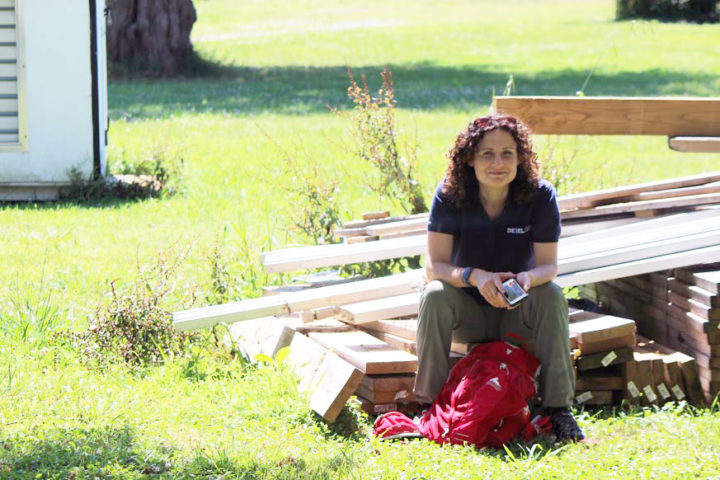
Sometimes roads are used by farmers to reach further into the forest and establish small-scale agricultural plots. The image below shows a small landholder in a forest near Mbandaka in the Democratic Republic of Congo. The woman is carrying a basket of manioc (cassava). She is also holding a maranthaceae leaf, which is commonly used for wrapping and cooking on a fire.
In the recent study, the researchers found that deforestation rates were highest around older, open roads. Specifically, the highest rates were found in the Democratic Republic of Congo due to agriculture and a high population density.
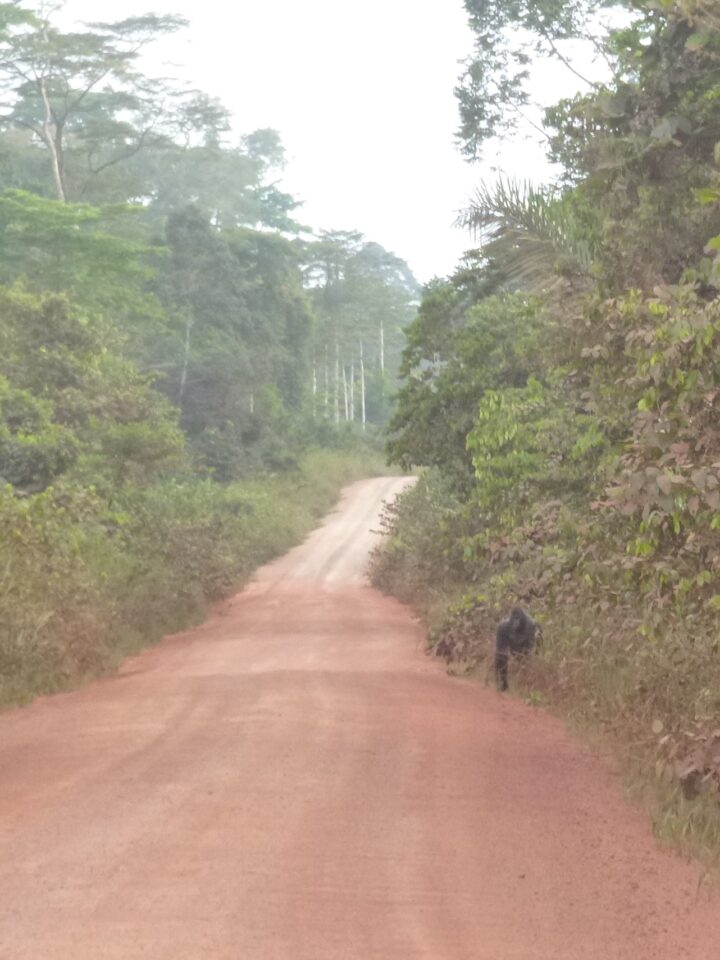
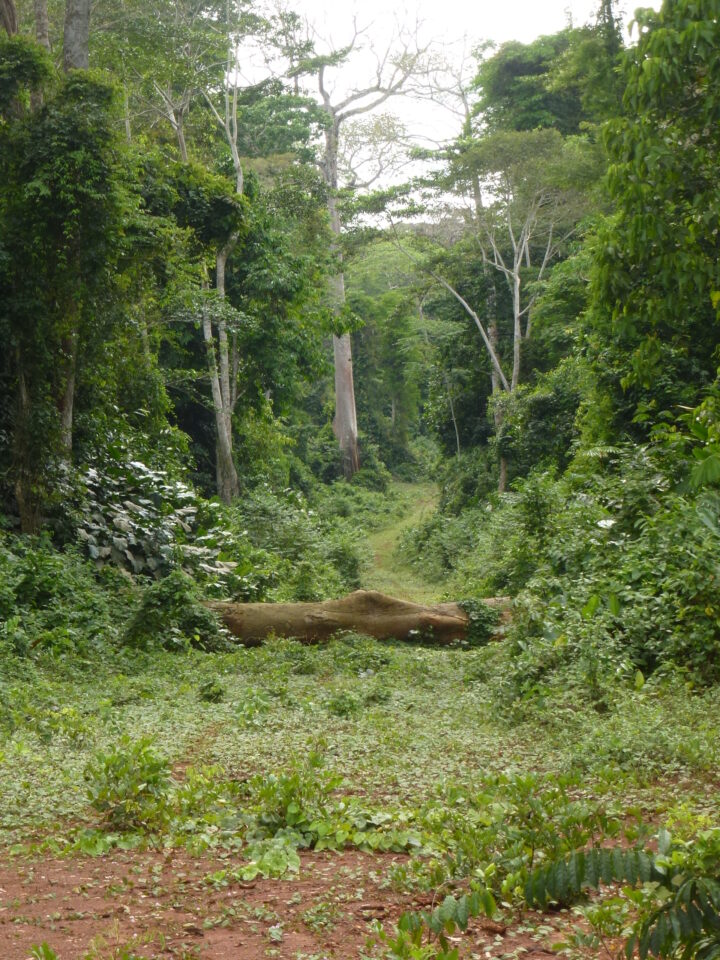
Researchers showed deforestation rates were the lowest around abandoned or closed roads. Abandoned roads reduce human traffic and allow vegetation to grow over the dirt path. The image below shows an abandoned road in the Republic of Congo that is overgrown with regenerating trees and plants. These plant species pictured are popular for gorillas to feed on and can help restore the gorillas’ natural habitat.
Abandoned roads were most commonly found inside logging concession areas. After a logging company was no longer using the road, the road was often closed or abandoned. Sometimes the road can be closed off by simply using a log to prevent vehicles from entering, as shown below.
To read the accompanying article, click here: When a Road Leads to Deforestation
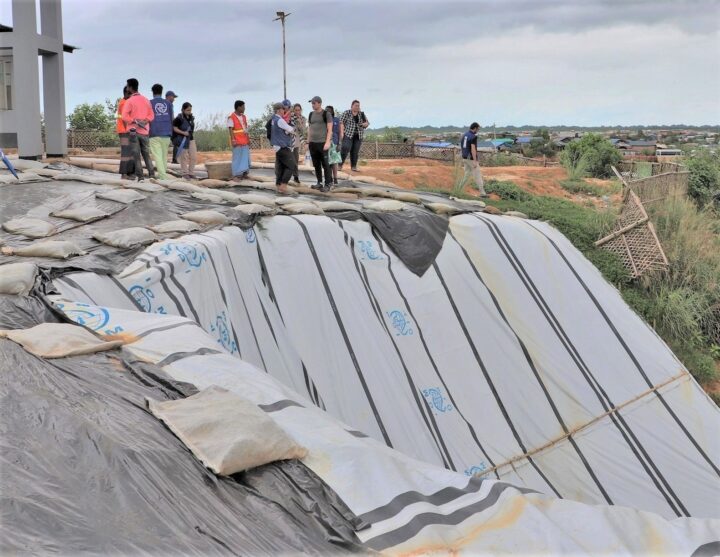
Camp managers and other officials overseeing Rohingya refugee camps in Bangladesh are now incorporating NASA satellite observations into their decision-making. Information like daily rain totals can help inform how to lay out refugee camps and how to store supplies. The goal is to reduce the risk to refugees from landslides and other natural hazards.
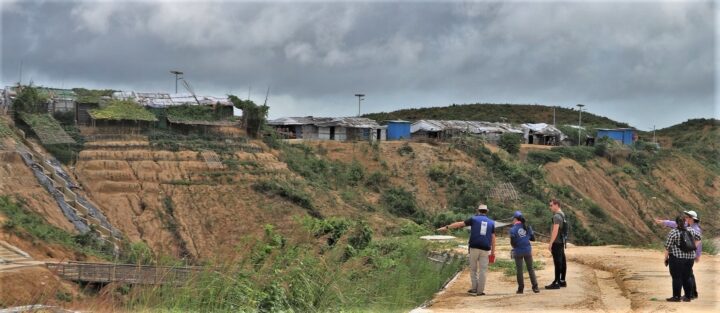
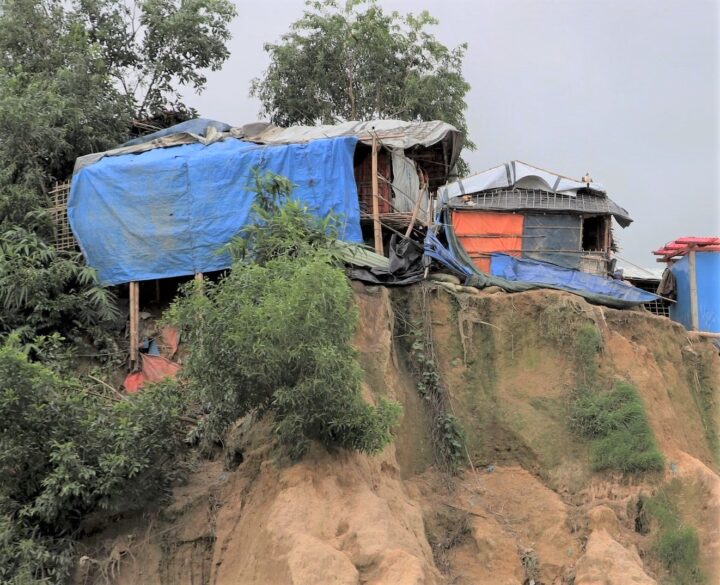
Since August 2017, more than 740,000 Rohingya refugees have fled from Myanmar (Burma) to Bangladesh. Many of them have sought shelter in camps in the hilly countryside, where landslide risks are greatest. When refugee camps were built in the southeastern part of the country, many plants and trees were removed — taking with them the roots that could hold the soil in place and help stabilize the landscape when heavy rains come.
Increasing this danger is Bangladesh’s intense monsoon season. Approximately 80 percent of the country’s yearly rain falls from June to October, bringing with it an increased risk of flash flooding and landslides. For instance, July 2019 storms dropped 14 inches of rain in just 72 hours, causing 26 landslides in Rohingya refugee camps around Cox’s Bazar, Bangladesh. One person was killed and more than 4,500 others were left without shelter.
“We have little information on landslides,” said Hafizol Islam, who is in charge of one of the most densely populated camps at Cox’s Bazar. “It is unpredictable for us and can happen at any time.”
Now Islam and other camp managers have access to maps and a website (updated daily) that provides near real-time NASA data on land use, rainfall, and elevation. Data come from the Global Precipitation Measurement (GPM) mission and the Moderate Resolution Imaging Spectroradiometer (MODIS) instruments on NASA’s Terra and Aqua satellites, among other sources. Taken together, these maps and data provide a clearer picture of when and where landslide hazards are concentrated.
“With landslides, flash floods, and rapid development, the terrain of these camps is constantly changing,” said Robert Emberson, a postdoctoral fellow at NASA’s Goddard Space Flight Center.
Emberson and other researchers from NASA’s Earth Applied Sciences Disasters Program and Columbia University’s International Research Institute for Climate and Society (IRI) are using new approaches to work alongside humanitarian end-users and develop products to address pressing needs in vulnerable settings. The partnership seeks the feedback of the local people affected and develops maps based on their input.
“We need to understand if, why, and when existing risk information is being used,” said Andrew Kruczkiewicz of IRI, one of the principal investigators of the project. “This strengthens the development of data services for humanitarian emergencies, where decisions and priorities change rapidly. Working in teams that bridge traditional professional and disciplinary boundaries gives data and climate scientists the opportunity to learn more about decision-making in specialized contexts.”
The need for coordination is pressing. Bangladesh has seen steadily increasing rainfall totals over the past 50 years. Climate change is making monsoons in Asia more extreme, and it may be doubling the likelihood of extreme rainfall events even before monsoon season begins.
“The partnership with NASA and IRI helps the UN agencies to assess risks like landslides or flash flooding and supports the disaster management in a scientific way to save lives and reduce damages in the refugee camps,” said Cathrine Haarsaker, a project manager for UNDP Disaster Risk Management.
Emberson said seeing the camps in person brought home the importance of connecting with the people on the ground. “Working with satellite data can sometimes feel quite abstract and separate from the people within the images,” he said. “Visiting the camps not only helped us understand more about the specific problems associated with landsliding to help improve our models in the future, but also drove home the human side to this disaster, emphasizing the urgency of our work.”
NASA has funded five new projects to develop tools and technology to make the agency’s massive Earth science datasets more accessible and user-friendly.
Wake up. Turn on laptop. Start processing airborne data of the Adirondack forests in New York. Make Coffee. Eat Breakfast. Fasten the open laptop’s seatbelt in the passenger seat as it continues to crunch numbers. Drive to work.
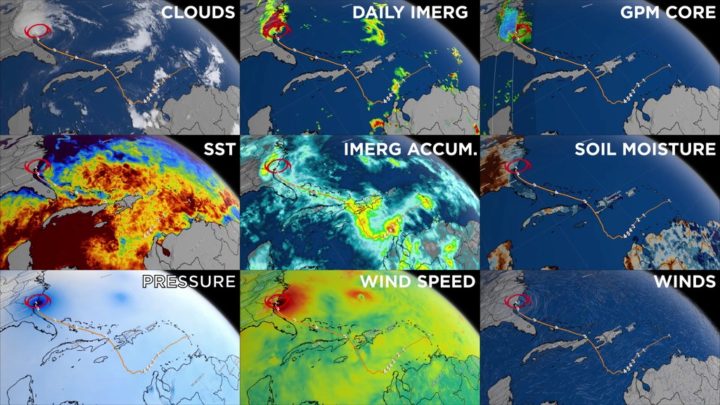
NASA Earth science datasets provide different perspectives and information on our planet, as seen here in this data visualization of observations of Hurricane Matthew in October 2016. Credits: NASA’s Scientific Visualization Studio
That used to be Sara Lubkin’s morning routine as an early career scientist at NASA’s Goddard Space Flight Center in Greenbelt, Maryland. Once at work, she would use her desktop computer, while her laptop diligently spent the next 12 hours processing airborne instrument data for the relevant information she needed to study invasive pests of hemlock trees.
“I’m not a computer scientist, I’m an Earth scientist,” said Lubkin, who now works as a program officer for NASA Earth Science Data Systems’ Advancing Collaborative Connections for Earth Systems Science, or ACCESS program. But her experience as a researcher is not unique.
Spending large chunks of time simply getting Earth science data into a usable form for analysis is a common situation for researchers working with the big datasets that come from NASA field, airborne and satellite missions. Downloading huge files, converting data formats, locating the same study areas in multiple datasets, writing code to distinguish different land types in a satellite image – these types of tasks eat into time scientists would rather be using to analyze the actual information in the data.
That’s where the ACCESS program comes in. Part of the Earth Science Data Systems division since 2005, ACCESS finds innovative ways to streamline that cumbersome processing time. The program funds two-year research projects to improve behind-the-scenes data management and provide ready-to-use datasets and services to scientists, Lubkin said.
Sara Lubkin worked with NASA’s big data sets studying invasive pests in Adirondack hemlock trees as part of NASA’s Applied Sciences DEVELOP program, which addresses environmental and public policy issues through interdisciplinary research projects that apply the lens of NASA Earth observations to community concerns around the globe. Credit: Sara Lubkin
In June, NASA selected five teams of NASA, university and commercial computer science researchers from the 2017 round of submissions in a range of projects that will use machine learning, cloud computing and advanced search capabilities to develop tools to improve the behind-the-scenes management for selected NASA datasets.
“We continually invest in development and evaluation of the newest technologies to improve science data systems,” said Kevin Murphy, program executive for NASA’s Earth Science Data Systems at NASA Headquarters in Washington. But more than that, they want to make sure that the tools and technology help real scientists address real problems.
Each ACCESS project has Earth scientists and computer scientists involved from beginning to end, Murphy said. “With the ACCESS program, we’re really trying to understand, for example, how ocean currents work, but we’re trying to do that now with data that’s so large that we need a team of experts who can work together to solve the big science and big data questions.”
The projects will complement data management, distribution and other services provided by the Earth Observing System Data and Information System (EOSDIS), which manages and stores NASA data collected from Earth-observing satellites, aircraft and field campaigns. EOSDIS has 12 interconnected data and archive centers located across the United States, which are organized by discipline. Currently, these centers host 26 petabytes of Earth datasets – that’s 26 million gigabytes, or enough data to need 52,000 computers each with 500 gigabytes of storage space. That number is expected to grow to 150 petabytes within five years with the launch of new satellites.
“Satellite data is big data,” said Jeff Walter, one of the ACCESS 2017 principal investigators and lead engineer for Science Data Services at the Atmospheric Science Data Center at NASA’s Langley Research Center in Hampton, Virginia. “It’s very complex and sometimes difficult to use, even for expert users. In addition to the volume, which makes it difficult for users to acquire, store and manage, there’s also the complexity of both the format and content. Users often have to spend a lot of time understanding how the data is organized and what the various parameters represent.”
Walter’s project is one of three that will use cloud computing to alleviate download and storage issues for users. Starting with two atmospheric datasets, his team will also be developing a way to convert satellite data formats into those that can be read by commercial geospatial information system (GIS) software.
“Our project aims to lower the barrier to entry for a potential new user community who might find novel ways to use this data, and who are more familiar with GIS types of tools,” Walter said.
The two other cloud computing projects will be developing open source processing and analysis tools, including one designed for ocean datasets. A fourth project will use machine learning to detect changes over time in land observations, starting with the detection of landslides, floods and uplift caused by volcanic activity. The fifth project will develop an automated method for lining up datasets that observe the same location so researchers can combine more than one type of information about a place.
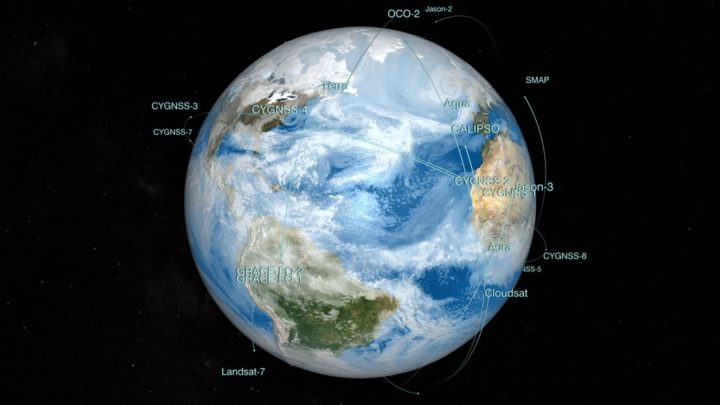
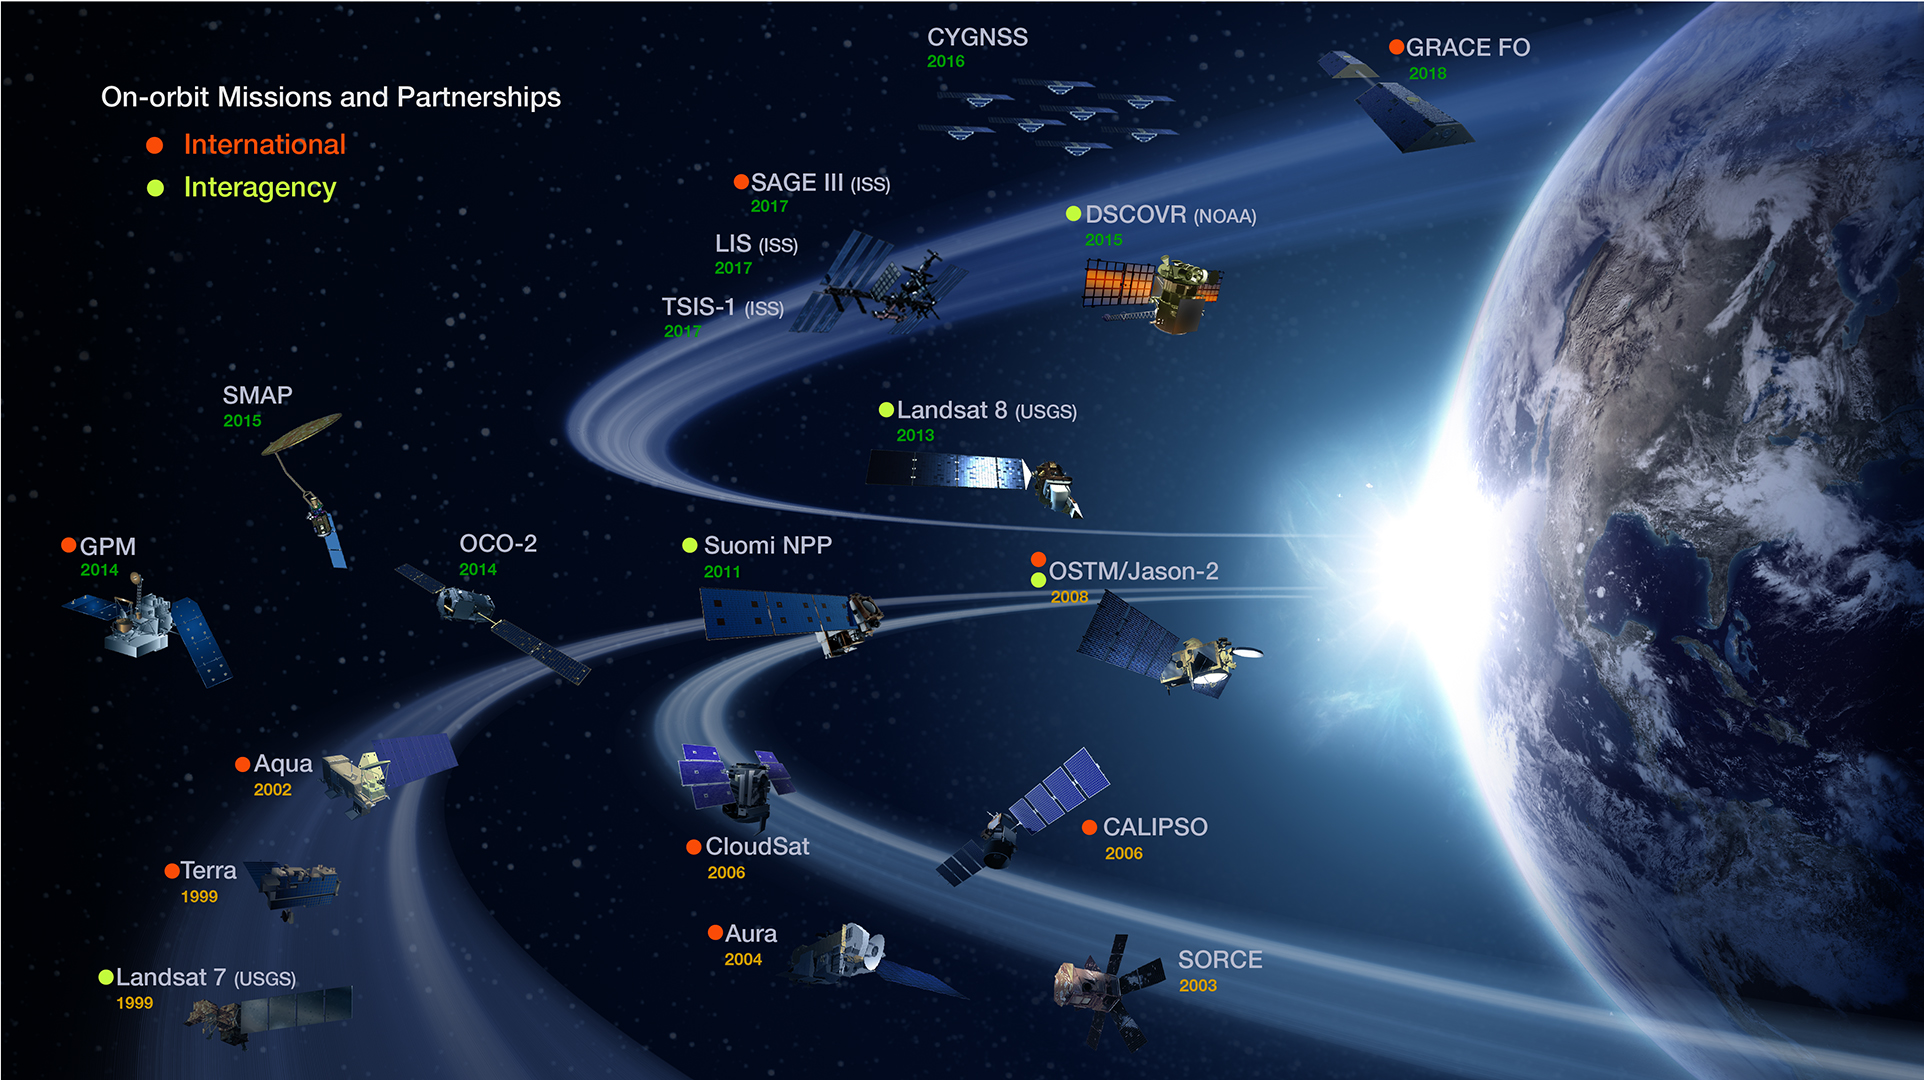
NASA has 26 Earth-observing satellites monitoring the vital signs of our home planet. Along with airborne and ground Earth science missions, their data is stored and managed by the Earth Observing System Data and Information System. Credit: NASA
Upon completion, the ACCESS researchers will work closely with EOSDIS teams to incorporate their advancements into the data centers’ day-to-day operations. Once those new tools are in place, that’s when the real power of open and freely available Earth science datasets can flourish, according to Murphy. Easy-to-use data means it gets into the hands of decision-makers, non-governmental organizations, scientists studying related applications and researchers in different fields that may have new uses for it.
“When you make these products open and accessible, you have a lot of unintended, good scientific consequences,” Murphy said, citing examples that include detecting groundwater movement from space, rapid wildfire detection and using night lights to study human energy use. “NASA has a lot of very valuable information, and the ACCESS program really tries to help scientists to not only address primary science questions but also help us understand our environment and plan for our future.”
To learn more about ACCESS, visit https://earthdata.nasa.gov/community/community-data-system-programs/access-projects
To learn more about NASA’s Earth Science Data Systems, visit https://earthdata.nasa.gov/
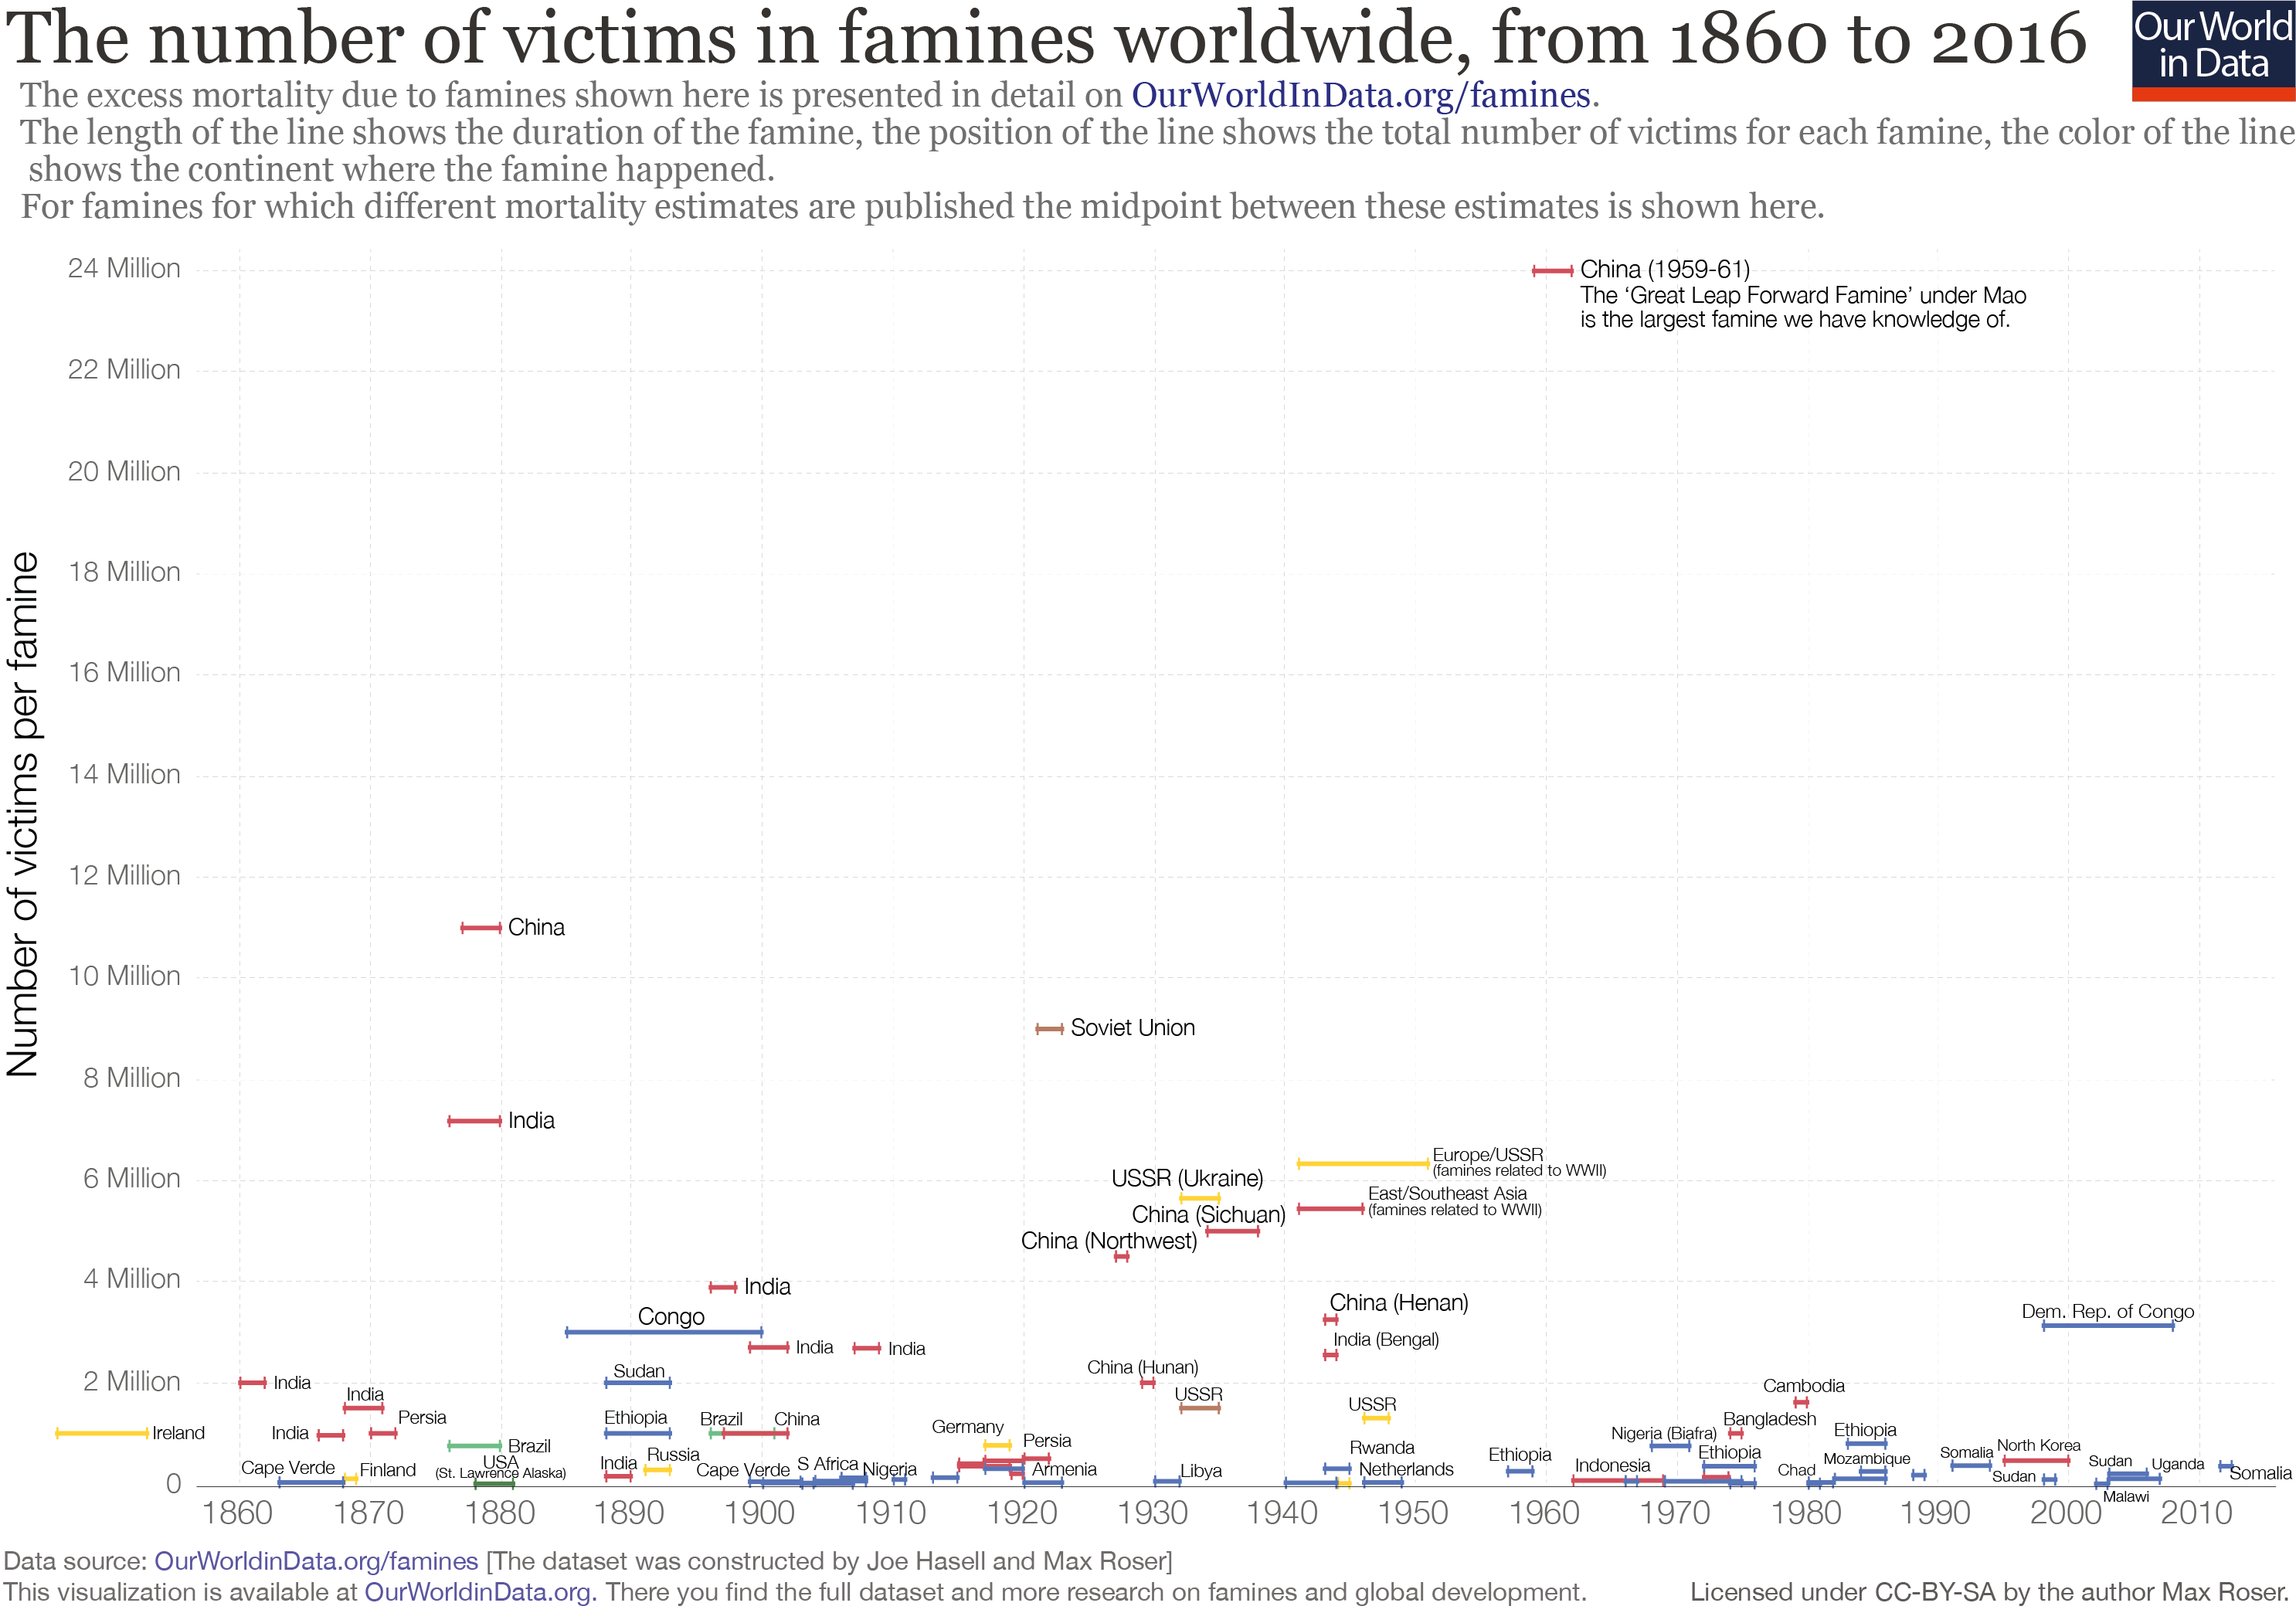
If you take the long view, our world is much better fed than it used to be. In the 1970s, about one-third of people in developing countries were undernourished; today the number is 13 percent. Even as global population has increased, it has been a long time since the horrific famines that claimed 5 million lives or more in the Soviet Union, China, Europe, and India during the 20th Century.
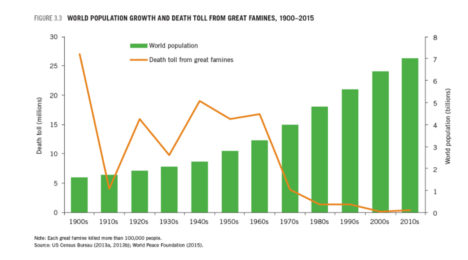
Chart courtesy of IFPRI.
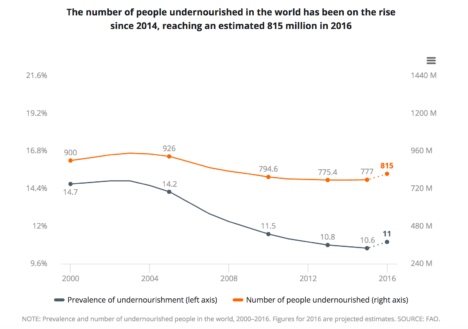
However, serious food shortages remain a fact of life. Roughly 815 million people were undernourished in 2016, according to the UN Food and Agricultural Organization. That is an increase of 38 million people from 2015, making 2016 the first year in more than a decade that the world grew hungrier. The grim trend was driven largely by armed conflicts in South Sudan, Yemen, Nigeria, and Syria.
Meanwhile, other problems loom. Climate change is already starting to exacerbate famines, as temperature and precipitation patterns shift. Many experts worry that food production systems may struggle to adapt in coming decades. Even if problems caused by climate change turn out to be modest, global populations are expected to increase to 10 billion people by 2050, and the demand for food will likely go up by 50 percent or more as people in the developing world increase their income and consume foods that require more resources to produce.
Solving global problems sometimes requires a global view, so NASA’s Applied Sciences Program is working to make sure the world’s food systems are ready for the future. Researchers and program managers have created an agency-wide initiative to put remote sensing data and knowledge into the hands of people who can advance agriculture and reduce world hunger.
Earth Matters sat down with Sean McCartney, coordinator of NASA’s new Food Security Office, to learn more.
Earth Matters: How did NASA get involved with food security?
McCartney: People sometimes forget that NASA’s charter states that one of the agency’s key objectives is “the expansion of human knowledge of the Earth and of phenomena in the atmosphere and space.” There are currently around 20 Earth-observing satellites that collect data on the hydrosphere, biosphere, and atmosphere. NASA has been able to leverage this data through scientific analysis and modeling to better understand food systems on a global scale.
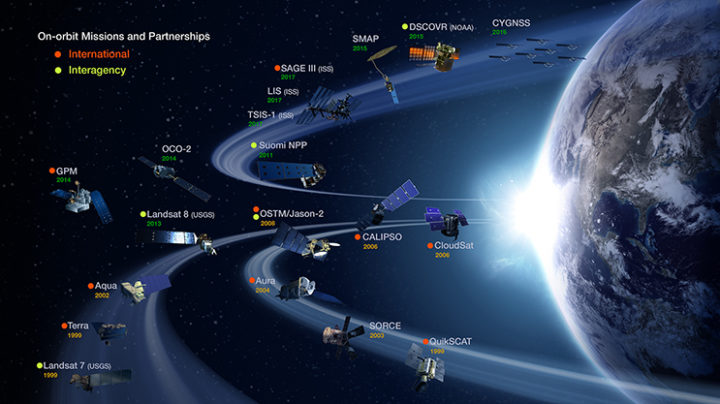
Chart courtesy of NASA’s Earth Observing System Project Science Office.
The food security initiative is part of our Applied Sciences Program, which does outreach with end users and showcases Earth observations. Through this program, NASA began to work with the United Nations on Sustainable Development Goals (SGDs), a global effort to end poverty, protect the planet, and ensure prosperity for all. Some of the goals relate to water and food security, and NASA leadership believed that that was an area where Earth observations could really contribute. Getting involved with the SGDs dovetailed with the establishment of the Food Security Office.
How do satellites and Earth-observing data relate to the food situation on the ground?
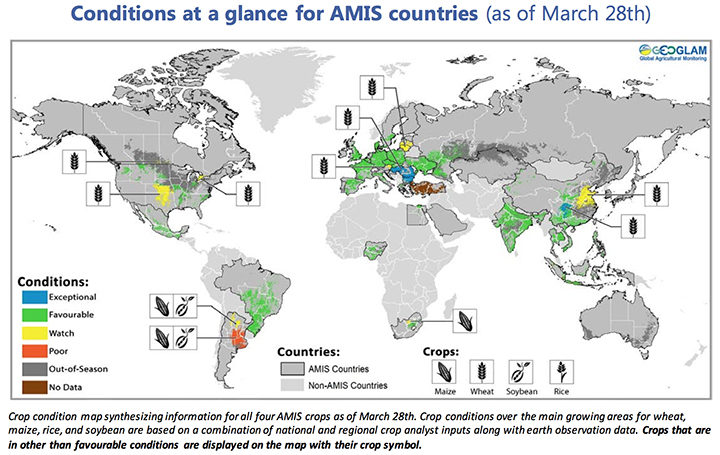
We already do a lot with satellites to monitor major commodity crops like rice, maize, wheat, and soy. We can use satellites to help track key crop characteristics, such as the “greenness” of vegetation (NDVI), crop type, the acreage and distribution of crops, precipitation, soil moisture, evapotranspiration, and more. This sort of environmental data is incorporated into important crop assessment reports, such as the GEOGLAM Crop Monitor, a monthly bulletin on conditions for major crops around the world.
Likewise, the U.S. Agency for International Development (USAID) uses satellite data as part of its Famine Early Warning Systems Network (FEWS NET), which produces frequent reports on food conditions in 34 of the most famine-prone countries in the world.
What we’re trying to do is optimize programs and tools like these — and develop others — and get them into the right hands at the right time. NASA assets help inform governments, NGOs, the private sector, and other stakeholders to anticipate and react to food shortages.
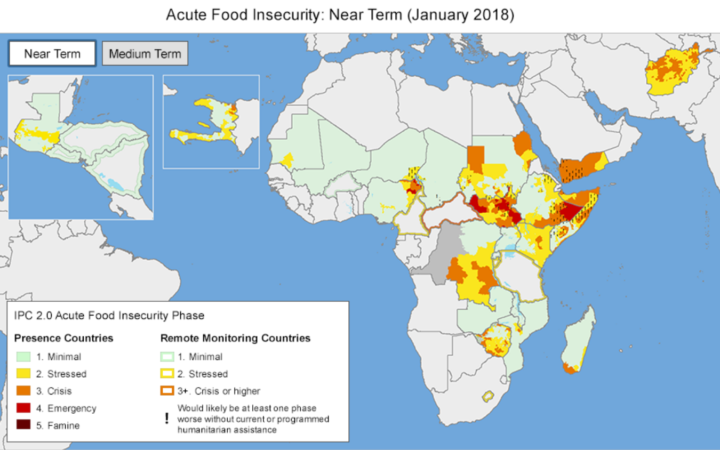
Map courtesy of FEWS NET.
What are the main priorities of the new office?
A lot of the efforts so far have been through a partnership with the Earth Observations for Food Security and Agriculture Consortium (EOFSAC), a program led by the University of Maryland. The consortium is a really multidisciplinary group, which is what makes it so exciting. It has roughly 40 partner organizations from government, NGOs, international organizations, universities, and the private sector all working together. You can see a full list of the partners here.
What is on the consortium’s agenda?
Partnering with both the private and public sector—for instance, USDA and USAID—is one focus. They are going to be looking at innovative ways where Earth observations can provide value to end users. That might involve working with the reinsurance industry to provide them with a broad view of crops or working with USDA’s National Agricultural Statistics Service to develop ways of incorporating more satellite data into their workflow.
In February 2018, the consortium sponsored a workshop at the National Agricultural Library focusing on emerging technologies in Earth observations. Presenters highlighted several new sensors and data sets that are now being applied to agriculture — such as soil moisture, solar induced fluorescence, and satellite-derived precipitation. For a full account of the meeting, you can read the minutes here.

Photo courtesy of EOFSAC.
How would you say the world is doing in regards to food security?
It really depends on the country. If you look at overall food production, even in countries that are in need, they might be producing adequate food, but they don’t have access to markets, so they can’t get that food to people before it spoils.
Is it possible to follow some of these organizations and projects on social media?
Yes, check out @EOFSAC, @GEOCropMonitor, @FEWSNET, @G20_GEOGLAM, and @AgMIPnews.
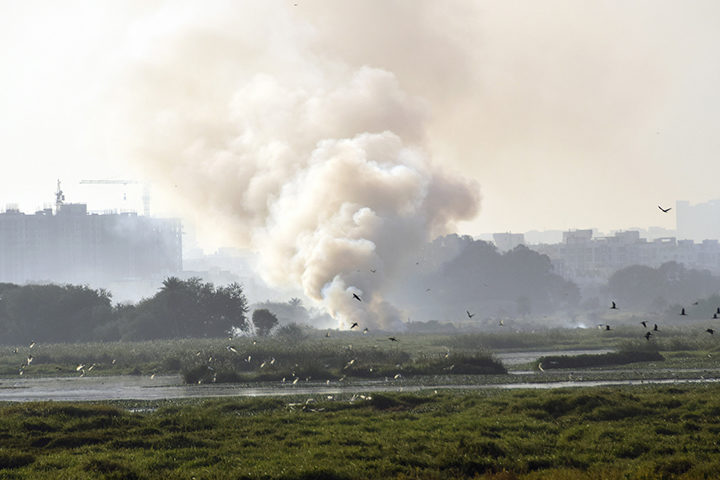
Fire on Bellandur Lake on January 19, 2018. Photo by pee vee.
In Bengaluru, India, one of the city’s lakes is so polluted with sewage, trash, and industrial chemicals that it has an alarming habit of catching on fire. As recently as January 19, 2018, fire broke out on Bellandur Lake and burned for seven hours.
The same lake is notorious for churning up large amounts of white foam that has, at times, spilled from the lake and enveloped nearby streets, cars, and bridges. The water is so polluted that it can’t be used for drinking or bathing or even irrigation.
Bellandur Lake is not the only lake in Bengaluru with water quality problems. During a recent check, not one of the hundreds of lakes that the city tested was clean enough to be used for drinking or bathing.
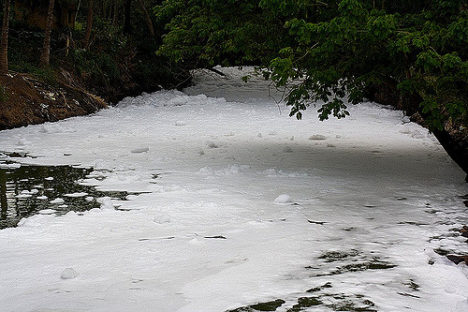
Foamy water flowing into Bellandur Lake. Photo by Kannon B.
I point this out on World Water Day to underscore that Bengaluru’s water woes, though extreme, are not particularly uncommon. According to the United Nations, a quarter of all people on the planet lack access to safely managed drinking water, and 40 percent of people live in areas where water scarcity is a problem. Roughly 80 percent of wastewater flows back into ecosystems untreated. Even in the United States, tens of millions of people may be exposed to unsafe drinking water, according to one recently published study.
Even in the course of reporting for this website from a satellite perspective, we see signs of trouble. Capetown was on the verge of running out of water in February 2018. Drought pushed São Paulo’s reservoirs to near empty in recent years. The GRACE satellites have observed rapid depletion of groundwater in several critical aquifers. On more than one occasion, we have reported on rainbow-colored escaped mine tailings contaminating waterways.
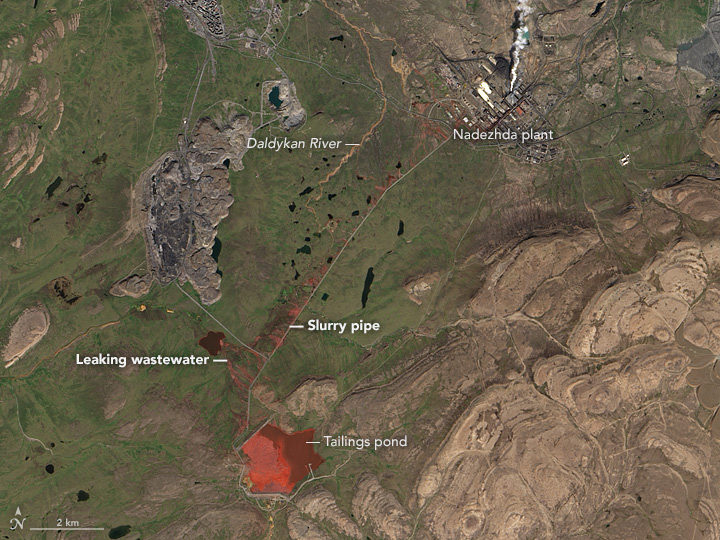
NASA Earth Observatory image by Jesse Allen, using Landsat data from the U.S. Geological Survey. Learn more about the image here.
To push back against such problems, NASA’s Earth Science Division, and particularly its applied sciences program, is doing what it can to marshal the agency’s resources to make countries aware of what NASA resources are available to monitor and reduce the impact of water-related problems.
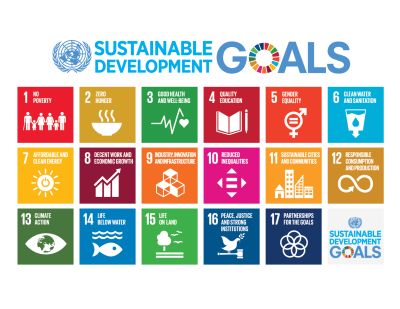
Learn more about the Sustainable Development Goals. Image by the United Nations.
As one piece of its water program, NASA scientists and staff are working with the United Nations to highlight key NASA datasets, tools, and satellite-based monitoring capabilities that may help countries meet the 17 sustainable development goals established by the international body. Goal number 6—that countries ensure the availability and sustainable management of water and sanitation for all—has been a particular focus of the NASA teams.
NASA and NOAA satellites collect several types of data that may be useful for water management. Sensors such as the Moderate Resolution Imaging Spectroradiometer (MODIS) and the Visible Infrared Imaging Radiometer Suite (VIIRS) collect daily data and images of water bodies around the planet that can be used to track the number and extent of lakes and reservoirs.
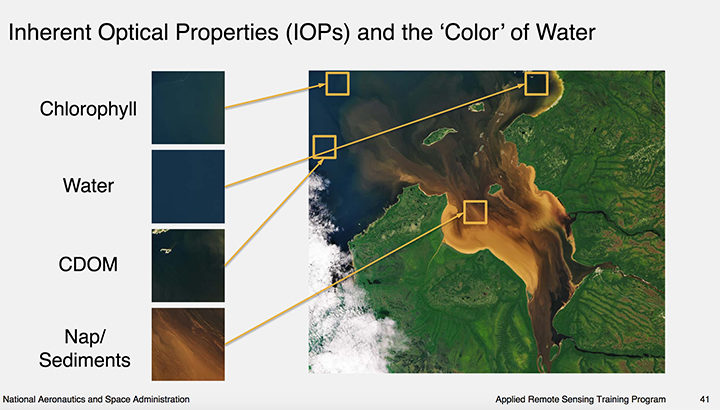
Image courtesy of this NASA ARSET presentation. Learn more about the image here.
The same sensors collect information about water color, which scientists use to detect sediment, chlorophyll-a (a product of phytoplankton and algae blooms), colored dissolved organic matter (CDOM), and other indicators of water quality.
The strength of MODIS and VIIRS is that these sensors collect daily imagery; the downside is that the data is relatively coarse. However, another family of satellites, Landsat, carries sensors that provide more than 10 times as much detail.
The combination of information from multiple satellites collected over time can be powerful. For instance, as we reported previously, a team of scientists based in China used decades of Landsat data to track a 30 percent decrease in the total surface area of lakes in Inner Mongolia between the 1980s and 2010. The scientists attributed the losses to warming temperatures, decreased precipitation, and increased mining and agricultural activity.
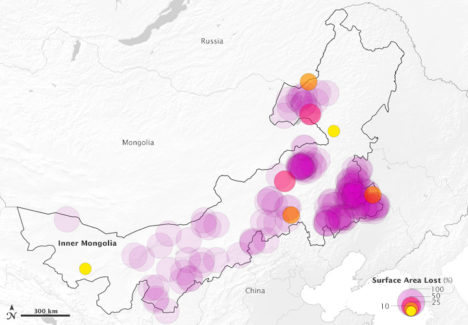
This map above depicts 375 lakes within Inner Mongolia that experienced a loss in water surface area between 1987-2010. The large, purple circles indicate a complete loss of water. Learn more about the map here.
Meanwhile, one of NASA’s scientists, Nima Pahlevan, is in the process of building an early warning system based on Landsat and Sentinel-2 data that will be used to alert water managers in near-real time when satellites detect high levels of chlorophyll-a, an indicator that harmful algal blooms could be present. While some blooms are harmless, outbreaks of certain types of organisms lead to fish kills and dangerous contamination of seafood. His team is working on a prototype system for Lake Mead in Nevada (see below), Indian River Lagoon in Florida, and certain reservoirs in Oregon. Eventually, he hopes to have a tool available that can be used globally.
“The idea is that we can get the information to water managers quickly about where satellites are seeing suspicious blooms, and then folks on the ground will know where to test water to determine if there’s a harmful algae bloom,” said Pahvalen. “We’re not suggesting that satellites can replace on-the-ground sampling, but they can be a great complement and make that work much work more efficient and less costly.”
To learn more about how satellites can be used to aid in the monitoring of water quality, see this workshop report and harmful algal bloom training module from NASA’s ARSET program.
