The Earth Observatory has published its last Image of the Day on this website. Please join us on our new home at science.nasa.gov/earth/earth-observatory.
July 14, 2020
In 400 BC, the renowned Greek physician Hippocrates offered the earliest known account of a seasonal respiratory disease. The “Cough of Perinthus” was a winter affliction that hit a port city in Greece. Symptoms included fevers, chills, labored breathing, pneumonia, and sometimes death.
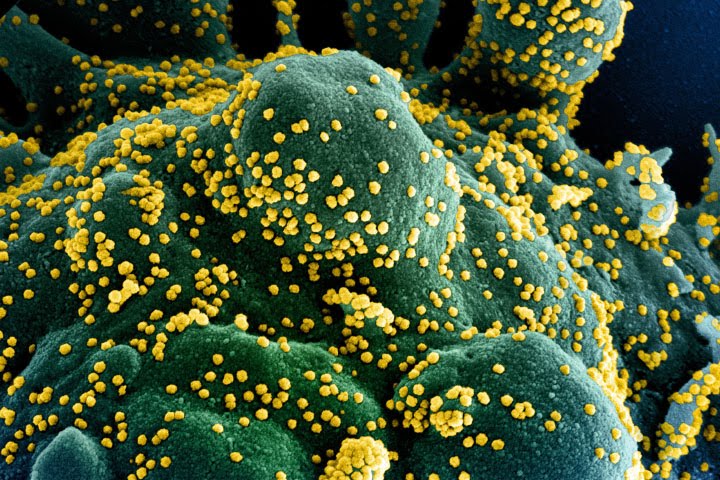
When the novel coronavirus (SARS-CoV-2) infects a human cell, it hijacks cellular machinery to produce millions of new copies of itself. (Photograph courtesy of NIAID.)
Modern scientific tools have allowed us to observe and explain disease in ways that may have astounded Hippocrates. But explaining why some disease outbreaks have seasonal cycles, and predicting the timing of those cycles, remains a challenging problem. In 2020, solving that problem became even more pressing, as the novel coronavirus (SARS-CoV-2) and the disease it causes (COVID-19) spread rapidly around the world.
NASA has joined other U.S. and international agencies in hunting for answers. Scientists are investigating potential relationships between the spread of the novel coronavirus and seasonal shifts in humidity, temperature, rainfall, and other environmental variables. They hope their work will clarify the role that weather and climate might play in influencing the spread of the virus.
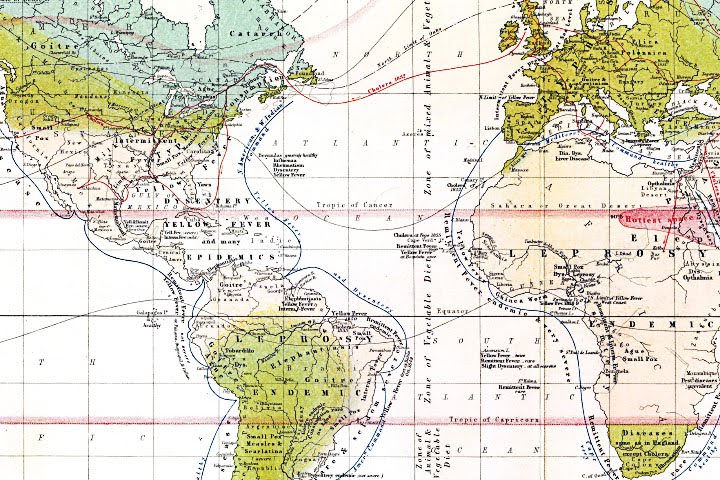
The idea that viral infections follow seasonal rhythms and geographic patterns is not new. This 1856 map by a Scottish cartographer shows prominent viruses and diseases (such as smallpox, goiter, and yellow fever) in relation to temperature and latitude. (Map by Alexander Keith-Johnston courtesy of the David Rumsey Map Collection.)
Research has shown that some respiratory viruses have clear seasonal rhythms. For instance, cases of influenza and several types of coronaviruses are known to surge in the winter. Outbreaks of enteroviruses usually happen in the summer. And some adenoviruses and rhinoviruses have no obvious seasonal cycle.
The question confronting infectious disease experts and policymakers is: how will SARS-CoV-2 behave?
The most closely related viruses—four other types of spherical, spiked betacoronaviruses—offer a few clues. Middle East Respiratory Syndrome (MERS) and Severe Acute Respiratory Syndrome (SARS) have never spread widely or fast enough to show seasonality. But two endemic betacoronaviruses (OC43 and HKU1) that cause the common cold spread more in the winter. (Endemic viruses are always present; epidemic viruses spread rapidly in a region; pandemics spread globally.)
If the COVID-19 coronavirus favors winter like its cousins, cases of the disease would fade during the summer but then surge back in autumn or winter. There is worrisome precedent for this possibility. During the 1918 influenza pandemic, the first wave of illness came in the spring but was relatively modest. It was the second wave that arrived in fall 1918 that was catastrophic and caused tens of millions of deaths around the world.
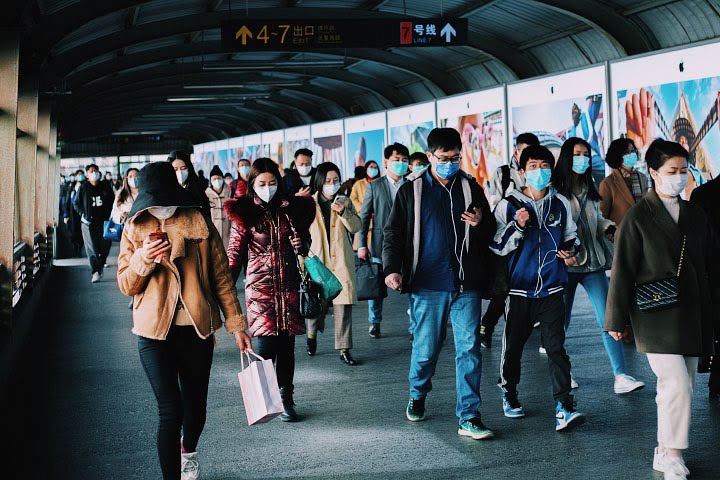
Scientists hope to understand how much environmental conditions influence the spread of COVID-19 compared to other factors like mask-wearing or quarantines. (Image courtesy of Zydeaosika.)
The science surrounding the potential seasonality of SARS-CoV-2 is far too new to say anything with certainty. “There is a real rush to get studies out now,” said Benjamin Zaitchik, a Johns Hopkins University researcher working on a NASA Applied Sciences project to investigate whether environmental factors are affecting the spread of the new coronavirus. “Everybody is trying to help, and many people feel like getting something out faster is how you help right now. But the public should understand that, even a few months into this, there is still nothing definitive regarding the seasonality of the virus.”
One way that Zaitchik and other researchers hope to get some clarity is by making use of reanalysis datasets and models that synthesize disparate environmental data into a coherent whole. These systems generate consistent snapshots of Earth’s atmosphere and land and water surfaces over large areas and long time periods. This makes them especially useful for research on long-lasting global problems like climate change or the seasonality of an infectious disease.
In their hunt for a potential seasonal COVID-19 signal, Zaitchik and other scientists will lean on models and data from NASA, other major research organizations, and an international array of satellites, aircraft, and weather observation systems. NASA, NOAA, the Japan Aerospace Exploration Agency, the European Space Agency, and the European Centre for Medium-Range Weather Forecasts (ECMWF) are particularly well positioned to produce useful data for COVID-19 studies because they maintain observing and computing systems capable of tracking things on a global scale.
There are some similarities in the structures of seasonal viruses that suggest certain features are important. For instance, several seasonal viruses have lipid envelopes that protect viral RNA and may help the viruses evade the human immune system. Some research indicates that these lipid envelopes become disorganized in warm, humid conditions, making it more difficult for viruses to spread. Other research into human anatomy indicates that the structures in the nose and throat that defend against infections generally function better in warmer, more humid conditions.
Earth’s seasons bring pulses of green and white as regions of vegetation, snow, and ice expand and contract throughout the year. Seasonal changes have been shown to influence the spread of some diseases. (NASA Earth Observatory image by Joshua Stevens, using Blue Marble data.)
Some very preliminary laboratory studies in 2020 pointed to a potential link between cold, dry conditions and increased transmission of SARS-CoV-2, and several research groups started to look for similar patterns in real-world health and environmental data. One study noted that cities with the most severe outbreaks in late winter 2020 were mostly situated around the same latitude (30 to 50 degrees North) and had the same general temperature and humidity conditions.
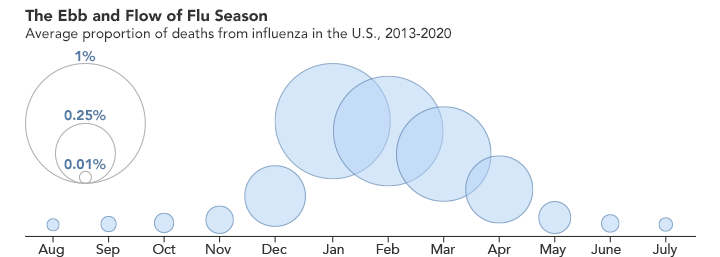
Each year in the United States, influenza follows a predictable pattern and reaches its peak during winter, when conditions are colder and drier. (NASA Earth Observatory image by Joshua Stevens, using data from the Centers for Disease Control and Prevention.)
For now, correlations like these should be regarded as hypotheses, not proof of a connection. Standards for the collection of health data vary so dramatically between countries that comparing outcomes this early in a pandemic can suggest relationships that do not stand up to time and scrutiny. Beyond that, relationships between environmental variables and viral transmission could prove to be complex; they could play out differently in tropical climates at low latitudes compared to temperate climates at middle latitudes. In the case of influenza, dry winter air seems to help the virus spread at mid- and high latitudes, but there is evidence that extremely humid conditions in the wet season in the tropics also benefit the virus.
Most of us focus on how temperatures change with the seasons, so it can be easy to forget just how much the seasons change the atmosphere. For instance, the amount of water vapor in the air drops significantly in the winter because the reduced sunlight limits evaporation from lakes and seas. When that dry outdoor air is pumped indoors and heated, it can get even drier; since warm air can hold more moisture than cold air, the relative humidity—a measure of how much moisture the air can hold—drops substantially.
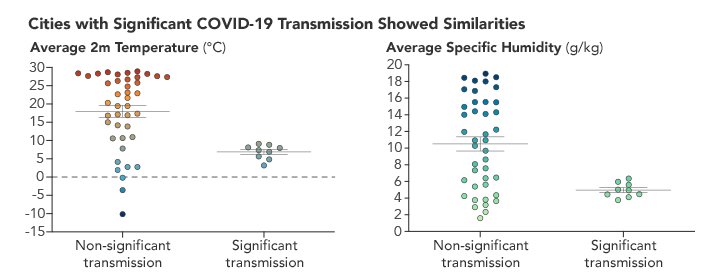
Preliminary research indicated that the cities with the most COVID-19 cases early in 2020 shared similar temperature and humidity conditions. A significant amount of disease transmissions clustered between 5°C and 10°C (between 40°F and 50°F) and at specific humidities of 5 g/kg. (NASA Earth Observatory chart by Joshua Stevens, using data courtesy of Sajadi et al.)
“For SARS-CoV-2, it is too early to say,” said Jeffrey Shaman, a Columbia University epidemiologist who has studied the seasonality of respiratory viruses for decades. “But if I were to put money on it, I would bet that there is seasonality to this virus and that, like with influenza and the endemic betacoronaviruses, it will track with environmental conditions such as temperature and especially absolute humidity.”
Given the hints that moisture may be important to the survival and transmission of seasonal respiratory viruses, Zaitchik and colleagues are examining a broad array of environmental variables. And that is why they think global atmospheric models and reanalysis datasets will be useful in advancing the study of COVID-19 seasonality.
Weather stations and other ground-based monitoring tools are scattered unevenly throughout the world, and the majority of them are clustered in a handful of wealthy countries. This means they tend to offer regional views, rather than a consistent, global view of water vapor, humidity, temperature, and other variables that change with the seasons.
Atmospheric reanalysis datasets get around this limitation by repeatedly blending model simulations of the state of the atmosphere with massive amounts of data from satellites, weather balloons, aircraft, ships, and weather stations. Reanalysis systems constantly adjust what they are simulating by adding new real-world measurements. It is like a forecast that keeps updating itself, while also keeping a retrospective view of what happened.
Both temperature and humidity follow daily and seasonal rhythms, which are observed and measured by NASA instruments and represented by models. (NASA Earth Observatory animation by Joshua Stevens, using GEOS-5 data from the Global Modeling and Assimilation Office at NASA GSFC.)
Data from two major atmospheric reanalysis models have already been used in studies of the relationship between weather, climate, and disease, and they could be critical to breakthroughs in SARS-CoV-2 seasonality. One dataset is the ERA-5 from the ECMWF and the other is the Modern Era Retrospective-Analysis for Research and Applications (MERRA-2) from NASA.
“There really is no more accurate and spatially consistent four-dimensional snapshot of the atmosphere than what you get from these reanalysis products,” said Rob Gelaro, a research meteorologist with NASA’s Global Modeling Assimilation Office, which runs MERRA-2. “Every six hours, MERRA-2 absorbs at least 5 million observations and generates a snapshot of the global atmosphere for a given moment.”
MERRA-2 is officially a NASA reanalysis product, drawing data from several NASA and NOAA satellites such as Terra, Aqua, and the Tropical Rainfall Measuring Mission. But really it is a blend of the world’s best weather data from dozens of satellites and weather monitoring systems. Since it would be quite expensive and logistically impossible for one country to launch all of the satellites and manage all of the observing systems needed to achieve global coverage, countries divide the costs and management challenges and then share the data. ERA-5 works in the same way.
The richness, breadth, and depth of reanalysis data is what makes it so useful. “We are using these models to look closely at temperature and humidity data, but we are not stopping with that,” said Zaitchik. “We will also be looking at several other parameters—rainfall, soil moisture, evapotranspiration, winds, surface pressure, evaporative fraction, and UV exposure—that might help us detect a signal or understand something about disease transmission.” With the help of a reanalysis tool called the North American Land Data Assimilation System, Zaitchik and his team should also be able to connect epidemiology and weather down to the county level for North America and Europe because environmental and public health data are more detailed and consistent in these developed countries.
Even with access to powerful datasets and models, scientists say it will take time to disentangle the role of seasonal change from the other factors influencing SARS-CoV-2, such as travel and economic restrictions or wearing masks.
“Seasonal variability may prove to be only a minor factor, slowing but not stopping the virus in summer, until more immunity builds up in the population,” said Harvard University epidemiologist Marc Lipsitch. “New viruses have a temporary but important advantage—few or no individuals in the population are immune to them.”
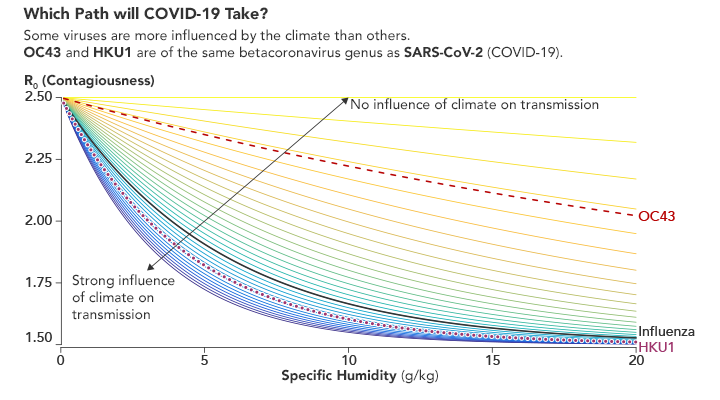
Environmental conditions have more impact on some viruses than others. Humidity levels change the contagiousness of influenza, as well as two betacoronaviruses that cause the common cold. It remains to be seen how SARS-CoV-2 behaves. (Chart adapted from Baker et al.)
A Princeton University team underscored this point in a study published in May 2020. They used 2014-2020 absolute humidity data from ERA-5 and MERRA-2 to develop scenarios for how SARS-CoV-2 might spread if seasonal effects prove to be similar to those for influenza and common cold betacoronaviruses. Their conclusion was that during the pandemic stage of an emerging virus, seasonality could only drive “modest” changes to a pandemic’s size.
Rachel Baker, the lead Princeton researcher on that study, explained that the SARS-CoV-2 pandemic could eventually settle into a pattern of seasonal outbreaks. “But it will probably take some time to actually see that in the data,” she said. “Ideally, you would have enough data to be able to look at viral activity in the same city over multiple seasons—probably at least three years—before we would be able to say with confidence that there is a seasonal signal and be able to describe it.”
So while scientists like Baker, Shaman, and Zaitchik are hustling to find clues, definitive answers about the seasonality of SARS-CoV-2 will not be forthcoming for several seasons.
“As you take in this constant drumbeat of new information and research, remember that this virus is new to science and people have only just started studying it,” Zaitchik said. “Doing high-quality, definitive science takes time, sometimes a long time. The appetite for answers is understandably intense, but we also have to try to balance that hunger with patience.”
