In October 2020, Mexico’s Yucatan Peninsula was doused by three storms: Gamma, Delta, and Eta. The storms came just months after tropical storm Cristobal delivered more than 50 centimeters (20 inches) of rainfall to the region in June. The accumulated rainfall and powerful winds significantly damaged mangrove forests in the region.
Scientists from NASA, Wageningen University, and Federal University of Viçosa have been assessing the damage in Central America using satellite data. A team based in the state of Yucatan also caught the action closer to the ground, using drones to capture mangrove changes before and after the 2020 hurricane season.
All photos are provided by Jorge Herrera from the Center for Research and Advanced Studies of the National Polytechnic Institute (CINVESTAV) and his team.
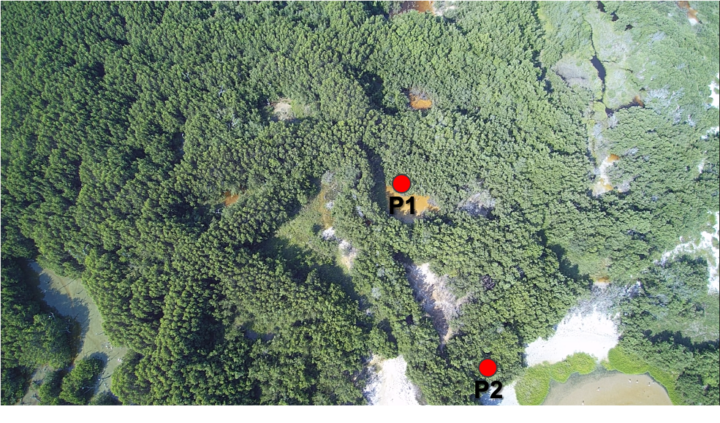
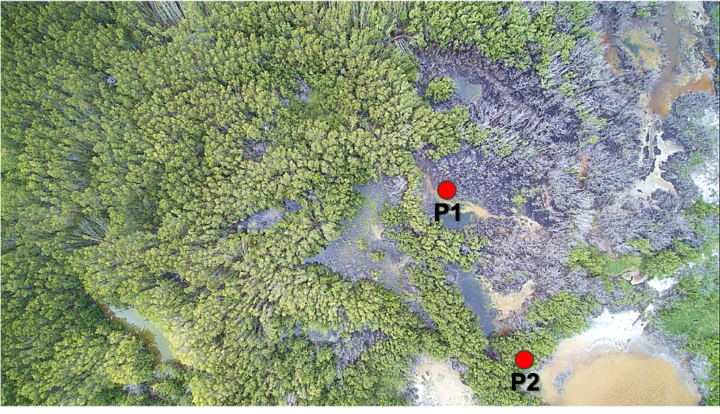
The October storms brought powerful winds that uprooted and defoliated mangrove forests near the coastal city of Dzilam el Bravo, located on the northern tip of the Yucatan Peninsula. The images below show changes from 2019 (top) to October 2020 (bottom), after Delta recently passed through the region.
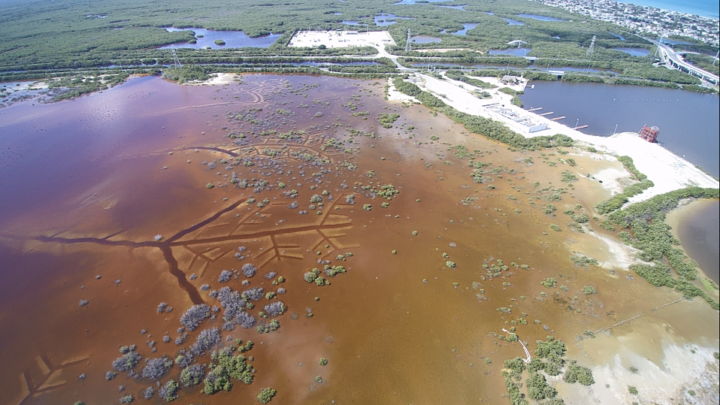
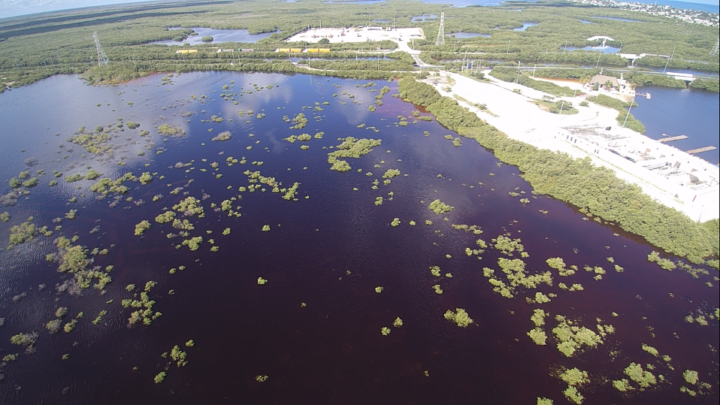
The storms also brought major flooding to other Yucatan regions. Extreme precipitation can affect oxygen concentrations in soils and hinder photosynthesis for mangroves. Large storm surges can also cause physical damage and uproot trees. The images below show a mangrove near the city of Progreso in September 2020 (top image) and in November 2020 (bottom), after suffering from severe flooding.
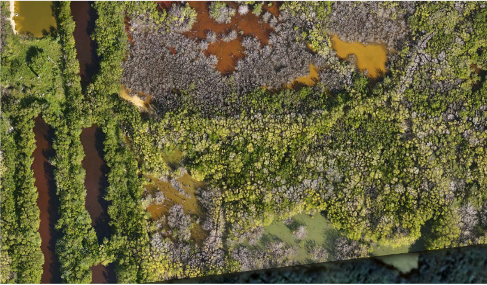
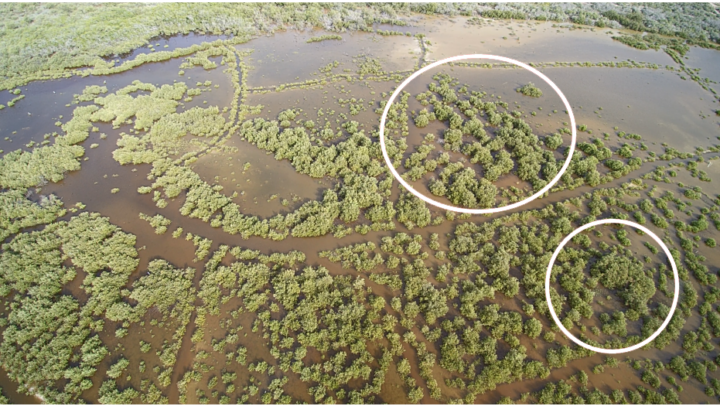
The images below show an area near the Yucalpetén port, a few kilometers west of Progreso. Note the difference in defoliated trees from 2019 (top image) and in 2020 (bottom). In addition to defoliation, mangrove damage can also include the loss of seedlings, roots, and woody material.

The team will continue monitoring these and other sites for at least the next two years as they study mangrove regrowth and recovery through the COastal biodiversity RESilience to increasing extreme events in Central America (CORESCAM) project.
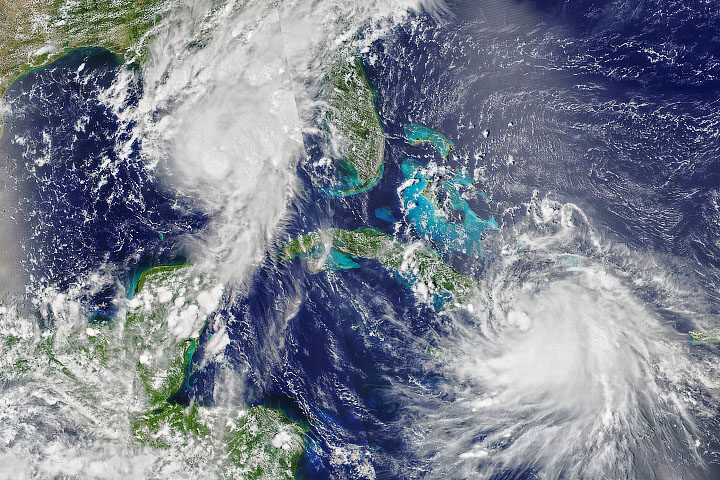
The 2020 Atlantic Hurricane season, which runs from June 1 to November 30, is off to an extremely active start. For the first time in modern history, nine named storms formed in the basin before August 1. (The historical average is two storms before August 1.) The National Hurricane Center predicted 19 to 25 named Atlantic storms in 2020, with 7 to 11 of those storms strong enough to be classified as hurricanes.
Accessing NASA data to track and research these events can sometimes feel like a maze. For a comprehensive starting point, Earthdata has a new Cyclones Data Pathfinder summarizing the data available for pre-assessing storms, making near real-time assessments, and conducting post-storm analysis. There is clear information on where to find and easily visualize those datasets.
In addition, you will find an article in the “Learn” section of Earthdata that covers the improvements made to hurricane forecasts and near real-time observations in recent years and what future NASA missions might bring to the study of tropical storms. It also examines some different satellite observations that can contribute to better forecasting, such as sea surface temperatures (SST) and soil moisture measurements.
For the developers, the Earth Observatory Natural Event Tracker (EONET) can be used to monitor tropical storms through an API that provides up-to-date metadata for a variety of curated natural events. Use the How-to Guide to find out more about how EONET can be used to track storms.
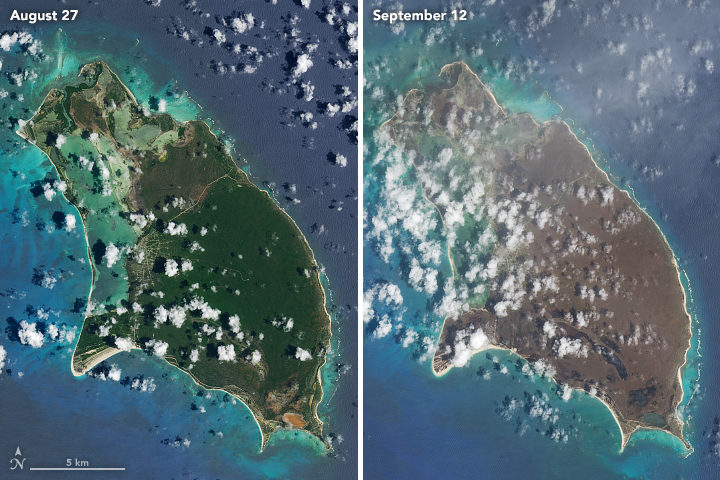
NASA Earth Observatory images of Barbuda by Joshua Stevens, using Landsat data from the U.S. Geological Survey.
We recently posted several striking pairs of satellite images of Caribbean islands before and after they were hit by Hurricane Irma. The images show lush, green vegetation turning a dark shade of brown. We were curious about what exactly caused the damage and how quickly vegetation might recover, so we checked in with Edmund Tanner, a University of Cambridge ecologist who has authored multiple studies about vegetation damage and recovery after Caribbean hurricanes.
EO: What were the primary mechanisms that turned the islands brown? Leaves blown away by the wind? Mud and debris covering them up? Salt spray killing them off?
Away from the sea (100 meters or so), most of the green to brown is the loss of green leaves because they were blown off. Native vegetation on these islands has been through hundreds of hurricanes since the last major change of climate (10,000 years ago, the end of the most recent ice age) and have been naturally selected to lose leaves and small branches and re-sprout. I doubt if it is mud since the fairly heavy rain will have washed that off. Most of the water falling on the vegetation would have be fresh—rain—not sea spray.
EO: How long will it take for the vegetation to recover?
My guess is the greening up in the lowlands will take 6 months, with a lot happening in the first 3-4 months. You can probably measure that from satellite images. On the ground, there will be lots of sprouts on tree trunks. For larger trees, the surviving branches will produce leaves and small branches and slowly these will shade out and kill the epicormic shoots produced on the lower parts of trunks
.
EO: What about storm surge? Was that a major factor in killing trees and other vegetation?
Salt water from storm surge may have killed trees whose roots were inundated with it. Those trees will take much longer to recover because the soil will need to be desalinated naturally by rain, and seeds will have to germinate and grow. The areas involved are not likely to be large—a fringing zone of a few hundred hectares in some places.
EO: How useful are satellites in assessing vegetation damage caused by hurricanes?
Very useful. Especially for measuring the change in green from before the hurricane to brown immediately after the hurricane, to greening up over weeks and months after the hurricane. Modern analyses of satellite images could also show the decrease in individual tree canopy size if trees lost big branches and only regrew them slowly.
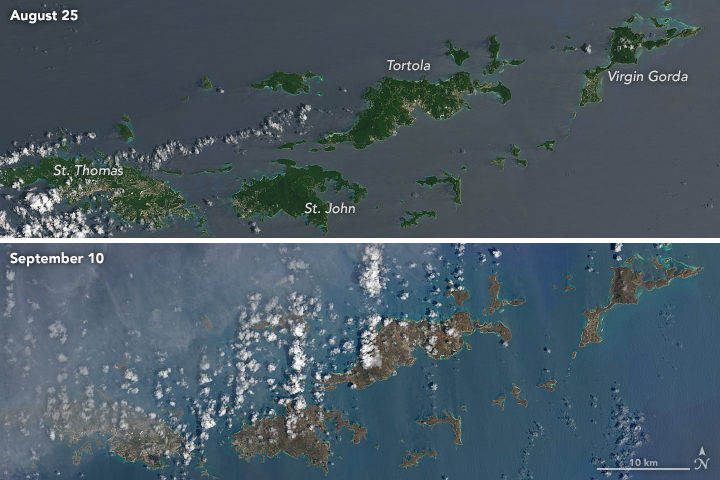
NASA Earth Observatory images of the virgin islands by Joshua Stevens, using Landsat data from the U.S. Geological Survey.
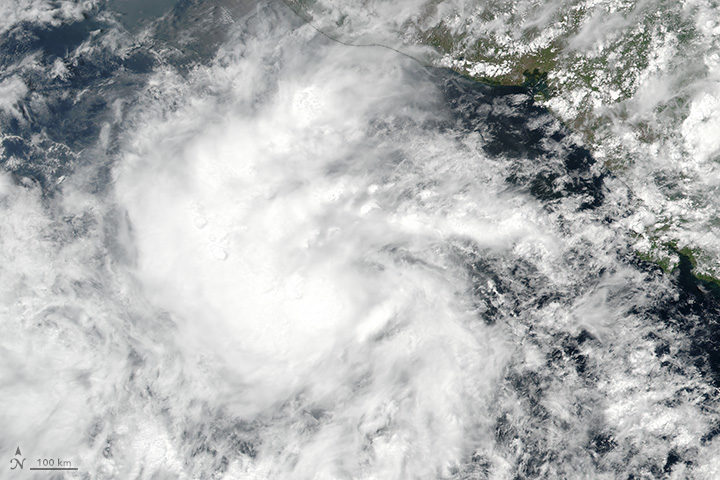
On May 9, 2017, the Visible Infrared Imaging Radiometer Suite (VIIRS) on the Suomi NPP satellite captured this image of a tropical depression off Central America. Later that day, the storm became Tropical Storm Adrian. The storm was not very well organized, as evidenced by its amorphous appearance. Despite warmer-than-average ocean surface temperatures, wind shear would keep the storm from strengthening into a hurricane.
But it wasn’t the storm’s strength that was worth noting; it was its timing. Adrian earned the title of “earliest tropical storm to form in the East Pacific” since reliable records began in 1970. It takes the top spot from Tropical Storm Alma, which formed on May 12, 1990. Read more about Adrian on the Weather Underground Category 6 blog here and here.

Credit: NASA Earth Observatory/VIIRS/Jesse Allen. More details about the image here.
In the past two months, weather reports in California, Oregon, and Washington have been filled with news of “atmospheric rivers” bringing copious amounts of rain and snow to the western United States. Atmospheric rivers are long, thin fingers of moisture that develop in the tropics and flow into higher latitudes. If one of them makes landfall, huge of amounts of rain and snow can fall in a short period.
Much of this moisture, of course, eventually finds its way back to the sea through rivers. When waterways are swollen and flowing rapidly, they also become rivers of suspended sediment, full of clay, mud, sand, and other debris. Though the flooding from atmospheric river events can be devastating, the enormous amount of sediment they send rushing into the sea can also be surprisingly beautiful.
For instance, on February 11, 2017, the Visible Infrared Imaging Radiometer Suite (VIIRS) on Suomi NPP acquired this remarkable view of rivers and streams spewing sediment into the Pacific Ocean. Close to the outlets of streams and rivers, sediment-rich waters appear brown. As the sediment dissipates and mixes into the ocean, the water appears teal.
Duane Waliser, a scientist at NASA’s Jet Propulsion Laboratory, recently tallied just how damaging atmospheric rivers can be for coastal areas. In a study published in Nature Geoscience, Waliser and a colleague showed that atmospheric rivers are among the most damaging storm types in the middle latitudes. Of the very wettest and windiest storms (those ranked in the top 2 percent), atmospheric rivers were associated with nearly half of them. Waliser and colleagues also found that atmospheric rivers were associated with a doubling of the typical wind speed compared to all storm conditions.

Image originally published by NOAA.

After Hurricane Matthew ripped through Haiti, it blew through the Southeast. From above, NASA satellites, aircraft, and astronauts kept watch on the storm. The Earth Observatory published several images of the destructive storm (thumbnails above). The below includes a sampling of other notable images and maps related to the storm.
Soil Moisture
Matthew drenched the Carolinas, breaking records for single day rainfall in six places, The Washington Post reported. The Southeast received a total of 13.6 trillion gallons of water—that’s three-fourths the volume of the Chesapeake Bay. Hard-hit areas of North Carolina received 15 inches (38 centimeters) of rain.
That downpour saturated the area, causing values for soil moisture to increase substantially. The North American Land Data Assimilation System (NLDAS) mapped these values for October 1, 2016.
Even before the storm arrived, the ground in many areas was saturated. Eastern North Carolina and northeastern South Carolina have localized areas over the 98th percentile. That means that on October 1, the soil was wetter than it was on that date in 98 percent of previous years. The already-wet soils and heavy precipitation from Matthew led to significant flooding in these areas.

Image: NASA
Temperature and Precipitation
The Jet Propulsion Laboratory (JPL) HAMSR instrument flew above Hurricane Matthew on October 7, 2016, aboard a NASA Global Hawk aircraft. The image below shows atmospheric temperatures overlaid atop ground-based radar and satellite visible images, according to a JPL release. Reds tones show a lack of clouds, whereas blue tones show ice and heavy precipitation. At the top left is an image taken from the Global Hawk.

Image: JPL/NASA
Clouds Swirling from Above
Expedition 49 astronaut Kate Rubins took the photograph below from the International Space Station at 21:05 Universal Time, on October 4, 2016, as the hurricane approached the Florida coast. Hurricane clouds fill the shot, which includes the station’s solar arrays.

Photo: NASA/Kate Rubins
Heavy rains fell on Louisiana in August 2016, causing record-high crests for a number of rivers in the area. Map by Joshua Stevens/NASA Earth Observatory.
In the United States, we say “it’s raining cats and dogs” when we get a heavy downpour. In South Africa, it rains “women with clubs.” In Slovakia, a good soak means “tractors are falling.”
World languages brim with rainy day idioms. But when it comes to describing copious amounts of wet stuff, meteorologists do not encourage wordplay. Researchers are particularly adamant about one expression that does not work: the “rain bomb.”
The summer of 2016 brought extreme rain to multiple parts of the U.S., taking lives and causing billions in property damage. In July, thunderstorms dumped more than six inches of rain on Elicott City, Maryland in roughly two hours, causing flash floods that upended cars and lives. In May, nearly eight inches of rain fell in two days, among a series of heavy rains to inundate Texas. Most recently in Louisiana, more than 30 inches of rain fell in three days, stranding 20,000 people and killing nine.
The Louisiana storm didn’t meet the criteria of a tropical depression as defined by the National Hurricane Center: a tropical cyclone in which the maximum sustained surface wind speed is 38 miles per hour (62 kilometers per hour) or less. In another instance of precise wording, 2012’s Hurricane Sandy technically ceased to be a “hurricane” a few hours before it made landfall, turning into a “post-tropical cyclone.”
For some in the media, “tropical depression” lacks pizzazz and conviction. It lacks the visceral pelting of tractors falling out of the sky or of women with clubs beating down on the Earth. Some news organizations referred to the Louisiana event as a rain bomb. So what should we call severe rain?
NASA scientists George Huffman and Owen Kelley parsed some of the commonly-used rain terminology.
For one, there’s the “rain shaft.” A rain shaft is a centralized column of precipitation—not necessarily heavy rain. “The rain shaft […] is any rain event, no matter how modest or foreboding, that can be seen stretching from the cloud to the ground,” wrote Huffman, a research meteorologist at NASA’s Goddard Space Flight Center.
Then, there are “microbursts.” These are severe wind events caused by a “small column of exceptionally intense and localized sinking air that results in a violent outrush of air at the ground,” according to AccuWeather. Microbursts are smaller than 2.5 miles (4 kilometers) in size.
Be careful of mixing rain shafts with microbursts, Huffman cautioned.
“Just as you don’t have a microburst with every rain shaft, you don’t necessarily have an identifiable rain shaft with every microburst,” wrote Huffman in an email. “The really interesting dynamics of microbursts are a bit rare, and frequently not present in flooding rains.”
There’s also a size distinction between the different systems, NASA scientists said. A rain shaft comes out of an individual convective cell, making it roughly five to ten kilometers across. (By contrast, tropical depressions measure roughly 100 to 500 kilometers across.)
But in some cases, like Louisiana’s, the term “tropical depression” works, said Owen Kelley. “You don’t need to appeal to rain shafts, microbursts, or rain bombs to explain this system,” Kelley wrote in an email. The storm in Louisiana was “just a plain-old tropical depression that got stuck in one place for several days in a row and therefore dumped a lot of rain in one place.” That weather system did display some of the common signs of a tropical system. For instance, Huffman notes that it had low pressure at low and middle altitudes, and high pressure at the top, “implying some degree of warm core.” (Mid-latitude systems have a cold core, with the most negative pressure deviation at the system’s top.)
Researchers agree, though, about one term, “rain bomb,” which appeared in a couple of articles this summer in reference to extreme rainfall events. Don’t use it, scientists said. While it makes for a catchy headline, “rain bomb” is not an established meteorological term.
For extreme rain, Kelley suggested yet another phrase: “vigorous convective cells.” These severe rainstorms can take on various forms: super-cells, squall lines, isolated cells.
Microbursts, rain shafts, vigorous convective cells. At the end, isn’t it all just wet stuff coming out of the sky? Yes and no, scientists say. Terms used to describe extreme rain should be used with an eye on precision. As extreme rains (and extreme weather, in general) become more frequent, so will the terms we use to describe them.
While I was interviewing University of North Carolina climate scientist Wei Mei about his new research that shows a significant increase in the intensity of land-falling typhoons in the western Pacific, the strongest storm of the 2016 season (Super Typhoon Meranti) was on the verge of slamming into China after grazing Taiwan.
“Meranti fits the trend,” said Wei. “In 2016 so far, there have been six typhoons in the northwestern Pacific. Three have already made it to category 4 or 5. In the late 1970s, only about one-quarter of typhoons reached that strength. Now about half do.”

NASA Earth Observatory MODIS image of Super Typhoon Meranti.
Some meteorologists have mused that with sustained winds of 165 knots (190 miles per hour), Meranti would have been the equivalent of a Category 6 storm—if the Saffir-Simpson scale actually went that high. (It maxes out at 5). Even though Meranti only grazed southern Taiwan, it still knocked out power to 500,000 households and produced giant waves along the coast.
The focus of Mei’s research, however, is not Meranti or the 2016 typhoon season. Working with colleague Shang-Ping Xie of Scripps Institution of Oceanography, Mei has been digging through records that detail every typhoon in the northwestern Pacific since 1977 and looking for changes in the intensity of storms. What they found was a strong increase in typhoon intensity. Overall, landfalling storms strengthened by about 15 percent over the past four decades, with the proportion of typhoons reaching categories 4 and 5 more than doubling. Mei and Xie showed that storms that passed over waters relatively near to land and moved toward land (red and green dots in the chart below) have strengthened the most. Those that stayed out over the open ocean (black and blue dots) did not strengthen by a significant amount.
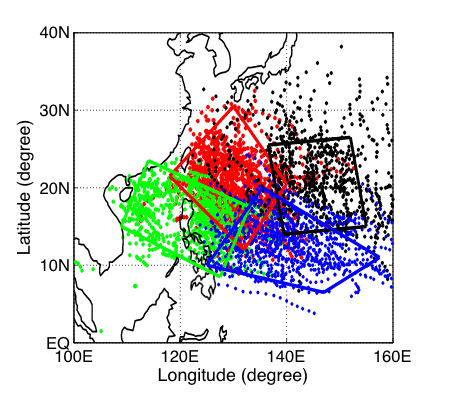
Figure from Mei and Xie, 2016.
“Elevated rates of warming in coastal seas (in comparison to the open ocean) are the reason for the intensification of land-falling typhoons,” said Mei. Between 1977 and 2013, many coastal areas in Asia have warmed by upwards of 0.20 degrees Celsius (0.36 degrees Fahrenheit) per decade along the coasts—more than twice as much as open ocean areas. In the chart below, notice all the deep reds (more warming) near the coasts; farther out to sea tends to be yellow and orange (less warming).
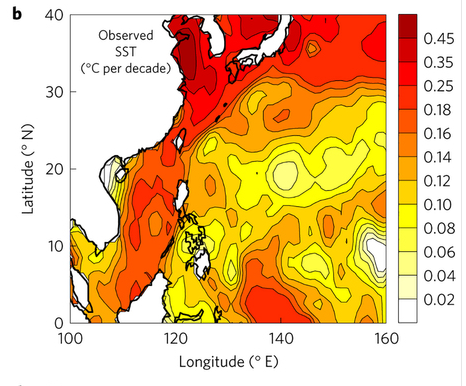
Figure from Mei and Xie, 2016.
“We are not arguing that the warming of the coastal seas is due to greenhouse gas-driven climate change; that would require attribution studies that we have not conducted yet,” he said. “But we feel confident that land-falling storms are getting stronger because of rising sea surface temperatures, particularly in a band off the coast of East and Southeast Asia.” A related 2015 study led by Mei argued that sea surface temperatures are a more important factor in controlling long-term variations in typhoon intensity than other factors, such as vertical wind shear.
In this study, Mei and Xie did not look at the frequency of storm development. Some storm researchers have argued that a warming world may make hurricanes and typhoons stronger but less frequent.
For more details about Mei and Xie’s latest study, read more from Scripps Institution of Oceanography, The Verge, and Nature Geoscience.

Himawari-8 image of Super Typhoon Meranti and night lights (in orange) of Asia via Colorado State University and Mashable.
