What does Earth look like from 98 miles up? A project developed by Colorado community college students is providing the opportunity for the public to see Earth from the perspective of a small rocket in flight.
The 360-degree camera experiment flew on a Terrier-Improved Malemute suborbital sounding rocket in August 2021 from NASA’s Wallops Flight Facility. The camera experiment was flown as part of the RockSat-X mission, a NASA education program in partnership with the Colorado Space Grant Consortium. Participating schools in the project included Arapahoe Community College in Littleton, Colorado, and Red Rocks Community College in Lakewood, Colorado.
“The goal of the project was to produce a video of a sounding rocket flight away from the body of the vehicle,” said Giovanni Rosanova, chief of the NASA sounding programs office at Wallops. “In addition to the educational and public outreach values of the project, the technology may also be used on NASA sounding rocket flights to observe science or technology instrument deployments during flight.”
“Over 50 community college students participated in the project,” said Chris Koehler, director of the Colorado Space Grant Consortium. “Developed over a two-year period, the project provided the students with many challenges, including how to get the camera away from the rocket and then protecting it from re-entry then impact in the ocean.”
“The students met the challenges, during a pandemic, and the camera system provided a spectacular and immersive view from space,” Koehler said.
Sounding rockets fly a parabolic or arc trajectory. Flying from 75 to 800 miles altitude, these rockets are used to conduct science, pursue technology development, and provide educational opportunities for students. They do not place experiments or satellites into orbit.
In October 2020, Mexico’s Yucatan Peninsula was doused by three storms: Gamma, Delta, and Eta. The storms came just months after tropical storm Cristobal delivered more than 50 centimeters (20 inches) of rainfall to the region in June. The accumulated rainfall and powerful winds significantly damaged mangrove forests in the region.
Scientists from NASA, Wageningen University, and Federal University of Viçosa have been assessing the damage in Central America using satellite data. A team based in the state of Yucatan also caught the action closer to the ground, using drones to capture mangrove changes before and after the 2020 hurricane season.
All photos are provided by Jorge Herrera from the Center for Research and Advanced Studies of the National Polytechnic Institute (CINVESTAV) and his team.
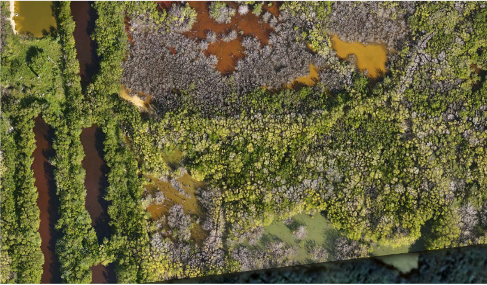
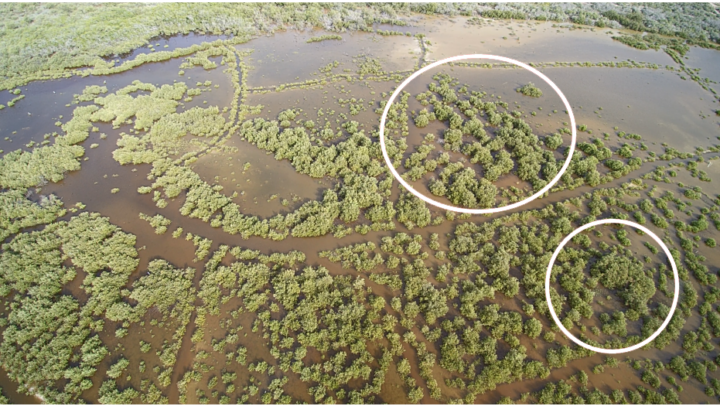
The October storms brought powerful winds that uprooted and defoliated mangrove forests near the coastal city of Dzilam el Bravo, located on the northern tip of the Yucatan Peninsula. The images below show changes from 2019 (top) to October 2020 (bottom), after Delta recently passed through the region.
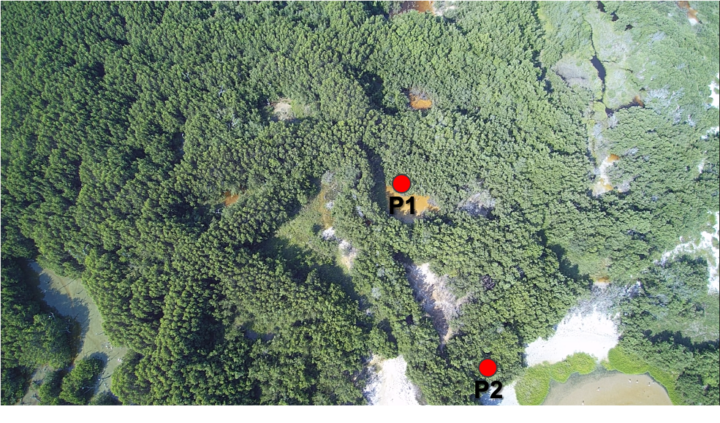
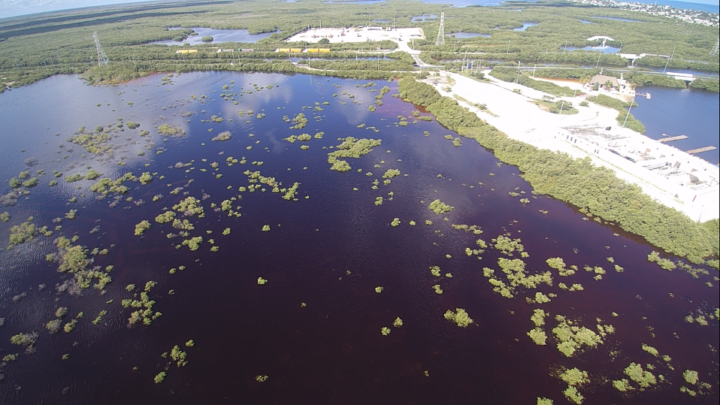
The storms also brought major flooding to other Yucatan regions. Extreme precipitation can affect oxygen concentrations in soils and hinder photosynthesis for mangroves. Large storm surges can also cause physical damage and uproot trees. The images below show a mangrove near the city of Progreso in September 2020 (top image) and in November 2020 (bottom), after suffering from severe flooding.
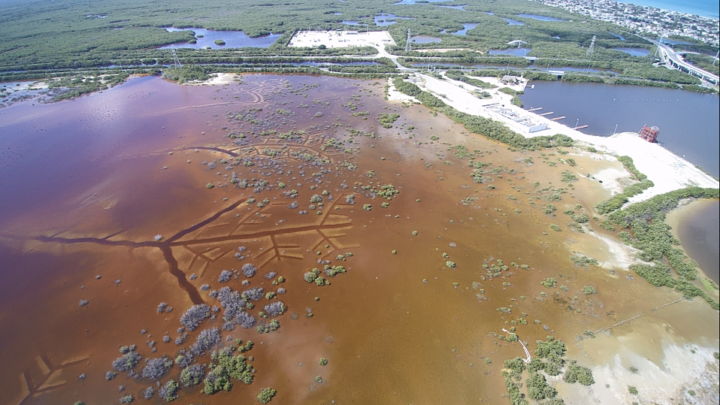
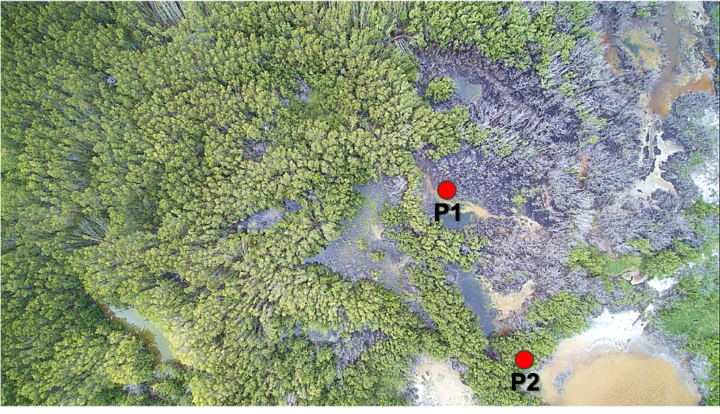
The images below show an area near the Yucalpetén port, a few kilometers west of Progreso. Note the difference in defoliated trees from 2019 (top image) and in 2020 (bottom). In addition to defoliation, mangrove damage can also include the loss of seedlings, roots, and woody material.

The team will continue monitoring these and other sites for at least the next two years as they study mangrove regrowth and recovery through the COastal biodiversity RESilience to increasing extreme events in Central America (CORESCAM) project.
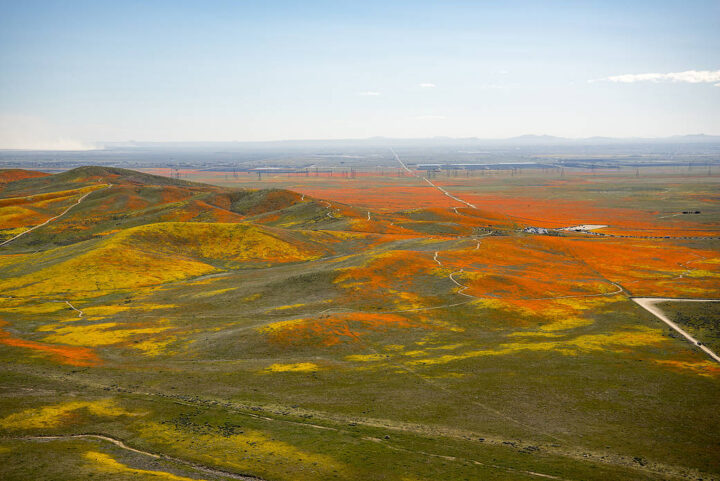
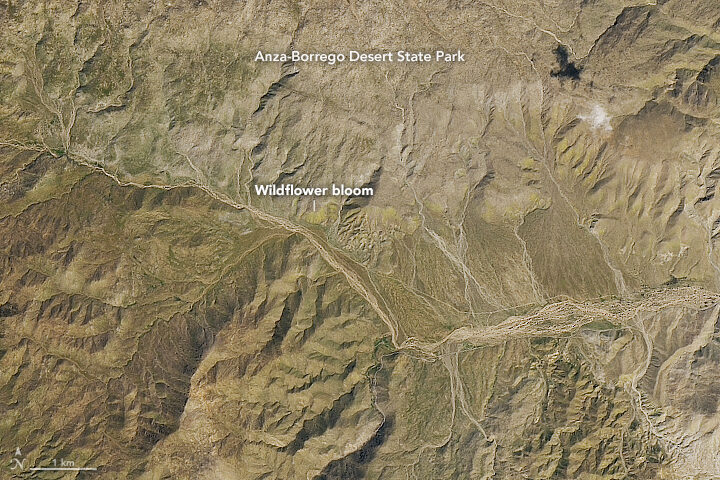
When we published a few Landsat images of wildflower super blooms in California in March 2019, you may have had to squint a little to find the flowers. From 705 kilometers (438 miles) above Earth’s surface, at the 15-meter-per-pixel resolution of the Operational Land Imager on Landsat 8, the flowers tend to blend with the hues of the desert.
Not so with this colorful photograph of poppies and other wildflowers in Antelope Valley that was taken from a T-34 airplane. The picture was shot by NASA Armstrong aerial photographer Jim Ross, who may have one of the coolest jobs at NASA. Watch the video below to find out how he got it.
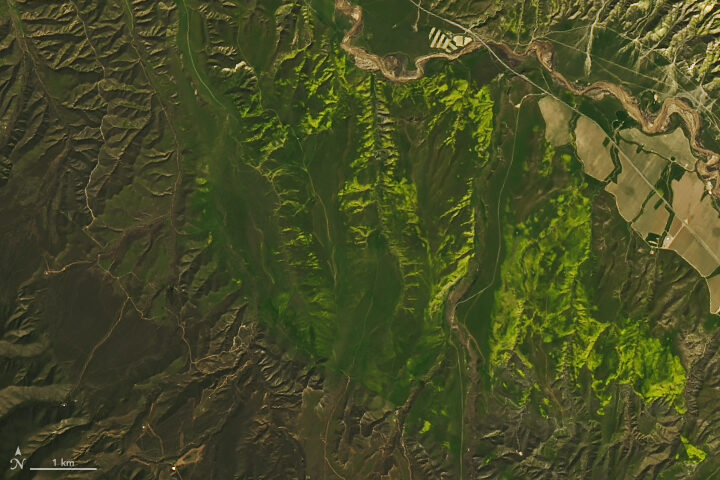
Meanwhile, remote sensing scientist Iban Ameztoy was inspired enough by the aerial photos to pull Sentinel-2 satellite imagery of the same bloom and share them on Twitter.
Want more satellite imagery and aerial photography of the super bloom in California? NASA Earth Observatory and NASA Armstrong have you covered.
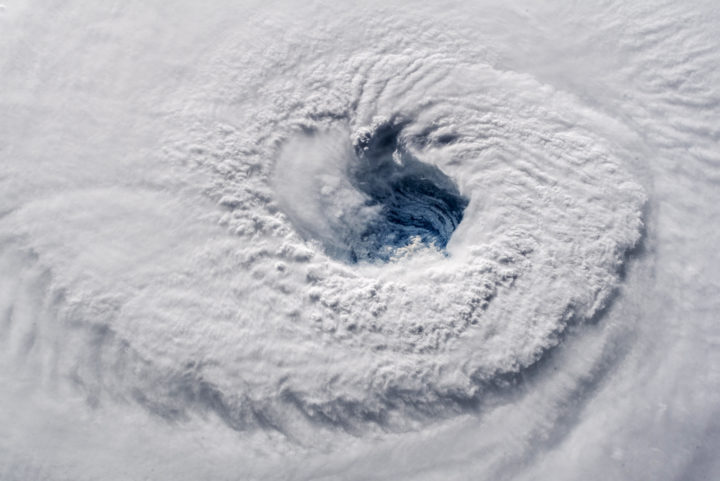
Early on September 12, 2018, astronaut Alex Gerst shot this photograph of Florence’s eye as viewed from the International Space Station. He tweeted: “Ever stared down the gaping eye of a category 4 hurricane? It’s chilling, even from space.” Credit: ISS Photograph by Alex Gerst, European Space Agency/NASA
When Hurricane Florence approached the Carolinas, the NASA Disasters Program began providing a suite of satellite data products to disaster responders, such as the Federal Emergency Management Agency (FEMA) and the National Guard. The goal was to provide the latest information for decision-making on everything from evacuations to supply routes to recovery estimates.
Andrew Molthan is a research meteorologist at NASA’s Marshall Space Flight Center who serves as a “disaster coordinator” for the disasters program. This week, he has been sitting at the FEMA National Response Coordination Center in Washington, D.C., to facilitate coordination of NASA data. We asked him a few questions to better understand the NASA Disaster Program’s role during Hurricane Florence.
What is your role at FEMA this week?
I am here at FEMA to better understand the agency’s geospatial needs during a major disaster, to help improve coordination, and to lend additional remote sensing and/or meteorological expertise where I can.
I am also helping with coordination and data exploitation for the Uninhabited Aerial Vehicle Synthetic Aperture Radar (UAVSAR) instrument aboard NASA’s C-20A aircraft, operated by a pilot. As a team, colleagues from NASA centers all over the country—Marshall, Headquarters, Jet Propulsion Laboratory, Armstrong Flight Research Center, Goddard Space Flight Center, and Langley Research Center—are working collaboratively to help target the UAVSAR instrument for daily radar imaging over the most critical rivers of interest to FEMA, the National Guard, and other partners. Scientists are assisting agencies in the interpretation of the UAVSAR imagery to inform immediate response efforts. They will also further process the data and use it as part of longer-term efforts to improve flood remote sensing and improve streamflow and inundation models.
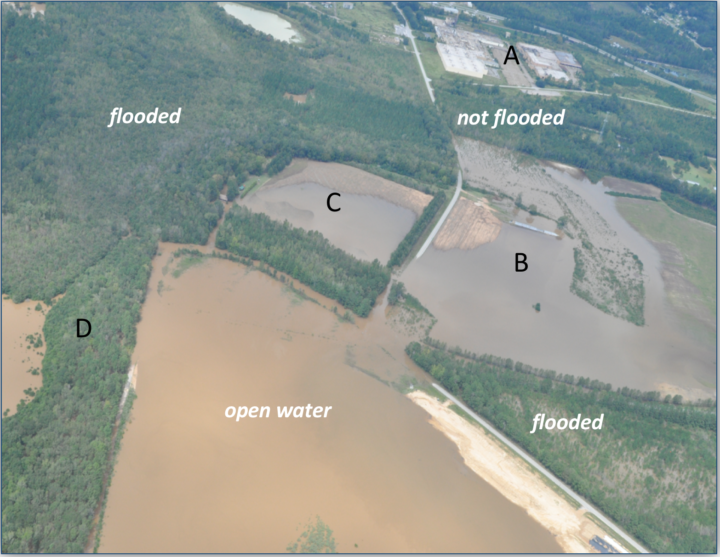
Above: Civil Air Patrol photo taken on September 18, 2018 near Cheraw, SC. Credit: Civil Air Patrol
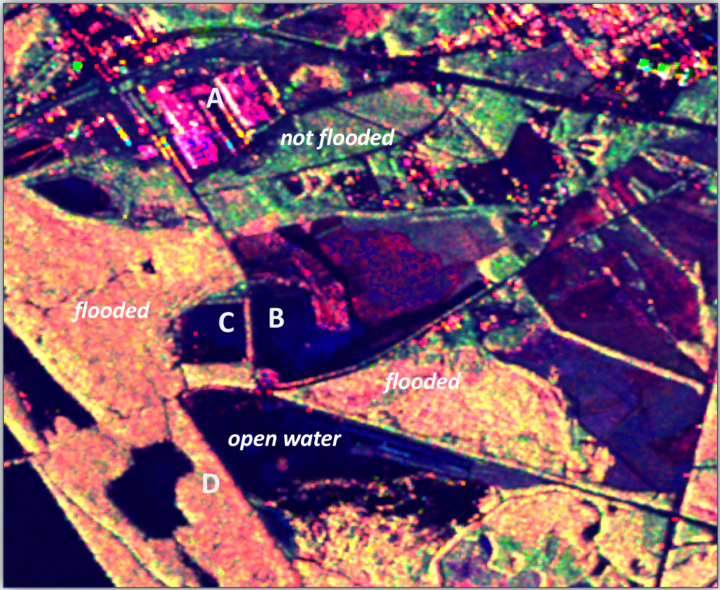
Above: UAVSAR polarimetric decomposition image taken on September 17, 2018 near Cheraw, SC (same area as Civil Air Patrol photo above). Pink denotes urban areas whereas red/orange denotes inundated forests. Dark blue or black are flooded open water; roads can be black even if not flooded. Green, yellow, and light blue color denote areas that are not flooded. Note: Red — Double bounce scattering (flooded forests and urban); Green – Volume scattering (unflooded forests); Blue – specular scatters (dry bare ground, open water). Credit: Yunling Lou/JPL, Bruce Chapman/JPL and Gerald Bawden/HQ
What NASA products are being shared with the National Guard and FEMA?
Most of our activities have focused on helping with the remote sensing of flooded areas following the heavy rains associated with Hurricane Florence. Many river basins in southern Virginia, central and eastern North Carolina, and northeastern South Carolina have experienced widespread river flooding and flash flooding that has affected citizens and need to be monitored for response efforts.
Above: This GPM IMERG visualization shows storm-total accumulated rainfall on the left for 9/12/18 – 9/17/18 vs. a sequence of 3-hour accumulations on the right. Credit: NASA
NASA Marshall team members are producing products and assisting with event coordination including my spot here at FEMA supporting their geospatial team. Scientists with the Jet Propulsion Laboratory (the ARIA team) are routinely generating flood- and damage proxy maps. Goddard researchers are assisting with optical and radar flood detections. The Langley Research Center is assisting with data access and sharing via GIS platforms. NASA Headquarters is supporting overall agency coordination. Johnson Space Center is helping to acquire dramatic footage of the storm and aftermath from astronaut photography.
What instruments are being used?
The extensive cloud cover from the storm has blocked surface views from instruments operating in the visible, near infrared, and thermal wavelengths, so synthetic aperture radar (SAR) information has been critical. SAR has the ability to “see” through clouds, making it an all-weather instrument. These include images from the European Space Agency’s Sentinel-1A/1B platforms, international and commercial partner assets, such as those from the Japan Aerospace Exploration Agency’s ALOS-2, Canadian Space Agency’s Radarsat-2, and the German TerraSARx, which are made available through government partnerships and the International Charter on Space and Major Disasters.
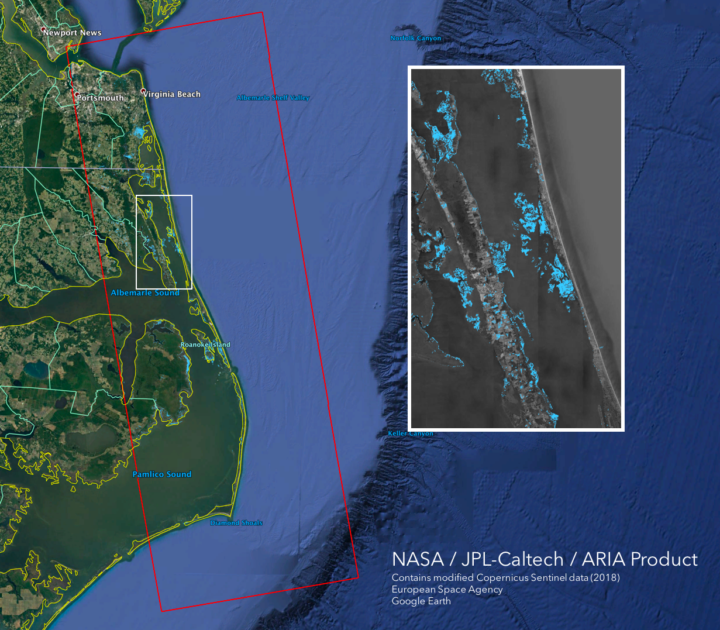
This flood proxy map shows the extent of flooding 36 hours after the hurricane’s landfall (September 15, 2018 18:57 PM local time). The map is derived from Synthetic Aperture Radar (SAR) data from the Copernicus Sentinel-1 satellites, operated by the European Space Agency (ESA).
As skies are now beginning to clear, we’ll also look for opportunities to use other NASA satellite remote sensing assets — including Terra/Aqua MODIS, Suomi-NPP VIIRS, Landsat 8 — and applications to identify water on the surface. We’ll also take a look at nighttime light imaging from Suomi-NPP VIIRS and the day-night band, using the NASA Black Marble and Black Marble HD products generated at Goddard.
Above: The VIIRS instrument on the joint NASA/NOAA Suomi NPP satellite observed Hurricane Florence as it developed in the Atlantic Ocean and made landfall in North Carolina on Sept. 14, 2018. Credits: NASA Worldview
Tidewater glaciers—glaciers that flow from inland mountains all the way into the sea—are perhaps best known for birthing new icebergs in spectacular fashion. As members of James Balog’s Extreme Ice Survey team captured in this clip (above) of Ilulissat Glacier in western Greenland, calving events can feature huge chunks of ice tumbling into roiling waters and be accompanied by loud booming and splashing sounds.
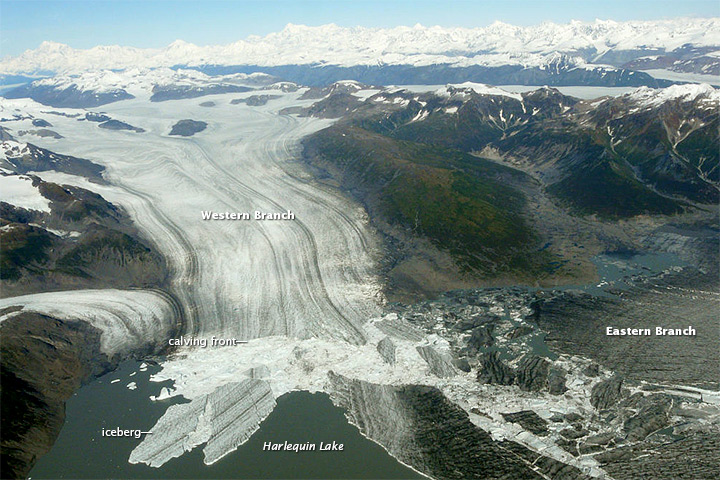
However, tidewater glaciers aren’t the only type of glacier that calve. The ends of lacustrine, or lake, glaciers also break off periodically. Such glaciers gouge depressions in the ground, and those holes fill with melt water to become proglacial lakes. While many of these lakes are small and ephemeral, some are large enough to serve as the backdrop for sizable calving events.
University of Alaska glaciologist Martin Truffer captured this sequence of images (below), which show a calving event at Yakutat Glacier in southeastern Alaska on July 16, 2009. “What we see in the video is a huge iceberg breaking off and rotating. I don’t have a good estimate of the size, but the part of the front that broke of is at least one kilometer long. I think it is quite unusual to see such large ice bergs overturning in lake-calving glaciers. Mostly, they just break off and quietly drift away,” Truffer noted in an email.
There are some key differences between calving events at tidewater and lacustrine glaciers. Tidewater glaciers tend to have much steeper calving fronts than their freshwater cousins. Also, lake water is generally much cooler than seawater, and there is less water circulation in lakes due to the absence of tides. As a result, tidewater glaciers calve much more frequently and are much less likely to have floating tongues of ice, which are common on lake-calving glaciers.
To learn more about Yakutat Glacier, read the Image of the Day we published on August 20, 2014. To learn more about the differences between lake-calving and tidewater glaciers, read this study published in the Journal of Glaciology. And to see more photographs of Yakutat Glacier, check out Martin Truffer’s field dispatches on his Glacier Adventures blog. I’ve included one of my favorites—an aerial shot taken on September 26, 2011, after Yakut retreated enough that its single calving face had divided into two separate branches. The photograph was taken by William Dryer, one of Truffer’s colleagues.