The Earth Observatory has published its last Image of the Day on this website. Please join us on our new home at science.nasa.gov/earth/earth-observatory.
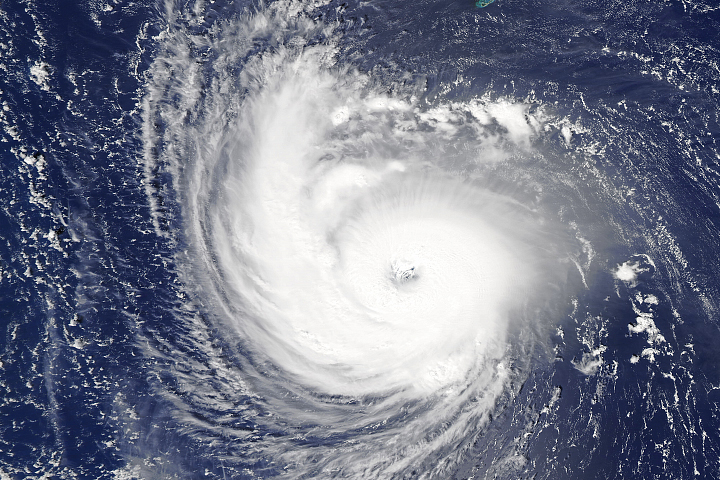
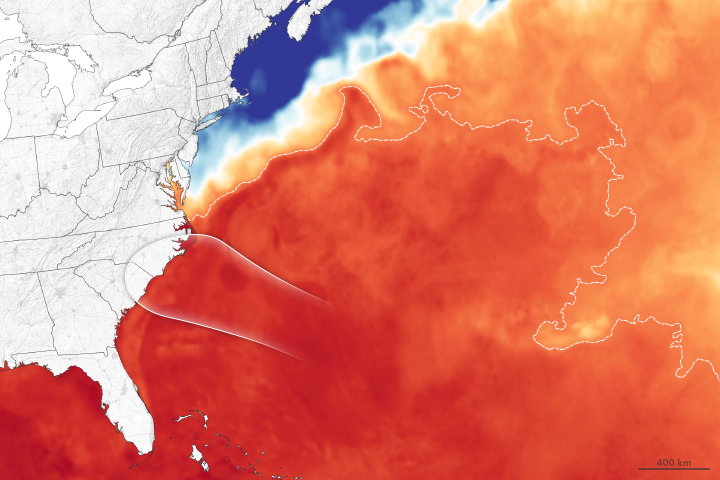
Upon making landfall on the southeastern U.S. coast on September 14, 2018, Hurricane Florence brought strong winds and torrential rains that flooded roads, houses, and rivers to historic levels and left hundreds of thousands of people without power. NASA data and researchers observed and analyzed the event, providing a steady stream of information to the Federal Emergency Management Agency (FEMA) and the National Guard to help assess the hurricane's impact.
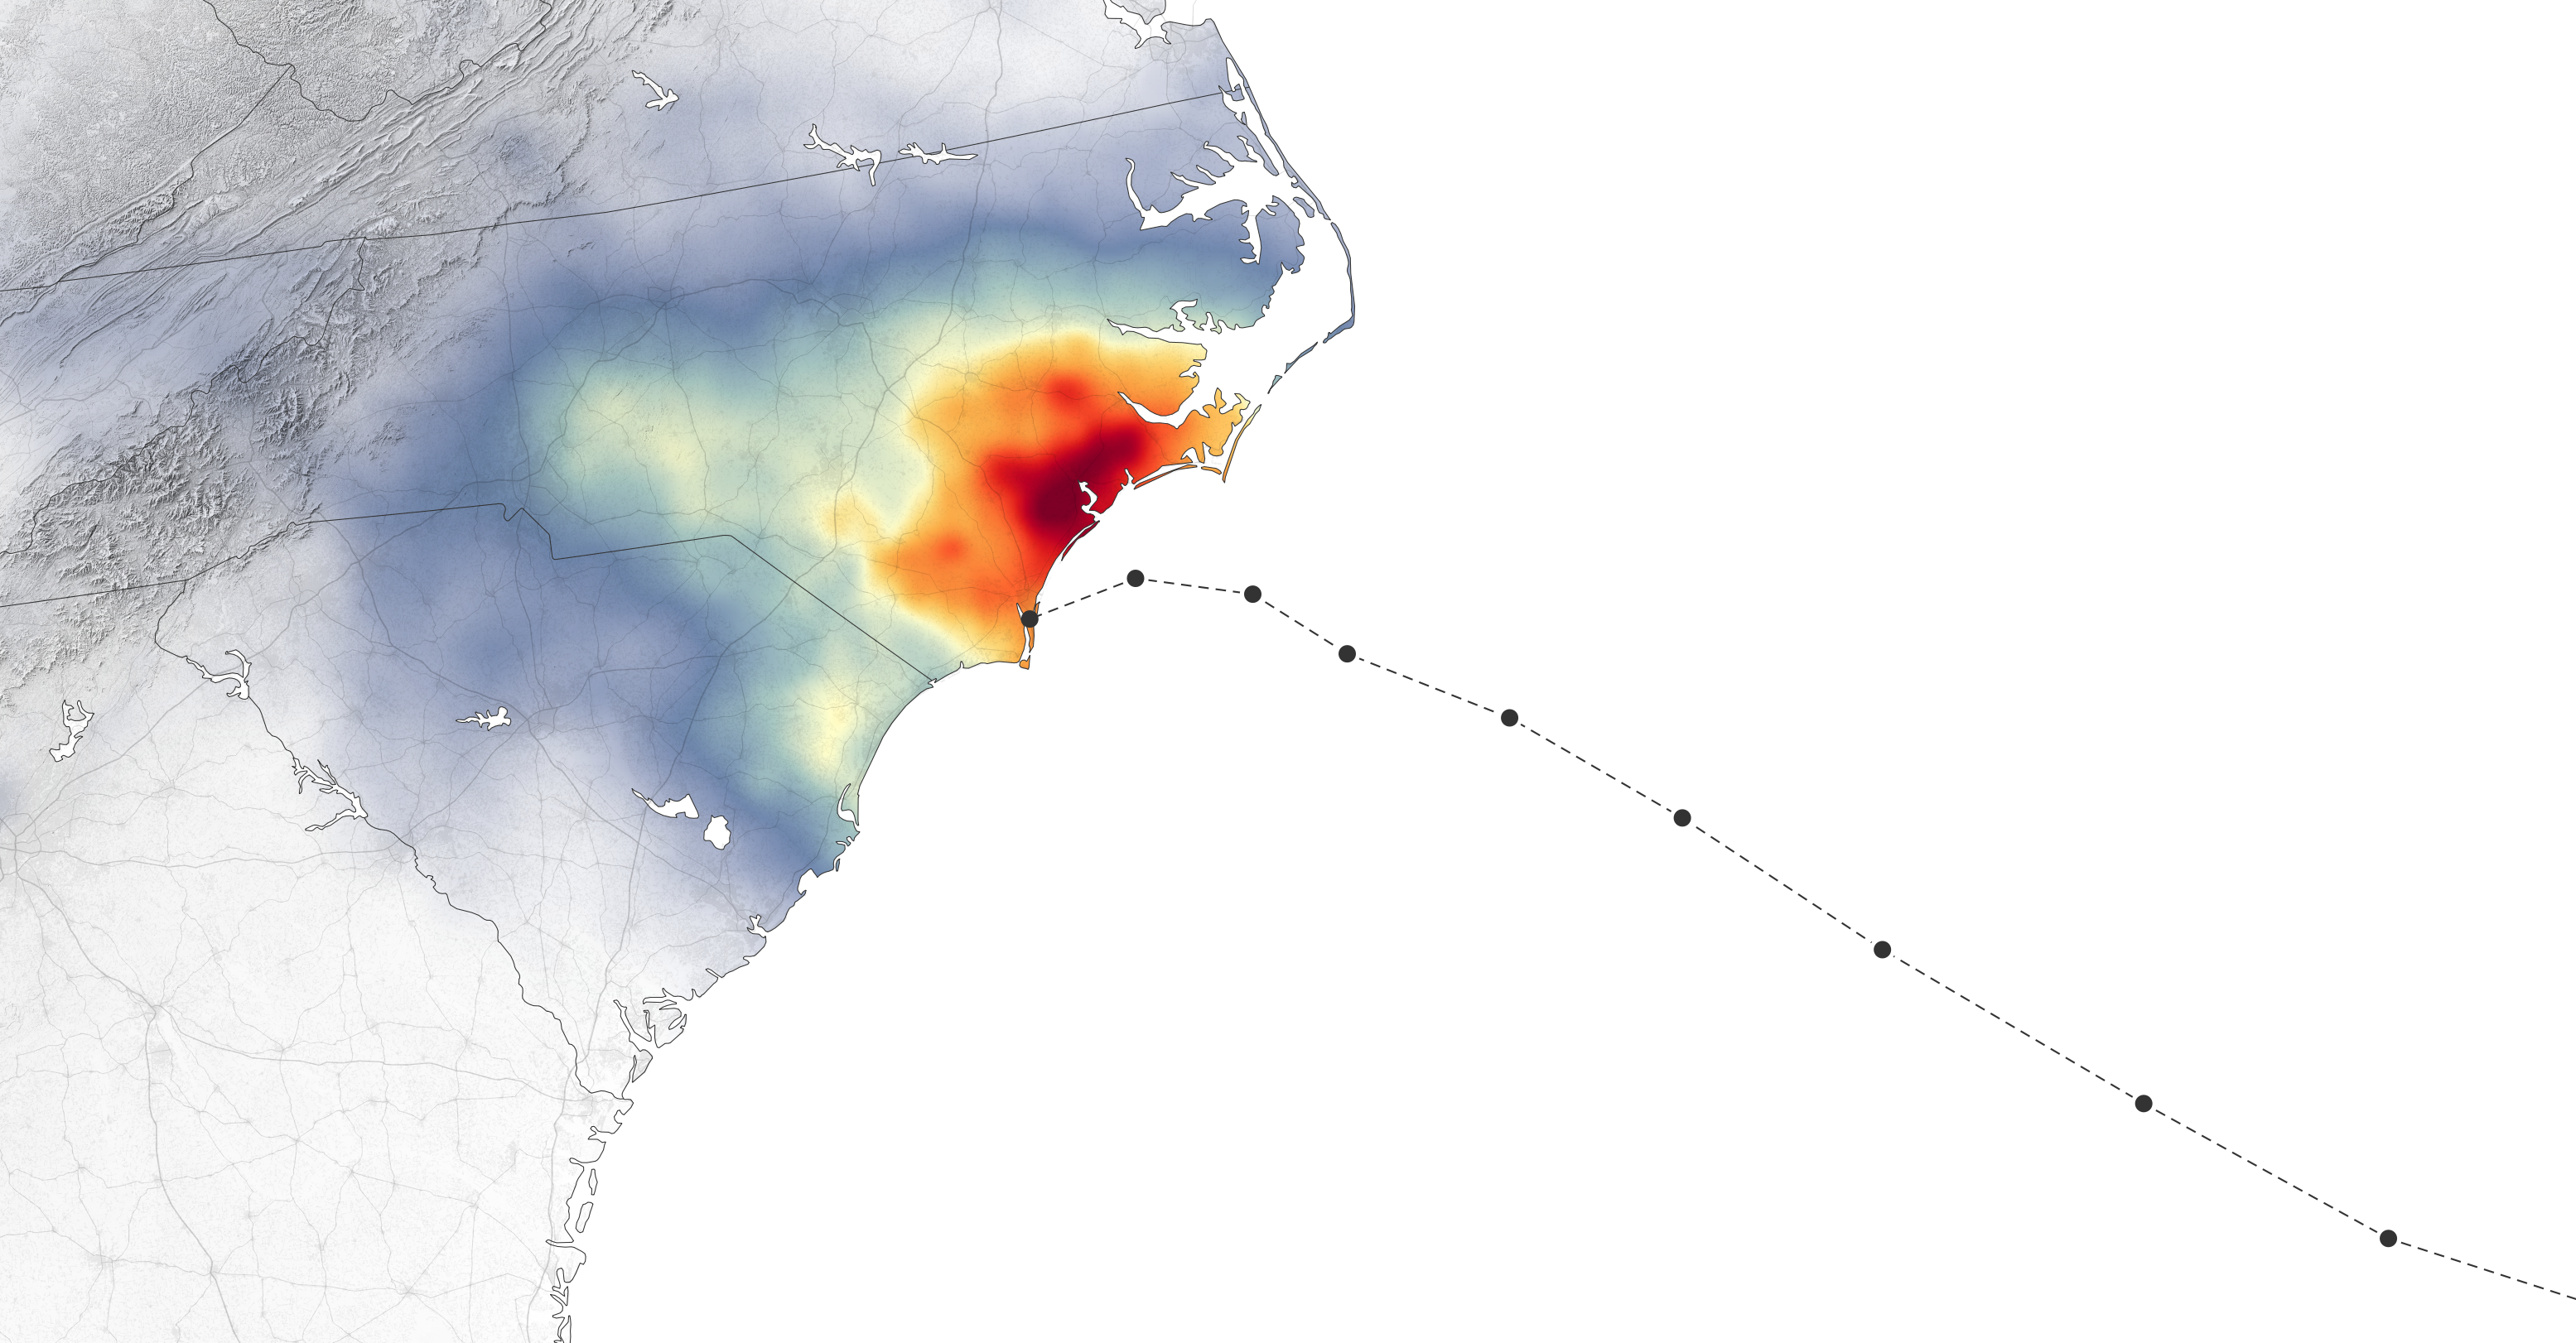
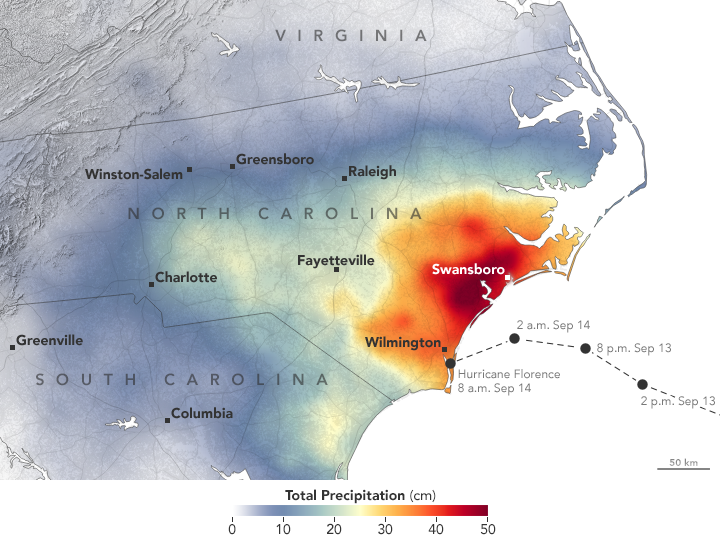
Elizabethtown and Swansboro, North Carolina, received the highest recorded rainfall totals in the region—surpassing 33 inches (83 centimeters)— from September 13 to 18, according to the National Weather Service. Trent River, about 40 miles (60 kilometers) northwest of Swanson, swelled to levels exceeding previous records. At least 28 cities and towns in North Carolina received at least 20 inches of rain. Flooded roads isolated some areas such as Wilmington, where officials were planning to airlift food and water into the city.
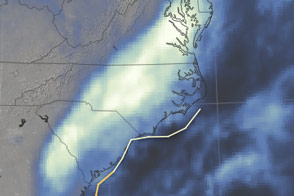
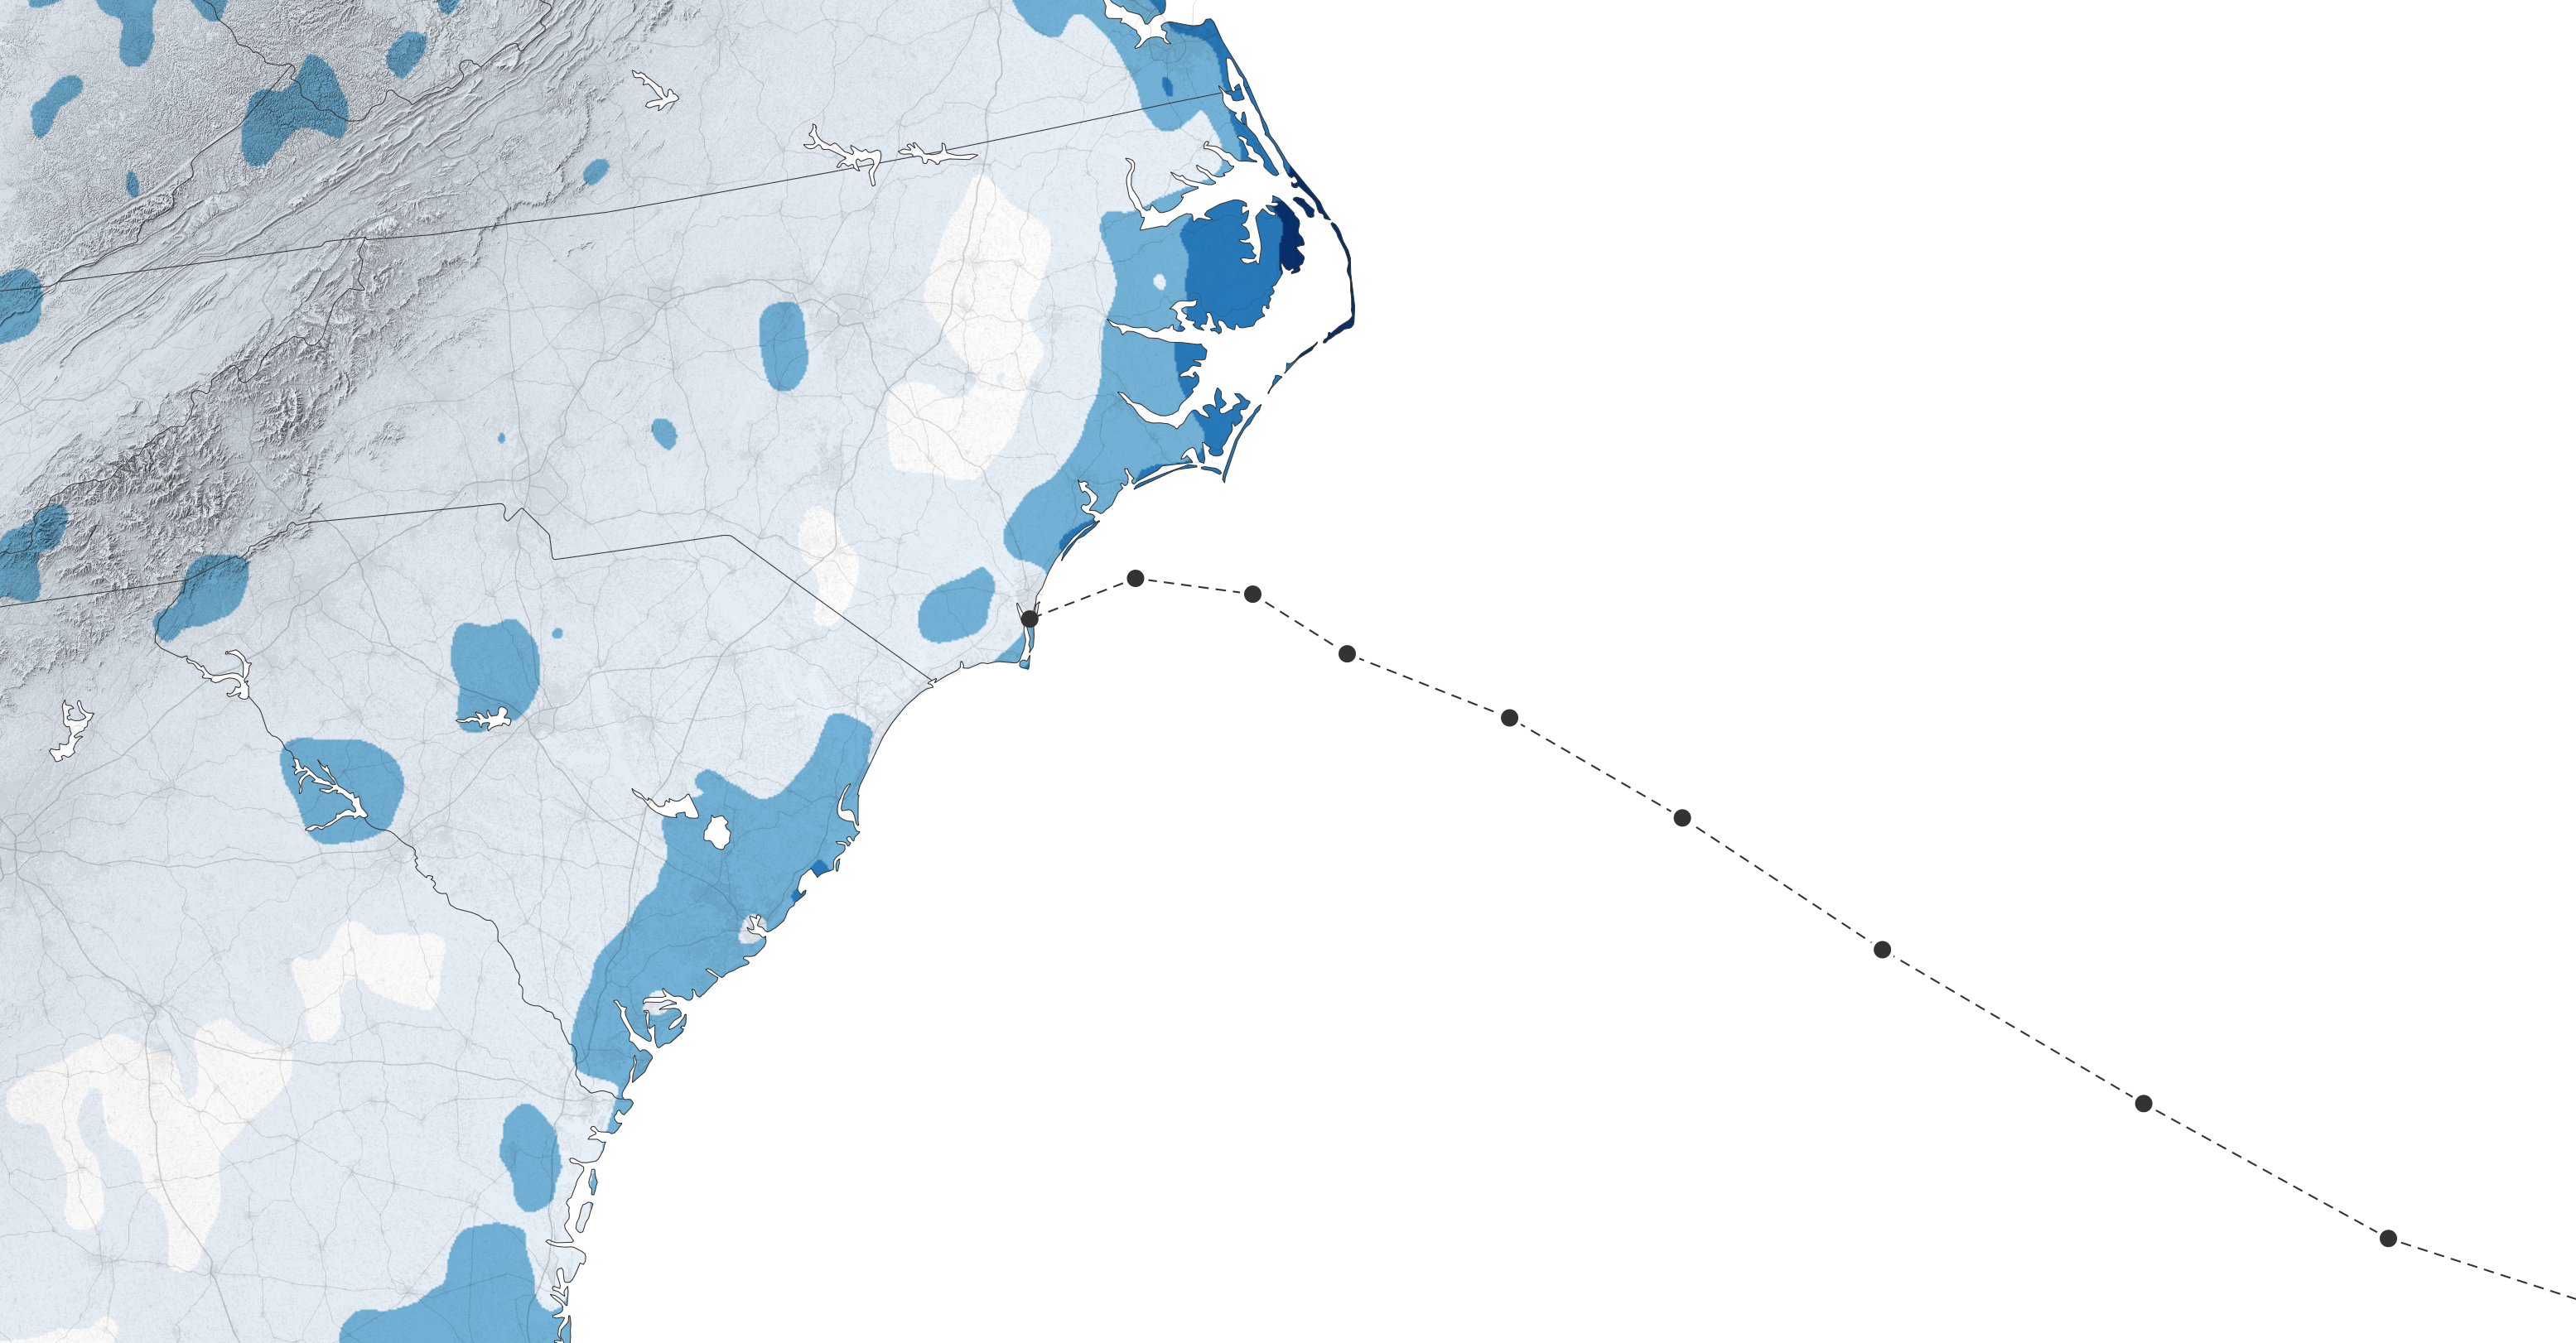
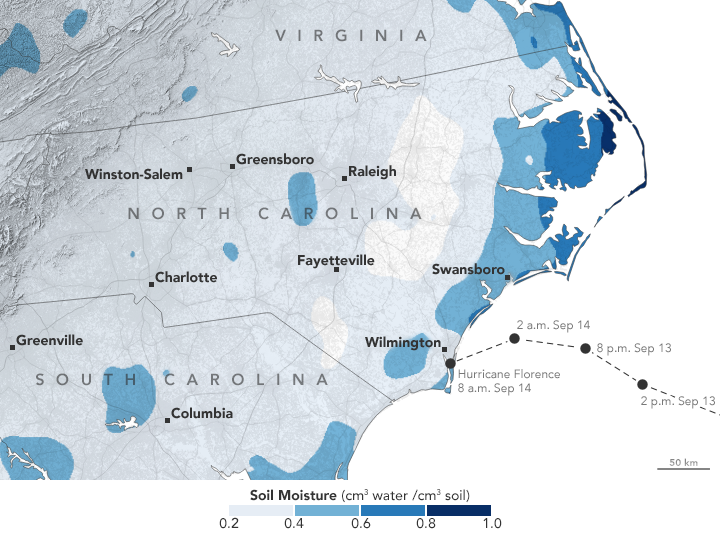
The images on this page show different views of hurricane-related moisture on the Carolina coast. The left image above shows soil moisture in the region on September 11, 2018, before the arrival of Hurricane Florence. The data for that map come from the Soil Moisture Active Passive (SMAP) satellite, which uses a radiometer to measure soil moisture in the top 5 centimeters of the ground.
The right image shows the rain accumulation from September 13–16. These rainfall data are remotely-sensed estimates that come from the Integrated Multi-Satellite Retrievals (IMERG), a product of the Global Precipitation Measurement (GPM) mission. Local rainfall amounts can be significantly higher when measured from the ground.
Heavier rainfall occurred on the right/north side of the hurricane track, similar to past hurricanes. As hurricanes in the northern hemisphere spin counterclockwise, winds on the right side tend to be stronger and can increase evaporation from the surface, particularly over the ocean.
“But it's probably more important that the stream of air being pulled up the right side is coming from the tropics, which tend to have more moisture that feeds the precipitation,” said George Huffman, a research meteorologist at NASA’s Goddard Space Flight Center. “As you get close to landfall, the left side starts getting fed by air from the land, which is almost always drier.”
Rainfall has tapered off in the Carolinas, but the National Weather Service expects major river flooding to persist for at least a week.
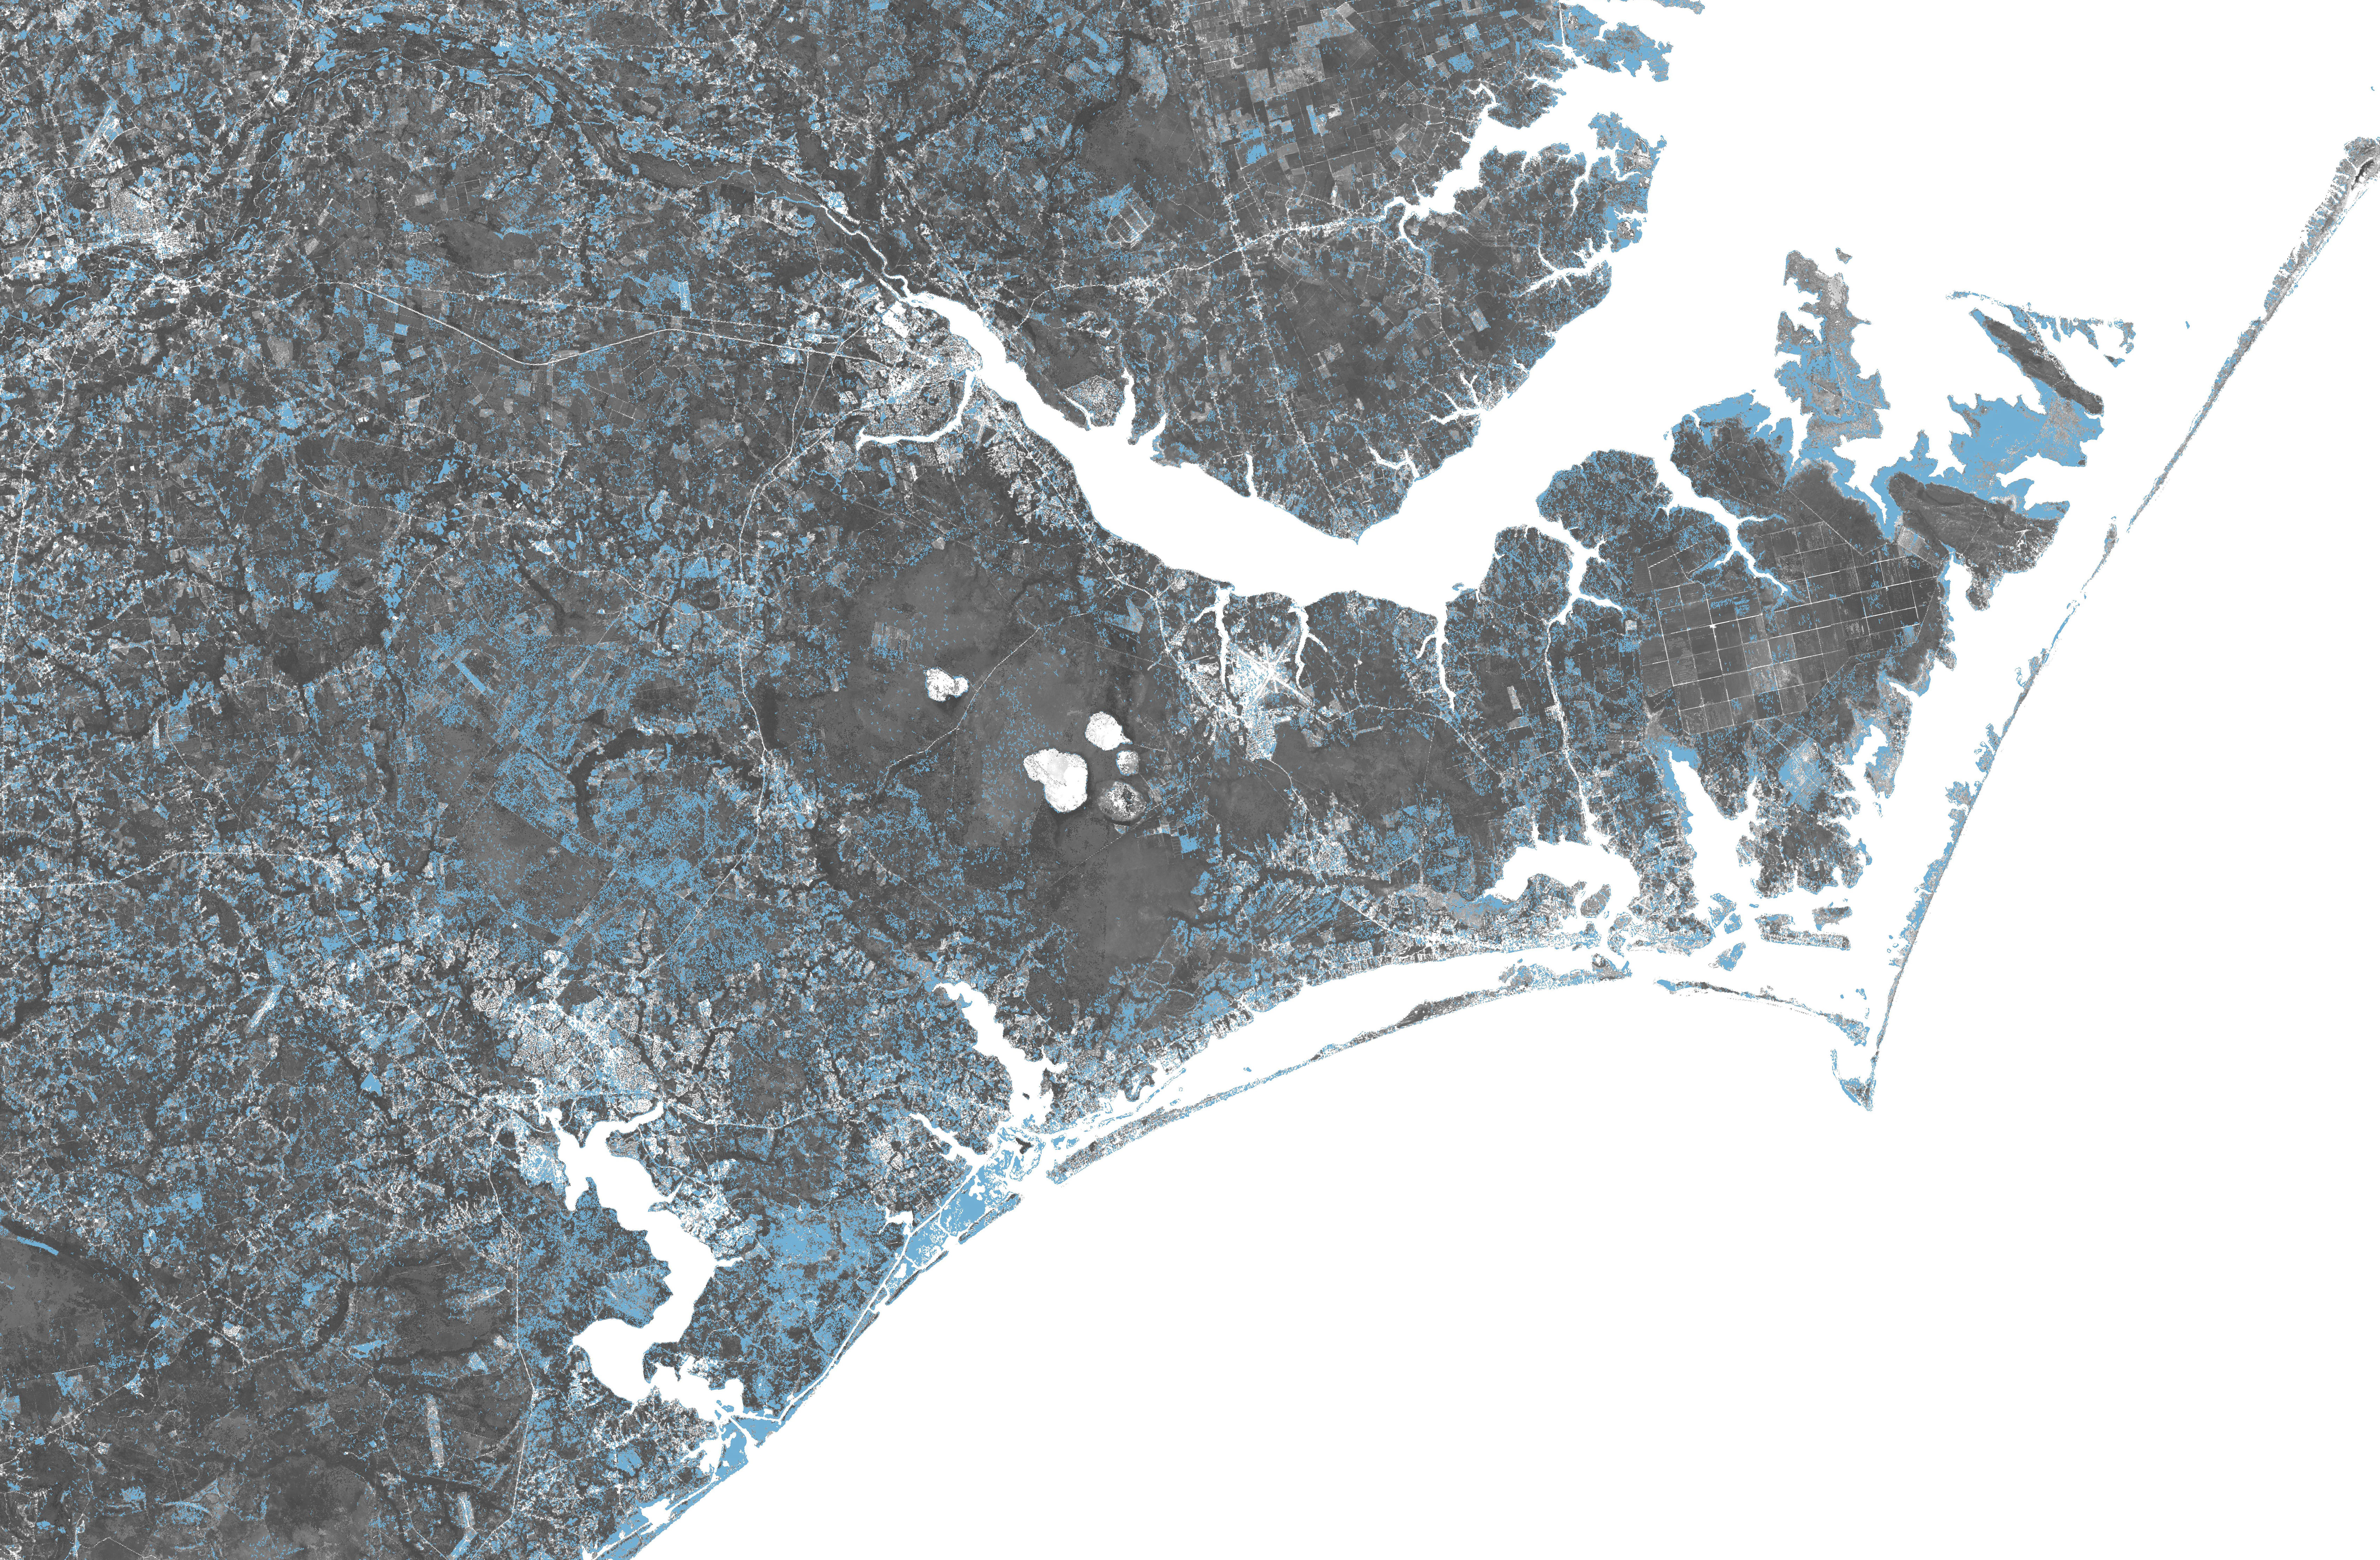
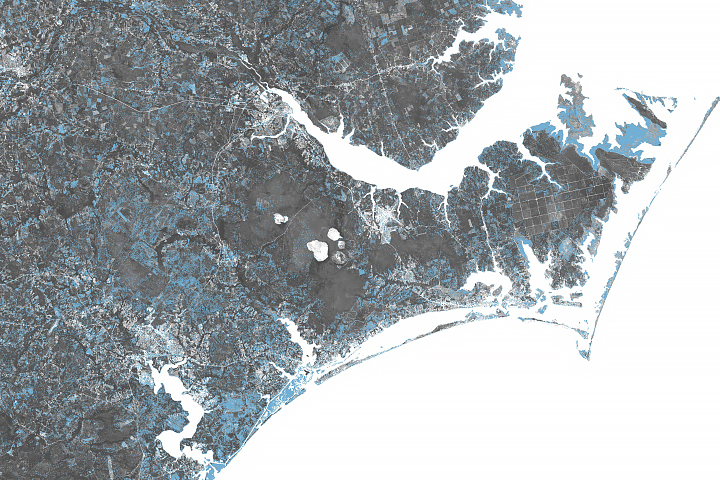
The flood proxy map above highlights areas that were likely to be flooded (indicated in blue) by Hurricane Florence, showing the flooding hazard on September 14. The map is derived from Synthetic Aperture Radar (SAR) data from the Copernicus Sentinel-1 satellites, operated by the European Space Agency (ESA). The radar can gather data through clouds, which often obscure the view for other types of spaceborne sensors. The flood proxy maps were generated by the Advanced Rapid Imaging and Analysis (ARIA) team, a joint collaboration between NASA's Jet Propulsion Laboratory and California Institute of Technology.
“What we’re looking at is brightness change in the radar image,” said Sang-Ho Yun, disaster response lead for the ARIA team based at the Jet Propulsion Laboratory. “If the ground surface is replaced with smooth water surface, which is what happens during a flood, the changes in brightness are quite significant.” Trees and buildings sticking out in the water can also change the brightness.
This map, along with several other products, have been shared with FEMA and the National Guard to help estimate the number of houses, people, and locations affected by the flood, said Andrew Molthan, NASA research meteorologist and one of the agency's coordinators for the disasters program. Molthan has been assisting at the FEMA offices this week to lend remote sensing and meteorological expertise, while learning about the agency’s geospatial needs during a major disaster.
NASA Earth Observatory images by Joshua Stevens and Lauren Dauphin, using soil moisture data courtesy of JPL and the SMAP Science Team, IMERG data from the Global Precipitation Mission (GPM) at NASA/GSFC, and modified Copernicus Sentinel data (2018), processed by ESA and analyzed by the NASA-JPL/Caltech ARIA team. Story by Kasha Patel.