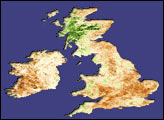
A prolonged heatwave in northern Europe created havoc in the summer of 2018. Sweden was blazing with uncharacteristic wildfires; swaths of the United Kingdom turned brown; and Germany endured a summer-long drought. Now, experts say the prolonged hot and dry conditions affected this year's European wheat production, influencing global wheat prices.
“This is a pretty bad year for crop conditions as far as Europe is concerned,” said Brian Barker, a geospatial scientist at University of Maryland. "In Germany, the Czech Republic, Norway, and Lithuania, crop yields have significantly dropped and are in poor condition— and prices do not respond well to drought.”But exactly how much will the price change?
Barker is one of several researchers from the Group on Earth Observations Global Agricultural Monitoring (GEOGLAM) initiative, working to bring satellite data to the economics community in order to better anticipate crop prices. At the end of every month, Barker gathers information from close to 35 different partners and 150 to 200 different sources to assess crop conditions in 28 countries that are the world's leading producers, consumers, and exporters of wheat, maize (corn), rice, and soybeans. The results and analysis are published on the GEOGLAM Crop Monitor, one of several initiatives in a NASA-funded program called Harvest. Led by the University of Maryland, Harvest is working with NASA's Food Security Office and the broader international GEOGLAM community to increase the use of satellite data in decision-making related to food security and agriculture.
“There is a huge potential in the uptake and use of satellite data in improving our ability to better anticipate crop yields,” said Inbal Becker-Reshef, who leads the GEOGLAM Crop Monitor initiative. “In my ideal world, at the national level you have ministries of agriculture that are using satellite data to look at crop conditions and help inform their policies. We are advancing the message of how they can use satellite information.”
More satellite information is readily available (particularly on the Web) than even a few years ago, said Becker-Reshef. The Crop Monitor includes data from NASA satellites and partner agencies on temperature anomalies, precipitation anomalies, soil moisture anomalies, and the evaporative stress index. Satellite data are often paired with similar observations from the ground.
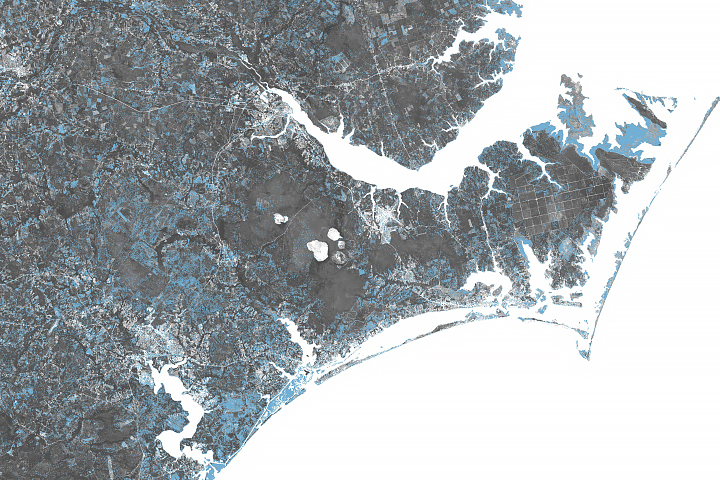
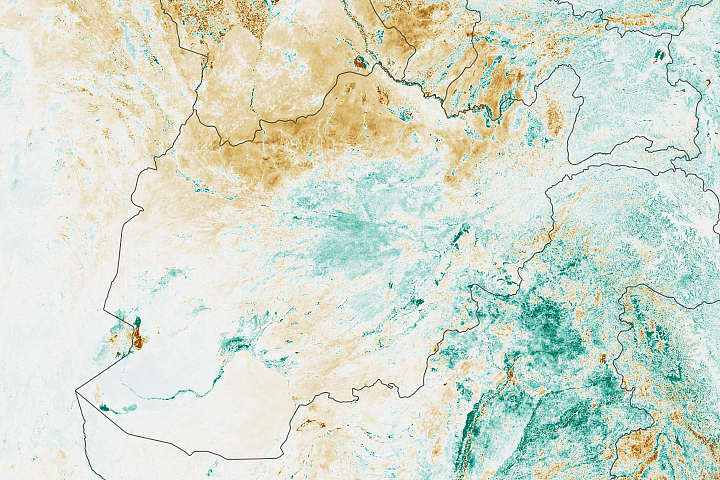
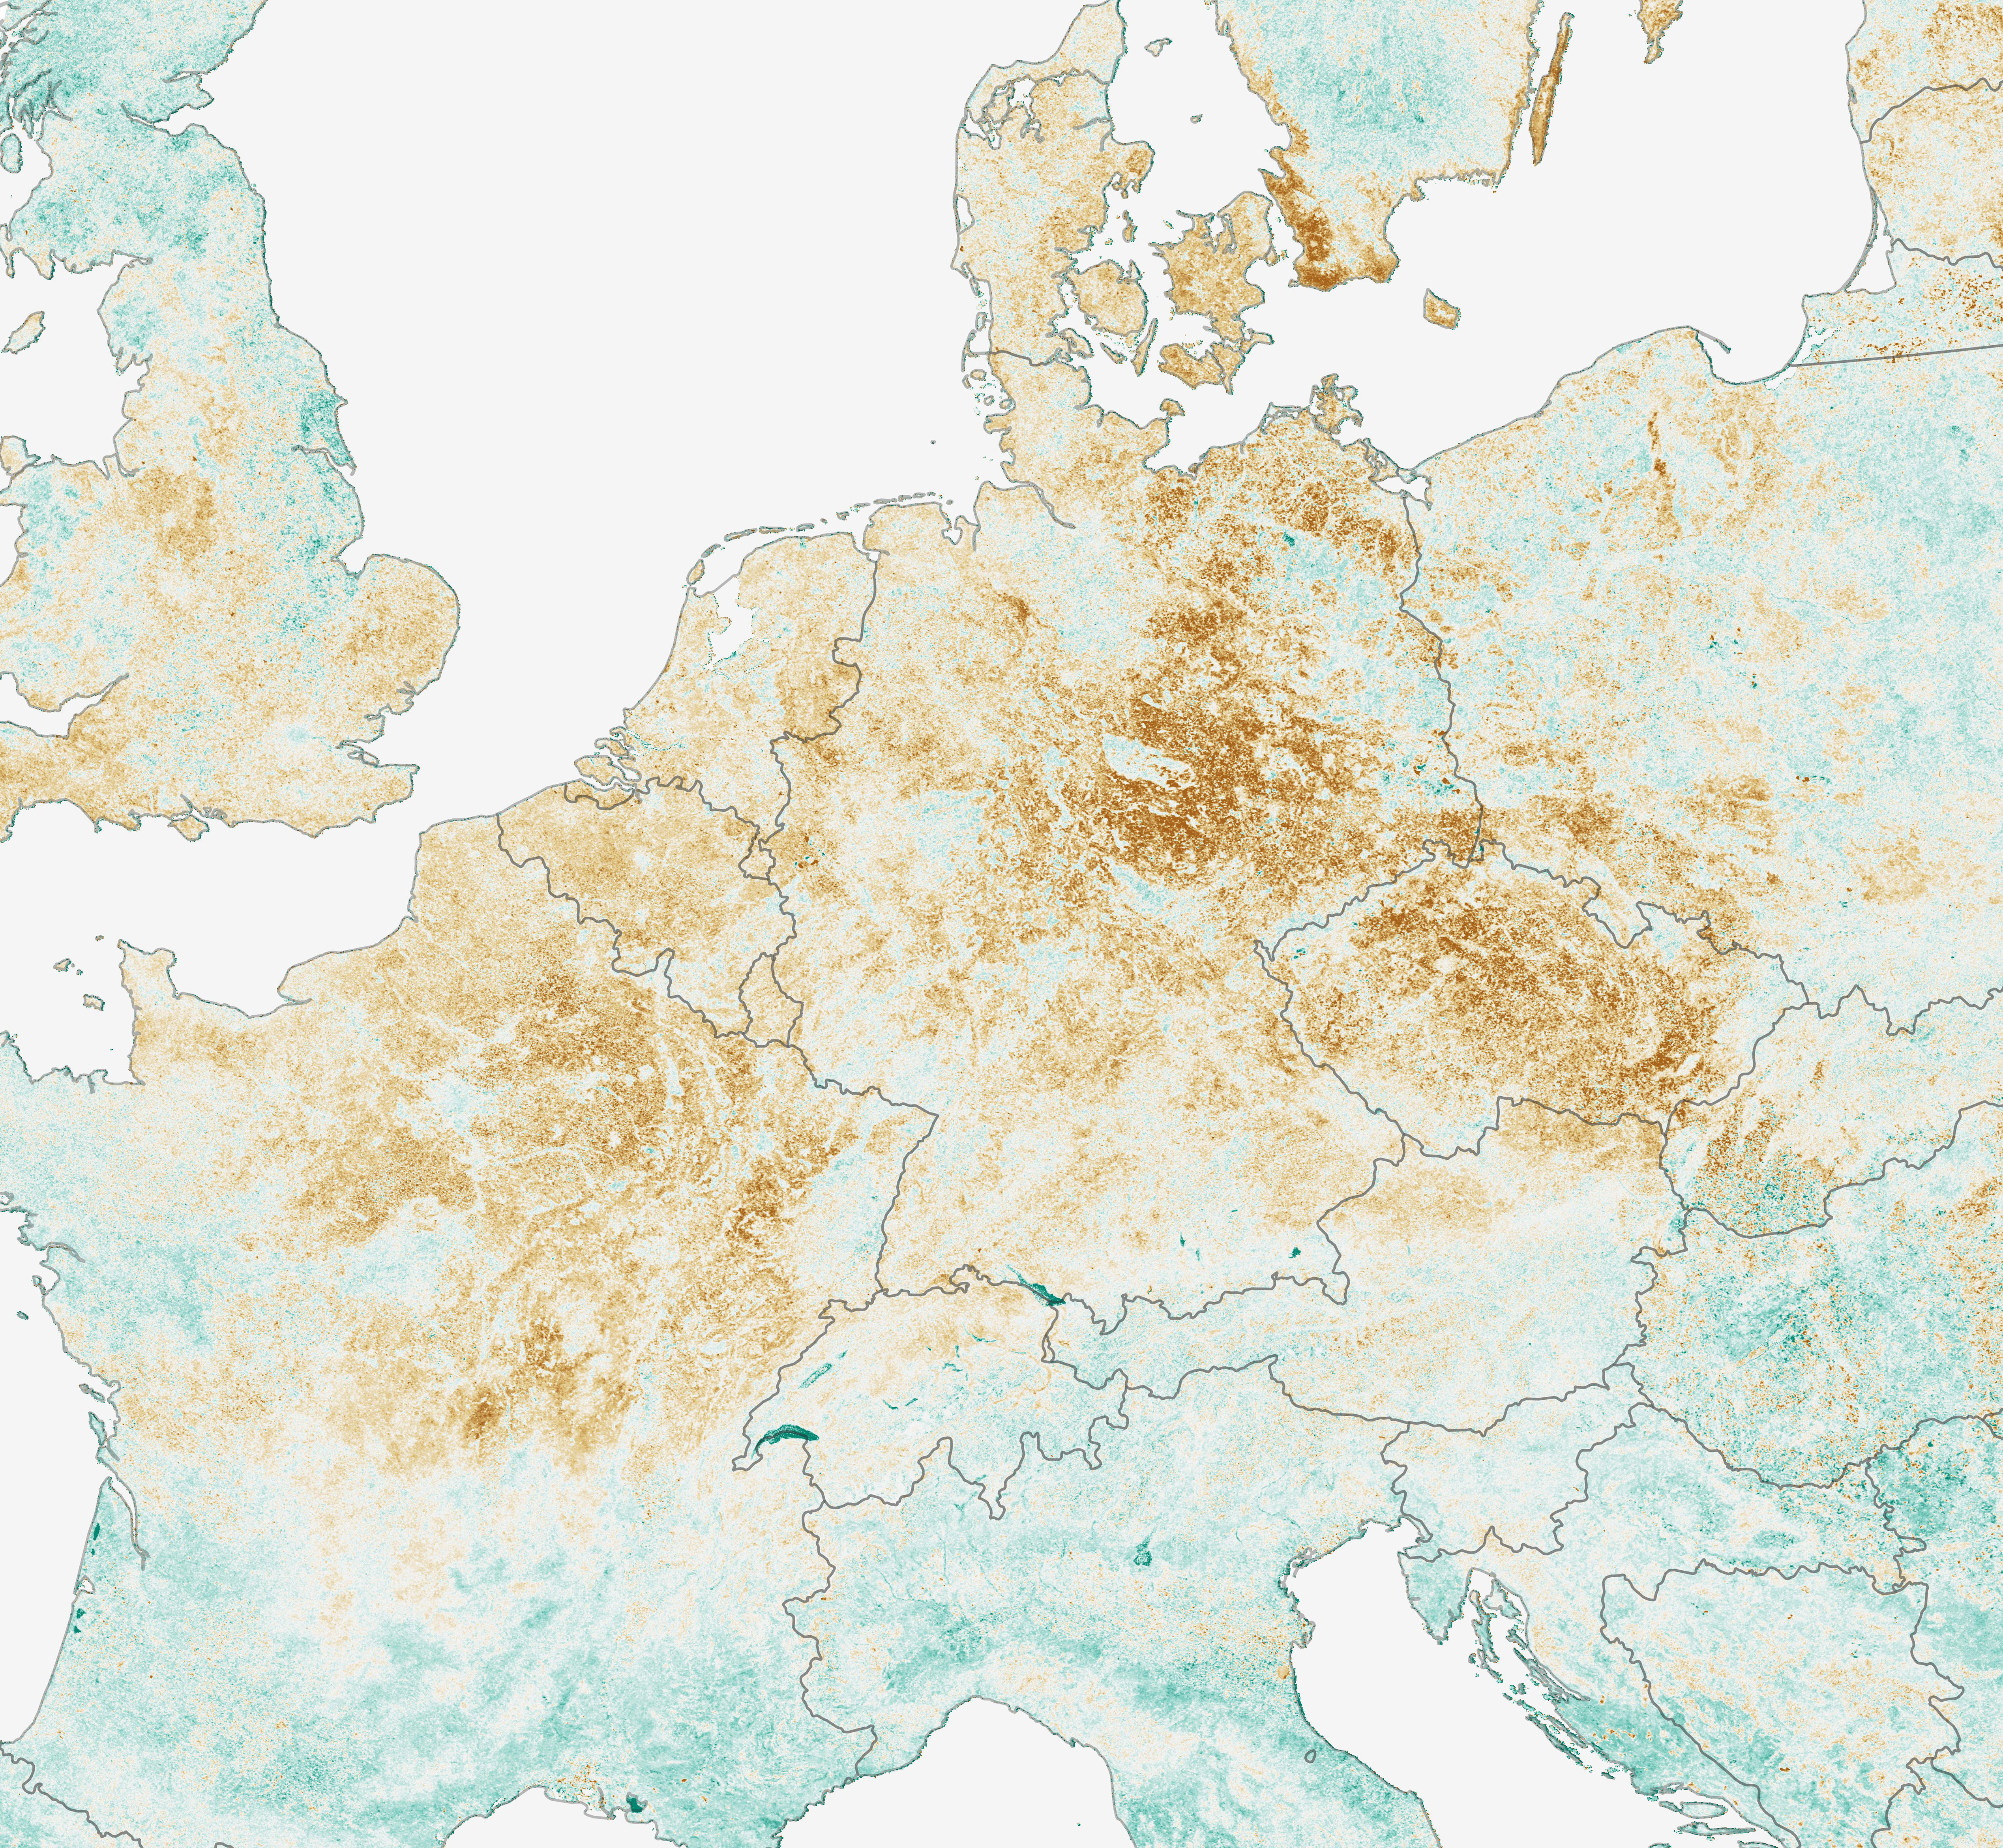
The map above shows the Normalized Difference Vegetation Index (NDVI) anomaly, one of several satellite-derived products that the Crop Monitor uses to assess crop conditions, in northern Europe. NDVI measures the health, or “greenness,” of vegetation based on how much red and near-infrared light the leaves reflect. Healthy vegetation reflects more infrared light and less visible light than stressed vegetation. The data was provided by Moderate Resolution Imaging Spectroradiometer (MODIS) on NASA's Terra satellite.
For the summer of 2018, the Crop Monitor closely examined conditions for winter wheat, which is usually harvested in the summer. Conditions in much of the European Union were “poor” this summer, meaning the crop yield is expected to be 10 percent or more below average and not likely to bounce back. This information is shared with the Agricultural Market Information System (AMIS), an independent agency that provides a timely market report called the Market Monitor available to the public.
“Market supply is led by crop production, and production is led by the weather,” said Abdolreza Abbassian, secretary for AMIS and a senior economist for the UN Food and Agriculture Organization. Satellite imagery can help assess environmental conditions in a more timely and accurate manner than reports or anecdotal evidence from farmers and help economists reduce the uncertainty in crop forecasting.
Becker-Reshef added, “Let's say a forecast says Germany will produce a certain amount of wheat, but then the country produces 10 percent less: You don't want volatility in your forecast because that translates into more volatility in markets.” For producers, price volatility creates large income fluctuations and makes future planning difficult. It also lowers food security for consumers, causing people to reduce consumption or switch to cheaper, unhealthier food.
Since the heatwave struck Europe at the end of the winter wheat season, the numbers for the forecasted crop yield have progressively been coming down. Consequently, prices of milling wheat in France rose to three-year highs in early August, according to the New York Stock Exchange-Euronext prices.
While the winter wheat harvest has ended in northern Europe, the Crop Monitor is now looking at maize (corn), which was planted in the spring. The monitoring program has classified corn conditions to be “poor” in France, Germany, and Poland, which rely on rainfall that has been sparse this summer.
NASA Earth Observatory map by Lauren Dauphin, using MODIS data from LANCE/EOSDIS Rapid Response. Story by Kasha Patel.