The GEOGLAM Crop Monitor for Early Warning provides science-driven alerts for countries that may be in danger of low crop yields.
Published Oct 5, 2018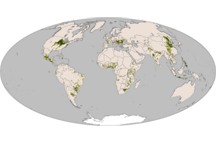
Native to America, corn is now a staple in diets around the world. This map shows the global distribution of corn in 2000.
Published Nov 25, 2010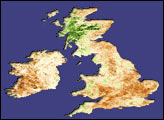
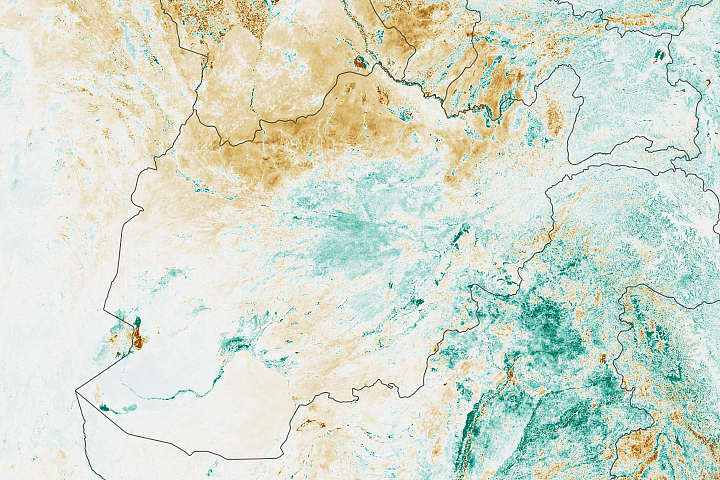
A vegetation index image shows areas of above-average crop growth in northern Afghanistan, following beneficial rains in March and April 2009.
Published Jun 12, 2009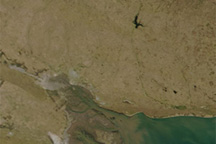
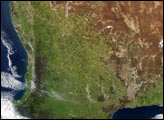
This pair of natural-color (photo-like) images from the Moderate Resolution Imaging Spectroradiometer (MODIS) on NASA’s Terra satellite contrasts 2009 conditions in southern Buenos Aires province with the conditions in 2008, a more normal year.
Published Feb 24, 2009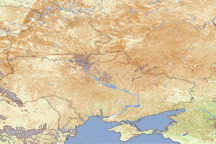
Under the one-two punch of a dry fall and a frigid winter, winter crops in Ukraine were in poor condition in April and May 2006. This vegetation anomaly (difference from normal) image was created from data collected by MODIS. Widespread brown indicates that plants throughout the region had grown less compared to the average growth for 2000-2005. The Foreign Agricultural Service, a division of the U.S. Department of Agriculture, estimated that only 10 metric tons of winter wheat, the primary crop growing here, would be harvested in July and August. That figure was down about 46 percent from the 18.7 metric tons harvested in 2005.
Published May 25, 2006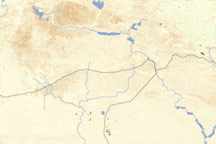
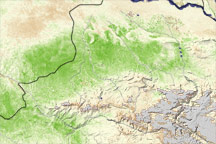
These vegetation maps show the impact of yellow rust, a fungus infection, on plants in Syria, Turkey, and Iraq in the spring of 2010.
Published Jul 3, 2010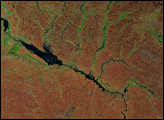
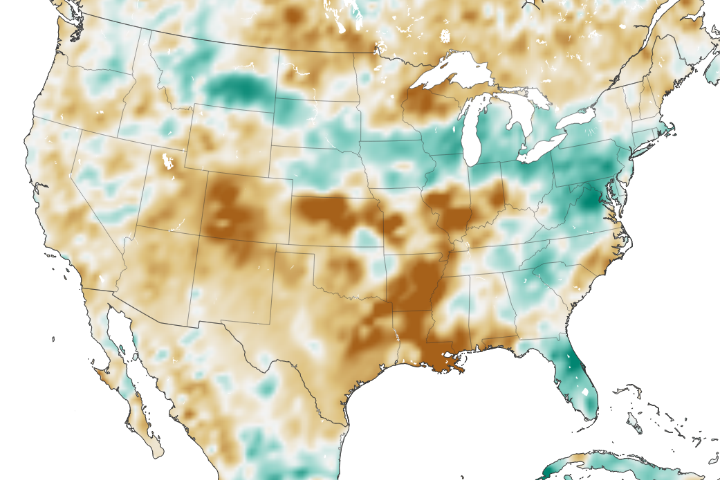
The amount of water contained in the top few centimeters of soil is small on a global scale, but it is critical for agriculture analysts trying to monitor commodity production and humanitarian need.
Published Jun 2, 2018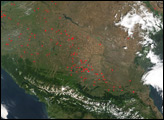
alert message
