Landsat imagery has become a staple of the Earth observation community. By acquiring as many as 1,400 new images a day, Landsat 7 and 8 have given us an unprecedented look at our planet. But it’s not just the quantity of the imagery that is so exciting. Within each scene, a trove of data awaits those eager to explore the planet, pixel-by-pixel, from the vantage point of space.
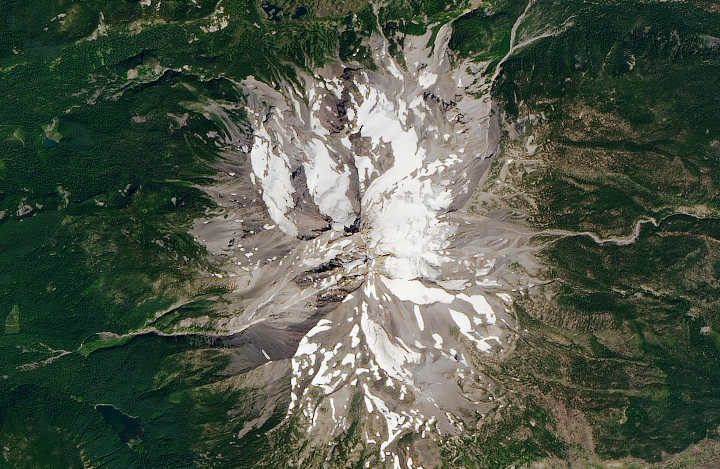
A true-color Landsat 8 image of Mount Jefferson, Oregon, at a resolution of 15 meters per pixel.
It’s almost like having your own camera in orbit, 700 kilometers (430 miles) above the Earth. But Landsat is quite different from the camera in your mobile phone or dSLR. The sensors onboard Landsat capture imagery in several different “bands.” Each band represents a unique chunk of the electromagnetic spectrum, defined by wavelength. This allows for multispectral imagery that goes beyond the visible light our eyes can see. It also enables us to combine these bands in order to see the unseen, make important calculations, or assemble just the data from visible light to produce a natural-color image.
But there’s another great feature of the different bands in Landsat 7 and 8 data: one of them can be used to effectively double the resolution of your image. Yes, you read that correctly!
Panchromatic sharpening (pan-sharpening) is a technique that combines the high-resolution detail from a panchromatic band with the lower-resolution color information of other bands (usually only the visible bands).
The spectral bands of Landsat 7 and 8 have a resolution of 30 meters per pixel, while the panchromatic band has a resolution of 15 meters per pixel. By itself, the panchromatic band would look somewhat uninteresting; like other individual bands, it appears black and white. But unlike other bands, it captures a much wider range of light, allowing it to be significantly sharper. As a result, panchromatic imagery is twice as detailed as the individual spectral bands.
An image that is twice as detailed is a lot more valuable and can reveal features or phenomena that would otherwise be difficult to see:
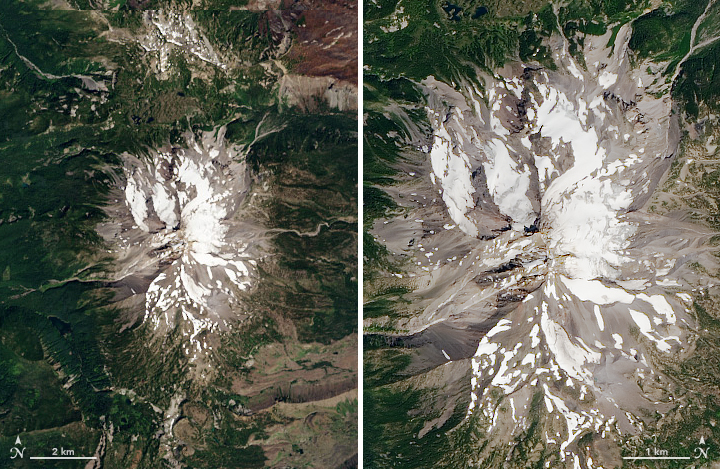
Left: a natural-color Landsat 8 image of Mt. Jefferson, by Robert Simmon. Right: A pan-sharpened version of the same data, by Joshua Stevens.
The first step in creating a pan-sharpened image is to acquire the data. If you need help, we have an Earth Explorer tutorial that will guide you through the process. You may also use this sample data of Mt. Jefferson (960 MB zip archive).
The following steps assume you have acquired and unzipped the necessary data. You will also need an image editor capable of working with 16-bit data, the ability to combine and edit color channels, and support for the Lab color space. Adobe Photoshop and GIMP, a free and open source editor, are both great tools that meet this criteria.
I use Photoshop, and the examples below will reflect the Photoshop tools and interface.
Follow the first part of Rob Simmon’s tutorial, How To Make a True-Color Landsat 8 Image, but stop after the initial RGB image is created. Do not color correct the image!
1. At this point, you should have a single, uncorrected RGB composite. Mine looks like this:

This unsharpened image will have a height and width in the ballpark of 7000 to 8000 pixels.
2. To prepare the image to be twice as sharp, we first need to double its size. In the Photoshop menu, go to Image and then Image Size. In the dialog, set the height and width to 200% and ensure that resampling is set to bilinear (this will prevent any unwanted, extra sharpening from occurring).
Your image will now be twice as large (15000-16000 pixels wide and tall). But you will notice it is not very sharp; in fact, it will look quite fuzzy. Let’s change that.
3. Recall that the panchromatic band has a resolution of 15 m in black and white. What if we could use the color from this fuzzy image, but add detail from the lightness and darkness of the panchromatic data? That is exactly what we are going to do.
Currently, our image is composed of three channels: red, green, and blue. We want to change that so one of the channels reflects lightness.
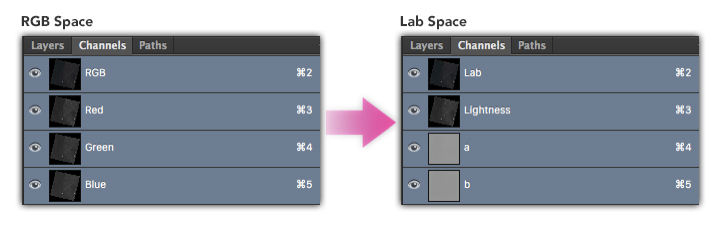
That is where the Lab color space comes in. Lab color space depicts color in terms of lightness and two other channels known as a and b (which control the red-green and yellow-blue of an image, respectively).
In the Photoshop menu, go to Image –> Mode -> Lab Color. You won’t see the image change, but if you look at your image channels, you will see that you now have Lightness, a, and b.
4. We need to replace the image in the Lightness channel with the panchromatic data. Open your panchromatic band (the filename should end with _B8.tif in your data).
5. With the panchromatic image open, select everything (Photoshop menu Select -> All). Then copy the image (cmd-c on Mac, ctrl-c on Windows).
Go back to your RGB composite image. In the Channels window click on Lightness to isolate that channel. Your image should change to black and white to indicate that only the selected channel is active:
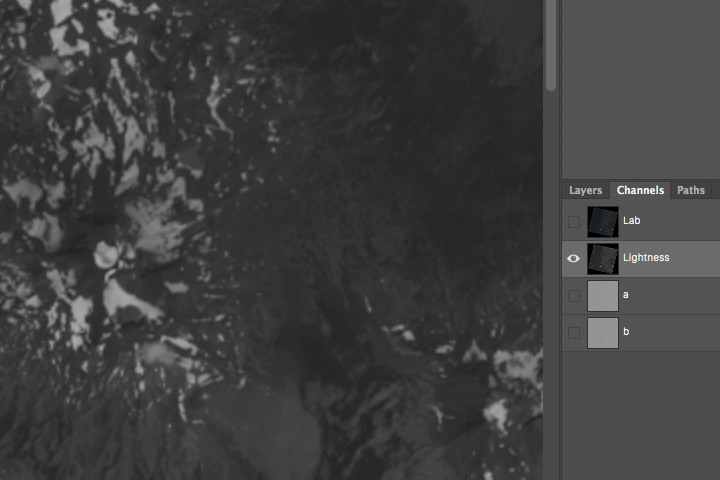
Paste the panchromatic data (cmd-v on Mac, ctrl-v on Windows). You should see the black and white image become significantly sharper as the higher resolution imagery replaces the previous data:

6. Convert the image back to RGB space. In Photoshop go to Image -> Mode -> RGB Color.
Color has returned and you now have a pan-sharpened, RGB composite!
You can now color correct the image and apply any additional sharpening desired.
Return to How To Make a True-Color Landsat 8 Image to learn how to color correct your pan-sharpened imagery.
Pan-sharpening is a common technique, and there’s more than one way to do it. The method shown here is called HSV Sharpening. It is the simplest of the techniques and relies only on swapping the value (the ‘v’ of HSV) data with a higher resolution counterpart. The hue and saturation (the ‘h’ and ‘s’) provide the color from the lower resolution imagery.
Another more sophisticated method known as Gram-Schmidt pan-sharpening is frequently used in GIS software. Gram-Schmidt generates a closer representation of the panchromatic data by simulating it from the other spectral bands.
On Landsat 8, the panchromatic band doesn’t go as far into the blue wavelengths as the blue band, and it goes slightly beyond red. If you followed this tutorial and noticed a slight change in tone when you pasted in the panchromatic data, this is why. Panchromatic data from Landsat 7 is even more extreme and includes more near infrared light, so it will change the tone of the image even more.
A third technique, known as a Brovey transform, or color normalization, attempts to balance the color information with the panchromatic data. It can be useful for pan-sharpening false color imagery, the success of which depends on the wavelengths captured by the panchromatic data.
Although this tutorial covered the process on a single image manually, much of this can be automated from the command line with relative ease. A few tools I recommend:
There you have it. Happy sharpening!
