From Wisconsin to Washington D.C., pollen counts were quite high this spring, making seasonal allergies brutal for many people. Recent research shows that changes in the onset of spring—both early and late—can extend allergy misery and lead to more severe asthma for some people.
Warm springtime temperatures signal shrub buds to burst, trees to leaf-out, and flowers to bloom. As plants produce and release pollen, our bodies can mistakenly identify it as a dangerous intruder to our respiratory systems. Our immune systems produce chemicals to fight it, inducing sneezing, watery eyes, and stuffy noses. Research also shows allergenic pollen is also among the leading risk factors known to worsen asthma.
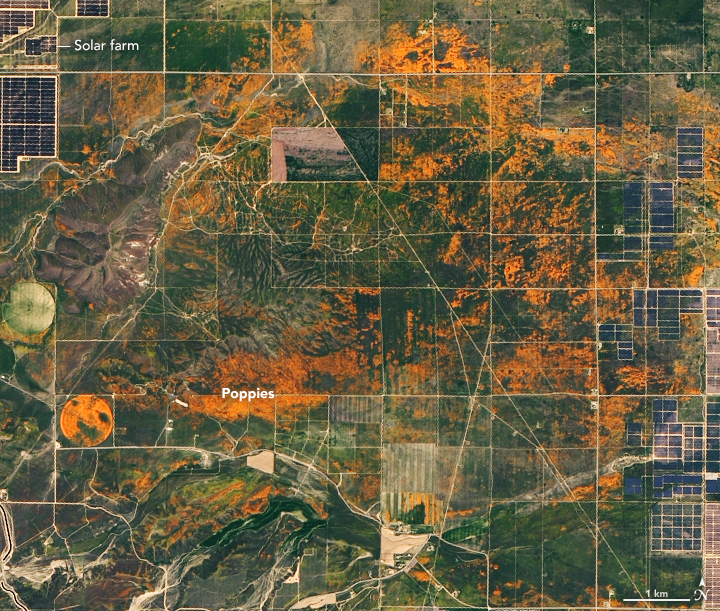
Amir Sapkota, a professor of public health at the University of Maryland, and his colleagues investigated how changes in the timing of spring onset affected asthma hospitalizations in Maryland over the past decade. The team used the Normalized Difference Vegetation Index (NDVI), which shows the relative “greenness” of vegetation, to determine the timing of the spring onset. (The data come from the Moderate Resolution Imaging Spectroradiometer (MODIS) on NASA’s Aqua and Terra satellites.) The team combined the satellite data with pollen counts and inpatient hospital admissions from the Maryland Department of Health.
They found that very early onset of spring (10 days early) was associated with a 17 percent increase in asthma hospitalizations in Maryland from 2001-2012, while late onset (3 days later) was associated with a 7 percent increase.
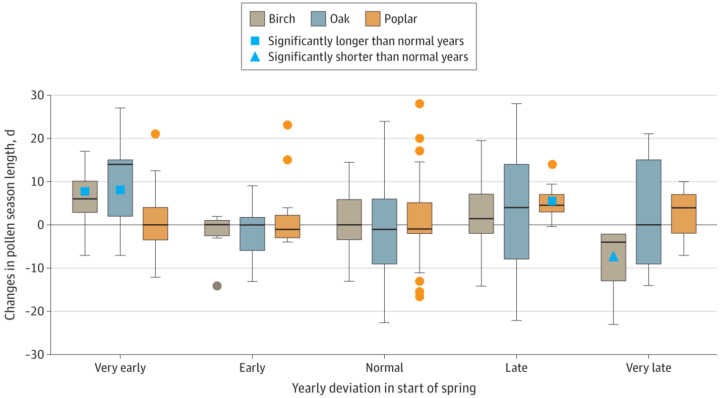
Sapkota explained that the hospitalization risk increased because of changes in pollen dynamics. Tree pollen is common in spring, while grass and weed pollen are more common during summer and fall. According to Sapkota, an early onset of spring leads to earlier and longer tree pollen seasons. At the other end, late onset causes different species of trees to bloom at the same time, thus increasing overall pollen levels in the environment. Both scenarios can lead to increases in asthma hospitalizations.
“As you take this constant drumbeat of new information and research in, remember that this virus is new to science and people have only just started studying it. Doing high-quality, definitive science takes time, sometimes a long time. The appetite for answers is understandably intense, but we also have to try to balance that hunger with patience.”
– Benjamin Zaitchik, a Johns Hopkins University researcher working to understand whether environmental factors are affecting the spread of coronavirus.
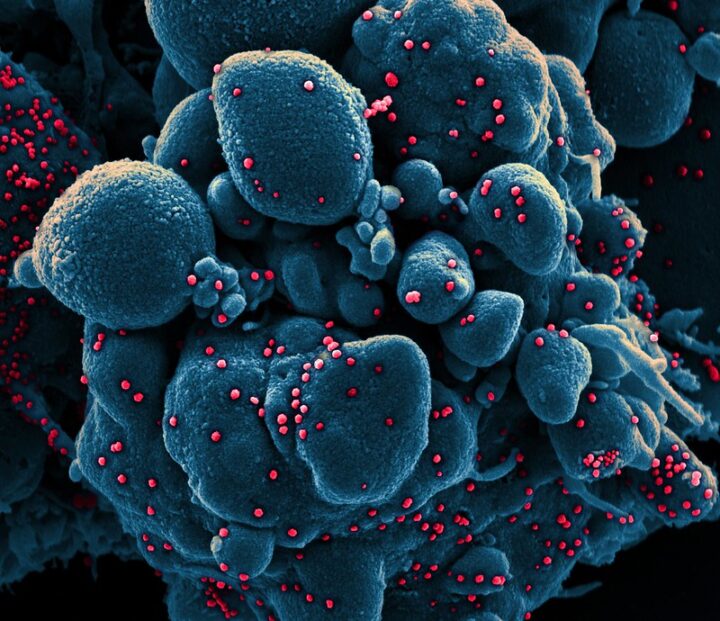
Ever since a new and deadly strain of coronavirus (SARS-CoV-2) emerged in China and then spread around the world, the virus has upended life in many countries. Scientists at NASA and other institutions have hustled to track and make sense of our new reality with every tool and technique at their disposal, including satellite data.
As several comprehensive NASA-funded research projects get started, here is a quick roundup of some of the more interesting satellite-related findings about the science of coronavirus and its effects on the environment.

Much of the news about the new coronavirus is grim, but observations of air quality offer a breath of fresh air. Several satellite sensors have detected drops in air pollutants — including nitrogen dioxide, carbon monoxide, and fine particles — following restrictions on travel and economic activity. Teams of scientists have spotted changes in China, Europe, the U.S. Northeast and Southeast, and India.
Look here for some tips on how to find and visualize changes in nitrogen dioxide, one of the gases that most clearly shows the effects of quarantines and economic shutdowns. Also, look here for nitrogen dioxide data for cities all around the world. But beware: As University of Georgia meteorologist Marshall Shepherd has pointed out, clouds and rain can create confusing changes in nitrogen dioxide that have nothing to do coronavirus restrictions.
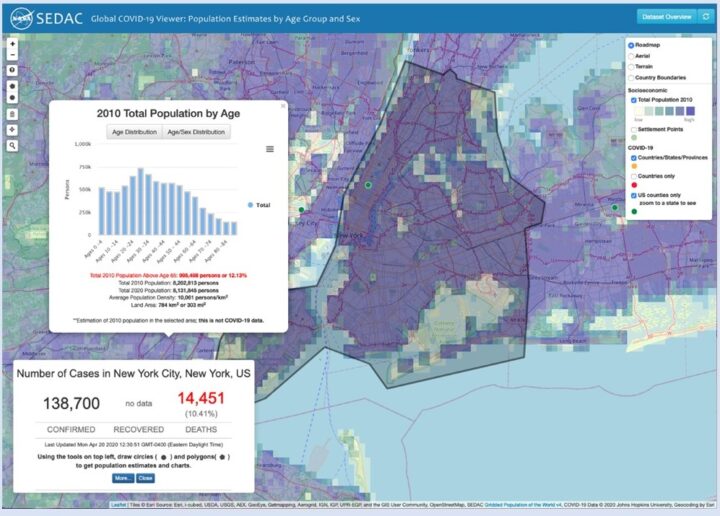
Given how much the virus has changed daily life, many of us find ourselves turning into armchair epidemiologists, trying to make sense of how the virus is spreading and what it means for our local area. If you are interested in taking a close look at new data as it comes in, this simple-to-use mapping tool from NASA’s Socioeconomic Data and Applications Center (SEDAC) might be of interest. It features demographic data, along with regularly updated information on reported global cases of the novel coronavirus (COVID-19). There is a short user guide here.
One of the key unknowns about the new coronavirus is whether environmental conditions — such as temperature, humidity, and exposure to ultraviolet light — have any effect on how the virus spreads or on the severity of the symptoms. NASA-funded researchers are starting to investigate this in several ways, while others are using NASA data in their models and analyses.
Some controlled laboratory research has suggested that exposure to warm air may make it more difficult for the virus to survive and spread. That has led many researchers around the world to start analyzing epidemiological and meteorological data to see if certain environmental factors have a significant impact on the virus in the real world. At this point it is too early to say, declared the National Academy of Sciences in a report on April 7, 2020, but the research continues.
Billions of people are facing something that NASA astronauts have plenty of experience with—living in social isolation for long periods with just a few other people. Here are some tips from astronaut Anne McClain and psychologist Tom Williams.
In February, we showed a drop in nitrogen dioxide (NO2) levels over China as a result of the coronavirus quarantine. New data from the European Space Agency (ESA) now show drops in NO2 concentrations over Italy due to that country’s nationwide lockdown. The change is particularly evident in the Pro Valley of northern Italy.
The video above shows NO2 levels across Europe from January 1 to March 11, 2020. These data come from ESA’s Tropospheric Monitoring Instrument (TROPOMI) onboard the Copernicus Sentinel-5P satellite. NO2 is a noxious gas emitted by motor vehicles, power plants, and industrial facilities.
ESA stated: “Although there could be slight variations in the data due to cloud cover and changing weather, we are very confident that the reduction in emissions that we can see coincides with the lockdown in Italy causing less traffic and industrial activities.”
Read more here…
For more information on NASA’s long-term measurements of nitrogen dioxide, please see this page.
The coronavirus (COVID-19) epidemic is first and foremost an issue of human health and safety. But as people have changed their everyday behaviors and patterns to contain or avoid the virus, there have been some subtle effects on the environment. There also has been misinformation. Below are four ways the virus is—and is not—affecting the environment in China.
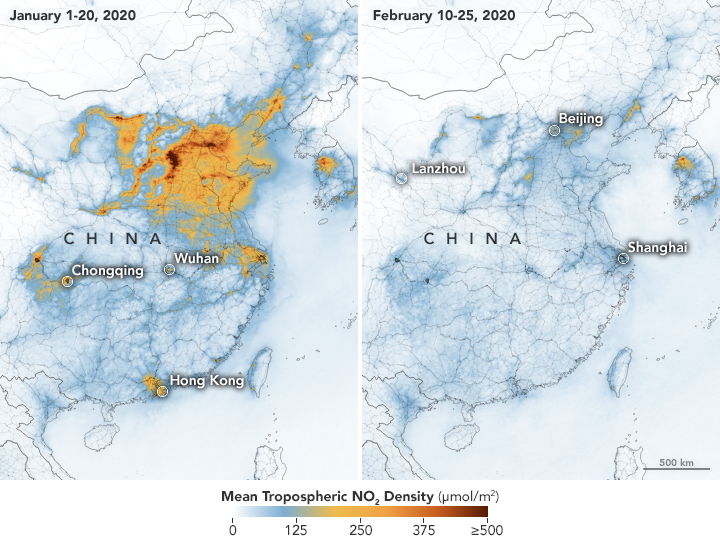
On February 28, we reported how decreases in industrial, transportation, and business activity since the coronavirus outbreak had reduced levels of atmospheric nitrogen dioxide (NO2) over China. But researchers note that a measurable change in one pollutant does not necessarily mean air quality is suddenly healthy across the country.
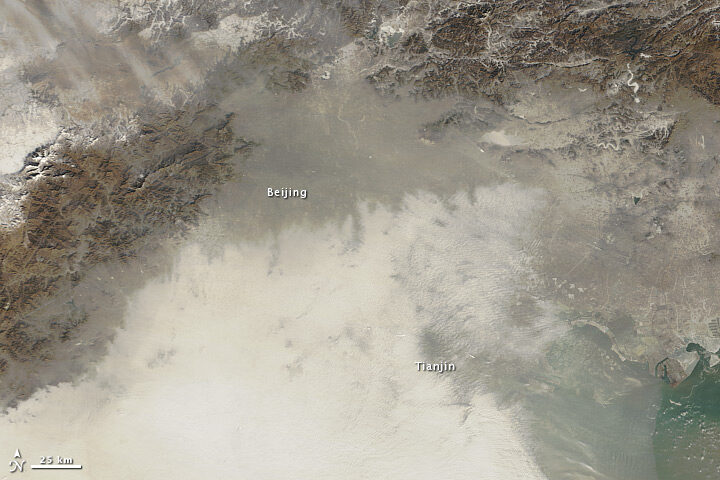
In February, news outlets reported unhealthy air pollution in Beijing, which was largely affected by airborne particulate pollution known as PM 2.5. As reported in the South China Morning Post, “weak winds, high humidity and a strong thermal inversion had trapped bad air in the city.” NASA satellites also showed a high load of airborne aerosols. Measurements of aerosol optical depth depict how the abundance of natural or manmade particles in the air prevents light from traveling through the atmosphere to the ground.
Beyond aerosol emissions, weather also plays an important role in determining air quality. NASA/USRA researcher Fei Liu notes that wind patterns and the height of the planetary boundary layer — the lowest layer of the troposphere near Earth’s surface — are important meteorological factors. Planetary boundary layer height influences how air pollution mixes vertically in the atmosphere. If the height of the boundary layer is high, then air pollutants can move higher into the atmosphere and concentrations will be lower near the ground (and vice versa). Liu and her colleagues are currently studying how changes in such meteorological factors may have influenced the decrease in NO2 before and during the quarantine.
For more information on NASA’s long-term measurements of nitrogen dioxide, please see this page.
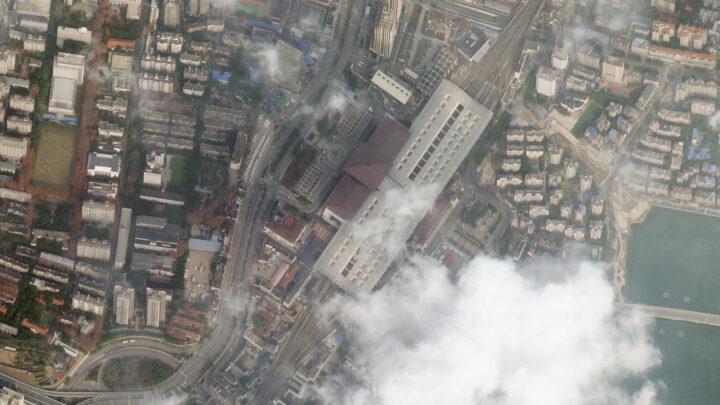
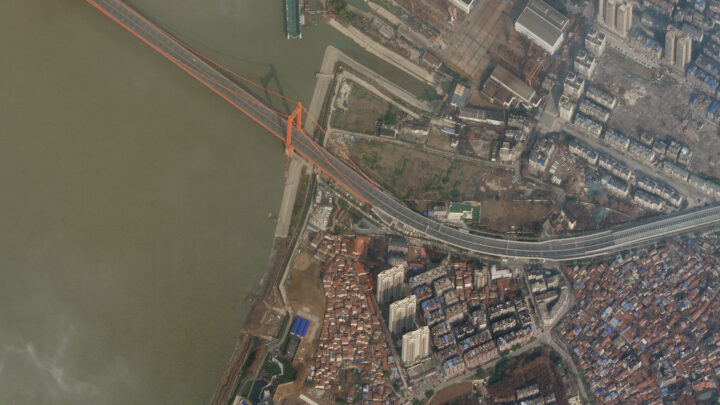
It is no surprise that road traffic in China’s major cities has been lighter, as many people have been forced to stay home and public transportation has been shut down. Satellite imagery from Planet Labs captured scenes of reduced traffic and empty parking lots near the Wuhan train station and airport. Trains stopped running around January 22, when the first quarantines began. And compared to late January 2019, domestic flights within mainland China this year dropped by 60 to 70 percent.
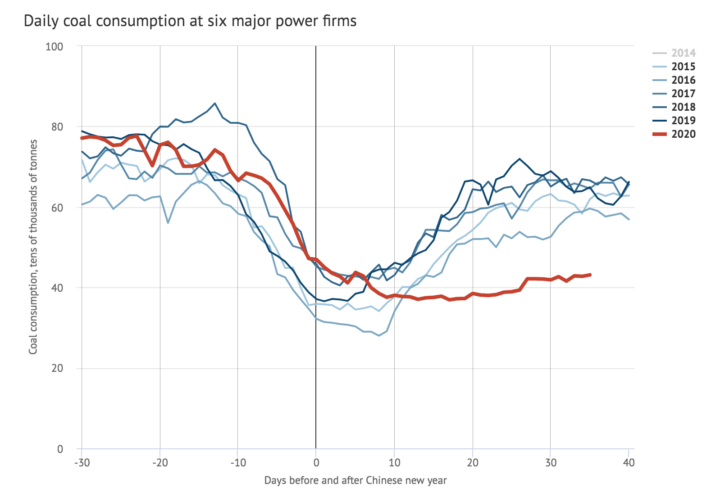
A report in Carbon Brief stated that key industries in China were operating at much lower-than-normal levels during the quarantine. Oil refinery operations in Shandong province, for instance, were at their lowest since 2015. Average coal consumption at power plants also reached a four-year low. As a result, carbon dioxide (CO2) emissions were at least 25 percent lower in the two weeks following the Lunar New Year compared to 2019. However, that decrease in CO2 emissions for two weeks would only reduce annual totals by approximately 1 percent.
In February 2020, a map floating around on social media showed increased sulfur dioxide (SO2) concentrations near Wuhan. Some news outlets prematurely speculated that the elevated levels of SO2 were due to an increase in human cremation.
The data for the map came from NASA’s GEOS earth system model and were not based on real-time observations of SO2. NASA’s Arlindo da Silva explained that while the GEOS model assimilates many ground-based and satellite observations to constrain meteorological conditions such as winds, humidity, and temperature, it currently does not ingest any real-time observations of sulfur dioxide. In the model, the concentrations of SO2 are estimated from historical emissions sources that are transported around the globe by atmospheric circulation. Therefore, da Silva said, GEOS model simulations cannot account for variations in SO2 concentrations arising from a sudden change in human activity (like a quarantine). Essentially, the model output of enhanced SO2 was not completely reflecting reality in this case.
Secondly, as the writers at Snopes pointed out, sulfur dioxide is commonly associated with burning coal — not burning human corpses.
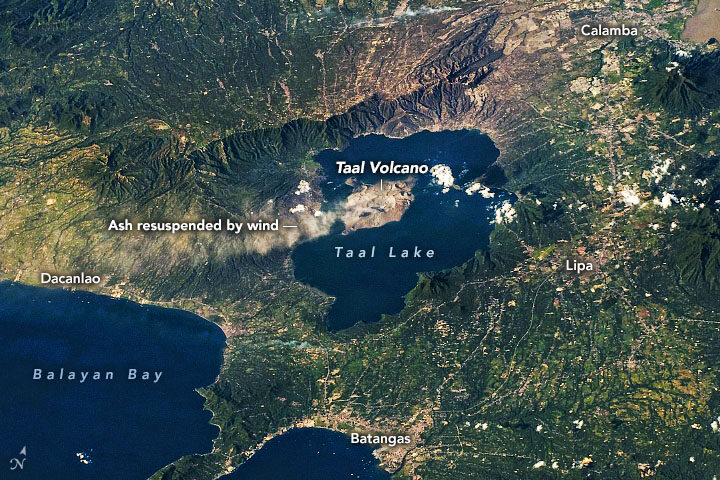
On January 12-13, 2020, Taal Volcano erupted for the first time in more than four decades. On January 22, ash plumes again emanated from Taal—but, this time, not from an eruption (seen above). According to the Philippine Institute of Volcanology and Seismology (PHIVOLCS), strong low-level winds lifted previously deposited ash lying around the volcano to heights of 5,800 meters (19,000 feet).
“Resuspension of volcanic ash is more likely at higher wind speeds, if the ash is dry and if ash particles are small,” said Simon Carn, volcanologist at Michigan Tech. “The ash deposits at Taal may have initially been quite wet, so the fact that ash resuspension is now occurring may indicate that the deposits have dried out.” The Philippines is currently in its dry season.
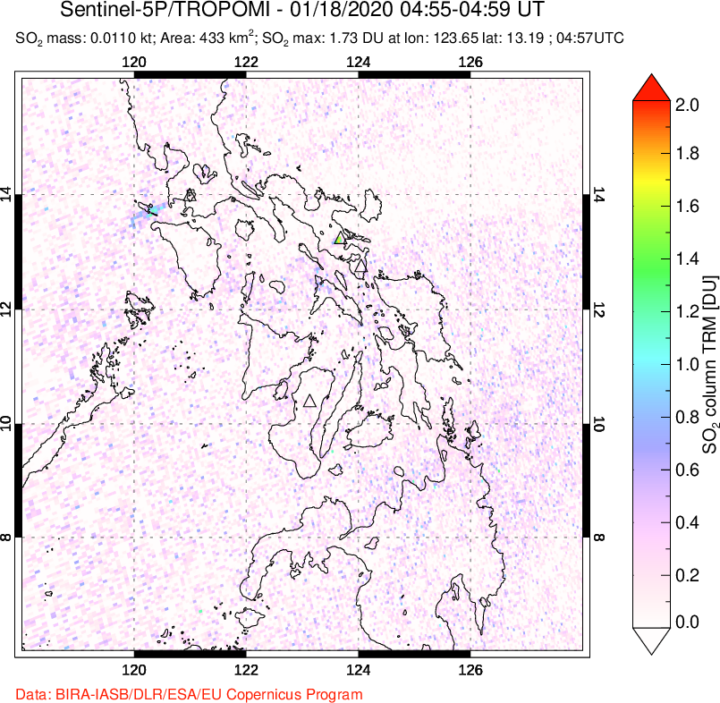
This time it was resuspended ash, but officials are cautious about a potential eruption again. Since its initial eruption, Taal remains on a level 4 alert, with a hazardous eruption still possible. Data show that SO₂ emissions, one of the key parameters for monitoring active volcanoes, have been present, but low, since the initial eruption. Carn said this indicates magma is most likely intruding into the main portion of the volcano, but predicting whether the magma will ultimately erupt is challenging.
If the volcano erupts again, it could look different than the early January event. During that “wet” eruption, water from the nearby crater lake covered the ash particles with water droplets. Wetter eruptions tend to produce finer ash particles. However, nearly all of the water in the main crater is now gone. According to Carn, the lake could have vaporized from the heat of the emanating magma; some could have been physically ejected by the previous eruption; and some could have drained through fractures or fissures in the volcano. In the absence of water, this volcano could produce a “dry” eruption, which would make comparatively larger ash particles.
NASA was mostly shut down for January 2019, but Earth wasn’t. In case you missed it, here are some of the big stories we didn’t cover during the impasse.
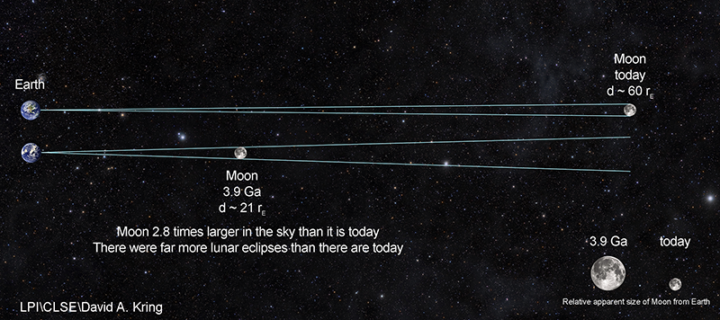
Scientists Find Evidence of An Ancient Earth Rock on the Moon
Four billion years ago, the Moon was about three times closer to Earth than it is now. So if a large asteroid or comet slammed into Earth and jettisoned material into space, it was more likely that rock fragments might end up landing on the Moon. That’s how an international team of scientists working with the Center for Lunar Science and Exploration (CLSE) think that a small fragment composed of quartz, feldspar, and zircon—a combination of minerals commonly found on Earth—ended up embedded within a larger Moon rock collected by Apollo astronauts. The team recently revealed evidence from the ancient rock fragment, suggesting that it is one of the oldest Earth rocks ever found.
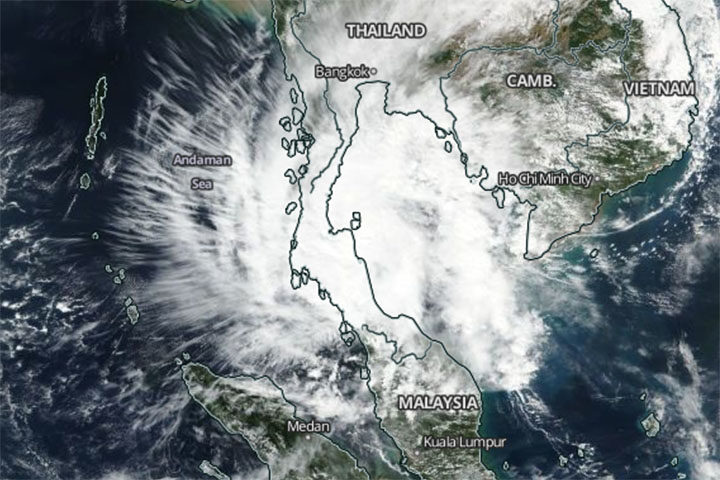
A Rare Typhoon Hits Thailand
It is rare for powerful tropical storms to strike Thailand. Before January 2019, the last time it happened was 1962. So meteorologists took notice when Tropical Storm Pabuk slammed into southern Thailand on January 4, 2019, packing sustained winds of 95 kilometers per hour (60 mph) and delivering torrential rains to some of Thailand’s most popular tourist destinations. The Moderate Resolution Imaging Spectroradiometer (MODIS) on NASA’s Aqua satellite captured this image of the storm on January 4, 2019.
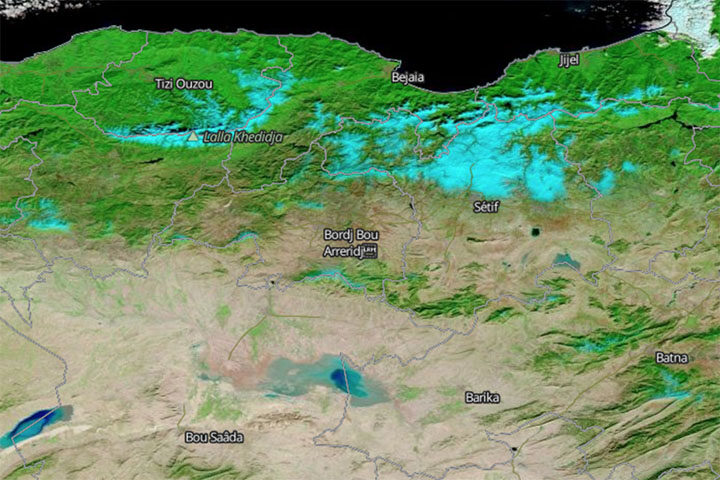
Snow Falls in Algeria (Yes, the Sahara)
In another unusual weather event, fresh snow created surreal scenery in Algeria when it coated Saharan desert dunes in mid-January. This is just the third time snow has fallen in Ain Sefra, the gateway to the Sahara Desert, in the past 37 years. (The last time was 2018.) The Moderate Resolution Imaging Spectroradiometer (MODIS) on NASA’s Terra satellite captured an image of the snow on January 14, 2019. It is composed with false color, using a combination of infraed and visible light (MODIS bands 7-2-1). Snow appears blue with this band combination.
China’s War on Particulates May Be Making Ozone Pollution Worse
For the past few years, China has advanced an ambitious plan to reduce emissions of fine particulate (PM2.5), a harmful type of air pollution. Authorities have restricted the number of vehicles on the roads, capped how much coal industries can burn, and shuttered many polluting factories and power plants. The result has been impressive: over five years, concentrations of PM2.5 in eastern China have fallen nearly 40 percent. But, there is another wrinkle. Particulates also sponge up substances that make it harder for ground-level ozone to form. So even as concentrations of PM2.5 decline, ozone concentrations are rising, new research shows.
Can Satellites Sense Poverty?
Increasingly, yes, at least in rural areas. By analyzing observations of villages in Kenya, one team of researchers recently showed that land use and land cover data from satellites contains some useful clues for identifying the poorest households in rural areas. Key indicators included: the size of buildings within a homestead, the amount of bare agricultural land adjacent to a homestead, and the length of the growing season. The researchers think this type of information could make it easier to monitor the progress of efforts designed to reduce poverty in rural areas, such as the U.N. Sustainable Development Goals.

Urban Heat Islands Come with a Cost
The urban heat island effect has been shown to raise the temperature of cities compared to their neighboring rural and semi-rural areas. Research published in May 2017 in Nature Climate Change spells out the cost associated the effect. Economists analyzed 1,692 cities and found that the economic cost of climate change this century could be 2.6 times larger when the heat island effect is accounted for. The costs stem from factors like air pollution, water quality, and energy for cooling.
CO2 Reached Record Highs
In April 2017, the concentration of carbon dioxide in the atmosphere reached (and surpassed) 410 parts per million (ppm) for the first time in recorded history. The milestone measurement was made at the Mauna Loa Observatory in Hawaii, a ground-based station that has collected CO2 data since 1958. (Global, space-based data now supplement those measurements and provide the big-picture view.)
Levels continued to rise, and by the end of May, the monthly average was the highest on record at 409.65 ppm. CO2 concentrations reach an annual peak every May, but the average in May 2017 was well above that of previous years. Check out this graph to see how 2017 has measured up.
Rainfall Reorg
Climate change is likely to affect Earth’s rainfall patterns. Authors of a recent study published in Science Advances used paleoclimate data to examine how rainfall patterns have responded to past climate shifts. These past trends lend evidence to scenarios that could unfold in the future. During the northern hemisphere’s summer, dry areas are likely to become drier and wet areas would be wetter; in the winter, regions of relatively heavy rainfall would expand northward.
Plants Pack a Punch on Precipitation
During photosynthesis, plants release water vapor into the air. This water vapor can ultimately cause clouds to form, which in turn can affect Earth’s energy balance and produce precipitation. A May 2017 study published in Nature Geoscience used global satellite data and a statistical technique to show that as much as 30 percent of the variability in climate and weather patterns can be attributed to plants.
“Hottest” Events on the Rise
Scientists have developed a framework to help determine if an extreme weather events can be attributed to climate change. Using the framework, they show that for 80 percent of areas where observations are available, global warming has increased the chances for (and severity of) “hottest” events—months and days that measure in as the hottest of the year. The research was published May 2017 in Proceedings of the National Academy of Sciences.
The DC-8’s four engines burned either JP-8 jet fuel or a 50-50 blend of JP-8 and renewable alternative fuel made from camelina plant oil. Credits: NASA/SSAI Edward Winstead
Taking Some of the Search Out of ‘Search and Rescue’
NASA engineers are developing prototypes of second-generation locator beacons. The little devices have been used by pilots, mariners, and hikers since the 1970s to relay distress signals in times of emergency. Until now, those beacons have had a 2-kilometer (1 mile) radius. The new beacons will pinpoint location within a 140-meter radius—that’s more than 10 times more precise.
Small Satellites Will Track Big Storms
Atlantic hurricane season has just begun—and the CYGNSS mission has it covered. The constellation of eight mini-satellites, launched into low-Earth orbit in December 2016, measures surface winds using GPS signals reflected from the ocean surface. The data will help track storms as they grow, giving forecasters a better sense of storm intensity.
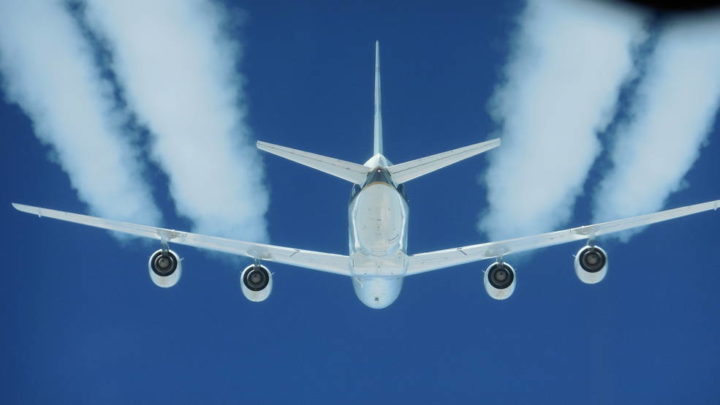
Cleaner Contrails?
Long a source of wonder (and occasional conspiracy theories), the white plumes that trail behind aircraft are a focus of study for NASA scientists testing the effects of biofuels. A new study shows that alternative fuels made from plant oils can cut down on particle emissions in jet exhaust by as much as 50 to 70 percent. From the news release:
Contrails are produced by hot aircraft engine exhaust mixing with the cold air that is typical at cruise altitudes several miles above Earth’s surface, and are composed primarily of water in the form of ice crystals…Researchers are most interested in persistent contrails because they create long-lasting, and sometimes extensive, clouds that would not normally form in the atmosphere, and are believed to be a factor in influencing Earth’s environment.
A Different Kind of Scat
Scientists have a new tool for measuring both ocean winds and water currents. Tested on airborne missions this spring, DopplerScatt is a cousin of QuickSCAT and RapidScat, which used a scatterometer to measure the “roughness” of the ocean surface and determine the direction and intensity of wind. DopplerScat adds a doppler radar to the package, allowing scientists to measure the speed and direction of the moving water. The instrument is another potential tool to measure currents along shipping routes or predict the direction that oils and other slicks might move.
In recognition of World Oceans Day (June 8) and this week’s UN Oceans Conference, here are some recent highlights from ocean science…
1.4 Million Pixels of Salt
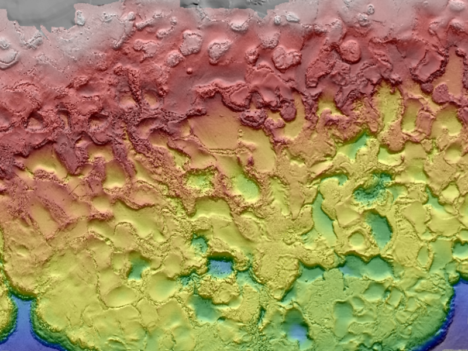
The Gulf of Mexico, like any sea, is rich in dissolved salts. Unlike most seas, the Gulf also sits atop a big mound of salt. Left behind by an ancient ocean, salt deposits lie beneath the Gulf seafloor and get pressed and squeezed and bulged by the heavy sediments laying on top of them. The result is pock-marked, almost lunar-looking seafloor. The many mounds and depressions came into clearer relief this spring with the release of a new seafloor bathymetry map compiled from oil and gas industry surveys and assembled by the U.S. Bureau of Ocean Energy Management.
3D Water Babies
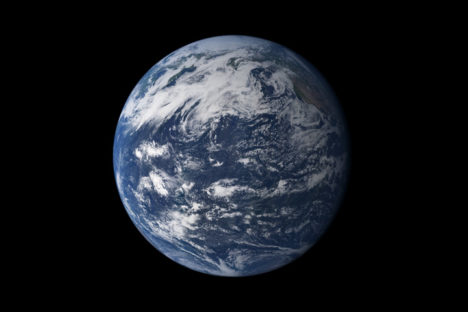
NASA’s Scientific Visualization Studio took a look back at conditions in the Pacific Ocean in 2015-16, which included the arrival and departure of both El Nino and La Nina. The 3D visualizations were derived from NASA’s Modern-Era Retrospective Analysis for Research and Applications (MERRA) dataset, a global climate modeling effort that is built from remote sensing data.
In other Nino news, a research team led by NASA Langley scientists found that the strong 2015-2016 El Niño lofted abnormal amounts of cloud ice and water vapor unusually high into the atmosphere, creating conditions similar to what could happen on a larger scale in a warming world.
Not the Kind of Brightening You Want to See
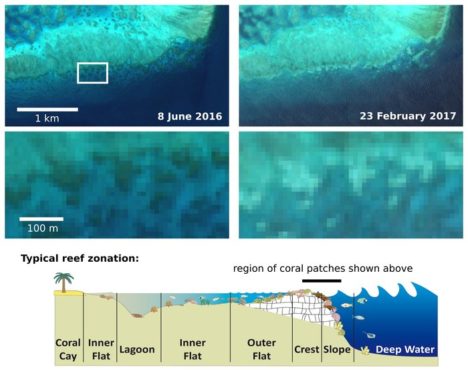
For past few years, warm ocean temperatures in the western Pacific Ocean have wrecked havoc on the Great Barrier Reef. Extreme water temperatures can disrupt the symbiotic partnership between corals and the algae that live inside their tissues. This leads the colorful algae to wash out of the coral, leaving them bright white in what scientists refer to as “bleaching” events. The health of coral reefs is usually monitored by airborne and diver-based surveys, but the European Space Agency recently reported that scientists have been able to use Sentinel 2 data to identify a bleaching event on the Great Barrier Reef. Such satellite monitoring could prove especially useful for monitoring reefs that are more remote and not as well studied as those around Australia.
Eyeing the Fuel for Hurricane Season
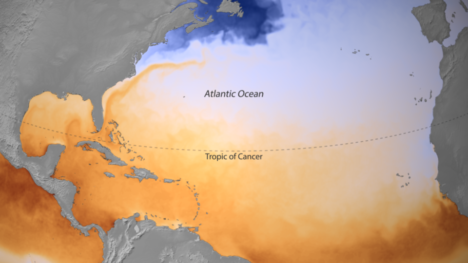
On June 1, the beginning of Atlantic Hurricane Season, the National Oceanic and Atmospheric Administration released a map of sea surface temperatures in the Caribbean, the Gulf of Mexico, and the tropical North Atlantic Ocean. The darkest orange areas indicate water temperatures of 26.5°C (80°F) and higher — the temperatures required for the formation and growth of hurricanes. Forecasters are expecting a hurricane season that is a bit more active than average.
(Finger)Prints of Tides
In a new comprehensive analysis published in Geophysical Research Letters, a French-led research team found that global mean sea level is rising 25 percent faster now than it did during the late 20th century. The increase is mostly due to increased melting of the Greenland Ice Sheet. A big part of the study was a reanalysis and recalibration of data acquired by satellites over the past 25 years, which are now better correlated to surface-based measurements. The study found that mean sea level has been increasing by 3 millimeters (0.1 inches) per year. The American Geophysical Union published a popular summary of the study.
Here’s a roundup of some of the latest Earth science news from NASA.
ANATOMY OF A TSUNAMI
When it comes to generating a tsunami, it’s not just the vertical movement of the seafloor that matters. Research performed in a giant tank showed that horizontal movement also contributes to the formation and strength of these potentially destructive waves. See the wave tank in the video below, and read more about the research here.
SPRING IS FOR FIELDWORK
Spring in the northern hemisphere can be a good time to hit the field for some ground- and air-based research. Among the myriad projects, NASA scientists are collecting atmospheric data atop a volcano in Hawaii and over the Mid-Atlantic area, and continuing airborne surveys of snow and ice over Earth’s arctic regions.
THE SKINNY ON GREENLAND’S THINNING GLACIERS
NASA data contributed to a study led by University of Texas researchers, which shows that the amount of ice lost by glaciers in Greenland depends on their shape. They found that the thick, wide parts of glaciers lose ice more easily than the thin, steep portions. Read more here.
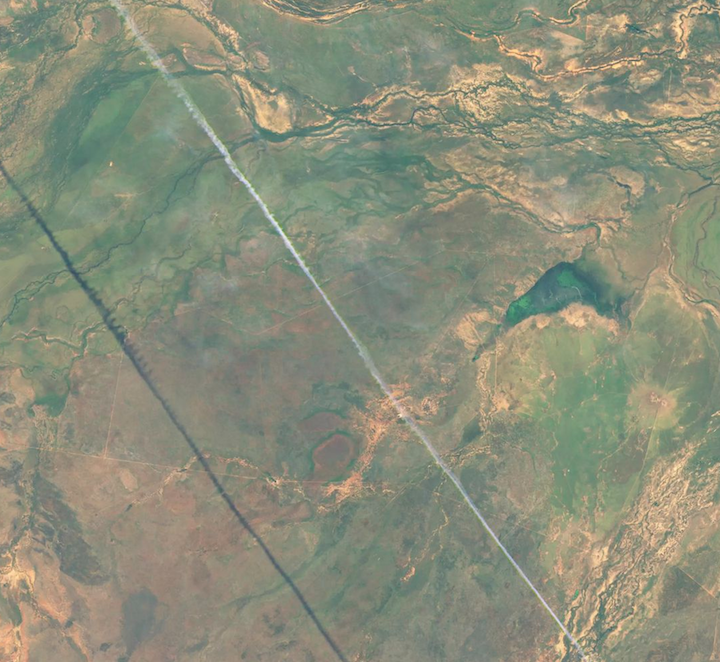
SATELLITE SEES A SOLITARY CONTRAIL
And last but not least, check out this image from Landsat 8 posted to Twitter by @andrewmiskelly. The scene shows a “solitary contrail” over western Queensland, Australia.
