Five decades ago, NASA and the U.S. Geological Society launched a satellite to monitor Earth’s landmasses. The Apollo era had given us our first look at Earth from space and inspired scientists to regularly collect images of our planet. The first Landsat — originally known as the Earth Resources Technology Satellite (ERTS) — rocketed into space in 1972. Today we are preparing to launch the ninth satellite in the series.
Each Landsat has improved our view of Earth, while providing a continuous record of how our home has evolved. We decided to examine the legacy of the Landsat program in a four-part series of videos narrated by actor Marc Evan Jackson (who played a Landsat scientist in the movie Kong: Skull Island). The series moves from the birth of the program to preparations for launching Landsat 9 and even into the future of these satellites.
Episode 1: Getting Off the Ground
The soon-to-be-launched Landsat 9 is the intellectual and technical successor to eight generations of Landsat missions. Episode 1 answers the “why?” questions. Why did space exploration between 1962 and 1972 lead to such a mission? Why did the leadership of several U.S. government agencies commit to it? Why did scientists come to see satellites as important to advancing earth science? In this episode, we are introduced to William Pecora and Stewart Udall, two men who propelled the project forward, as well as Virginia Norwood, who breathed life into new technology.
Episode 2: Designing for the Future
The early Landsat satellites carried a sensor that could “see” visible light, plus a little bit of near-infrared light. Newer Landsats, including the coming Landsat 9 mission, have two sensors: the Operational Land Imager (OLI) and the Thermal Infrared Sensor (TIRS). Together they observe in visible, near-infrared, shortwave-infrared, and thermal infrared wavelengths. By comparing observations of different wavelengths, scientists can identify algal blooms, storm damage, fire burn scars, the health of plants, and more.
Episode 2 takes us inside the spacecraft, showing how Landsat instruments collect carefully calibrated data. We are introduced to Matt Bromley, who studies water usage in the western United States, as well as Phil Dabney and Melody Djam, who have worked on designing and building Landsat 9. Together, they are making sure that Landsat continues to deliver data to help manage Earth’s precious resources.
Episode 3: More Than Just a Pretty Picture
The Landsat legacy includes five decades of observations, one of the longest continuous Earth data records in existence. The length of that record is crucial for studying change over time, from the growth of cities to the extension of irrigation in the desert, from insect damage to forests to plant regrowth after a volcanic eruption. Since 2008, that data has been free to the public. Anyone can download and use Landsat imagery for everything from scientific papers to crop maps to beautiful art.
Episode 3 explores the efforts of USGS to downlink and archive five decades of Landsat data. We introduce Mike O’Brien, who is on the receiving end of daily satellite downloads, as well as Kristi Kline, who works to make Landsat data available to users. Jeff Masek, the Landsat 9 project scientist at NASA, describes how free access to data has revolutionized what we are learning about our home planet.
Episode 4: Plays Well With Others
For the past 50 years, Landsat satellites have shown us Earth in unprecedented ways, but they haven’t operated in isolation. Landsat works in conjunction with other satellites from NASA, NOAA, and the European Space Agency, as well as private companies. It takes a combination of datasets to get a full picture of what’s happening on the surface of Earth.
In Episode 4, we are introduced to Danielle Rappaport, who combines audio recordings with Landsat data to measure biodiversity in rainforests. Jeff Masek also describes using Landsat and other data to understand depleted groundwater.
Learn more about the Landsat science team at NASA.
Learn more about the Landsat program at USGS.
View images in our Landsat gallery.
For more than 20 years, astronauts have been shooting photographs of Earth from the International Space Station. Before that, they looked down from Mercury, Gemini, Apollo, Skylab, the Space Shuttles, and MIR. They have brought us unique views of our home planet in all of its wonder, beauty, and ferocity. They have also made some interesting and timely science observations along the way.
More than 1,000 of those photos have been published here on NASA Earth Observatory. We would like you to help us choose the best in our archives. In early March, we will launch Tournament Earth: Astronaut Photography, and we want you to be part of the selection committee.
From now through February 19, 2021, search our archives and point out the best photos shot by the astronauts. Post the URLs of your favorite photos in the comments section below.
Please choose images from these collections:
EO Astronaut Photography Collection
Visible Earth: Astronaut Photography
Please note that there are 30+ pages of images to scroll through — an internet rabbit hole of incredible beauty.
In March 2021, we will include some of your selections in Tournament Earth, a head-to-head contest to vote for the best of the best from our archives. Each week, readers will pick from pairs of images as we narrow down the field from 32 nominees to one champion. The Tournament Earth champion will be announced in early April.
So get browsing and get choosing. Then post your favorite URLs in the comments section by February 19.
If you want to learn more about how and why astronauts shoot photos of our planet — and the special training involved — check out our video series “Picturing Earth.”
Astronaut Photography in Focus
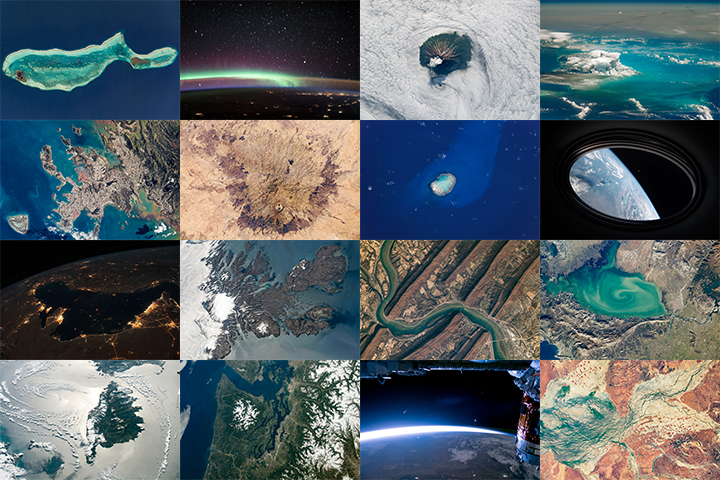
There have been two rounds of voting in Tournament Earth 2020, and two rounds of stunning upsets. Only two of the top eight seeds made it through. Night Lights? Snuffed out. Colorado River? Dried up. Caspian ice? Melted. Aerosols? Cleaned out. A river of tea? Gone cold. Dark side of the Moon? Someone broke the record. Iconic Earthrise? Didn’t make it to dawn.
Every time we run one of these tournaments, we are surprised by what catches the eyes of our readers. It is time to surprise us again. Cast your votes now in round three to pick the best four of the Earthly 8. Voting ends on April 13 at 9 a.m. U.S. Eastern Time. Check out the remaining competitors below.

In round 1, Ocean Sand garnered the most votes overall and wiped out #4 seed and 2014 champion El Hierro Submarine Eruption, winning by the largest margin of any pairing (81 to 19 percent). In round 2, Sand beat the #1 seed, The Dark Side and the Bright Side, by a 57 to 43 percent margin.
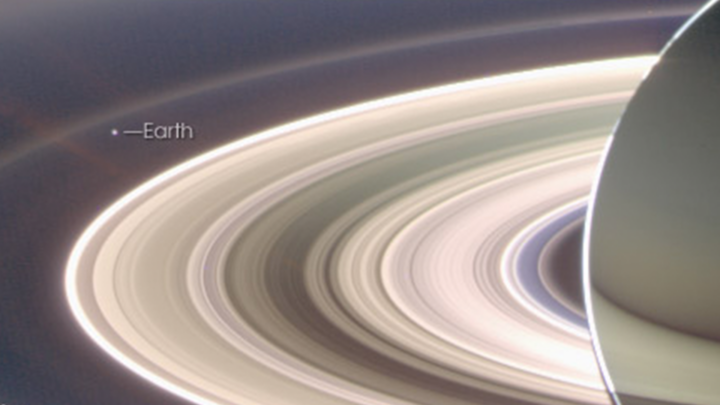
A View from Saturn garnered the second highest vote total in round 1, besting Blooming Baltic Sea by 77 to 23 percent. In the second round, Saturn beat Sensing Lightning from the Space Station, 60 to 40 percent. In case you didn’t notice, Earth is visible in that Saturn image.
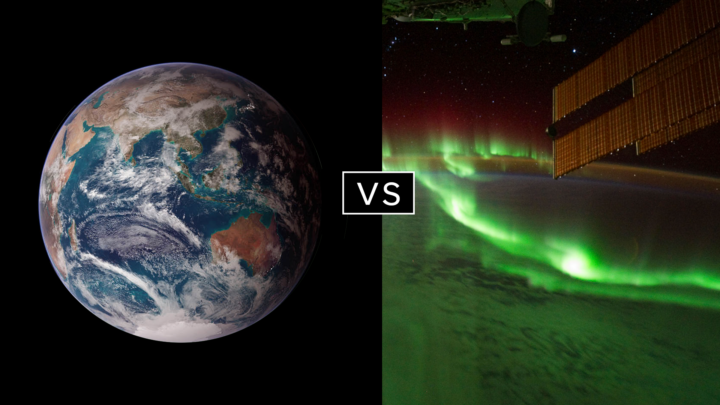
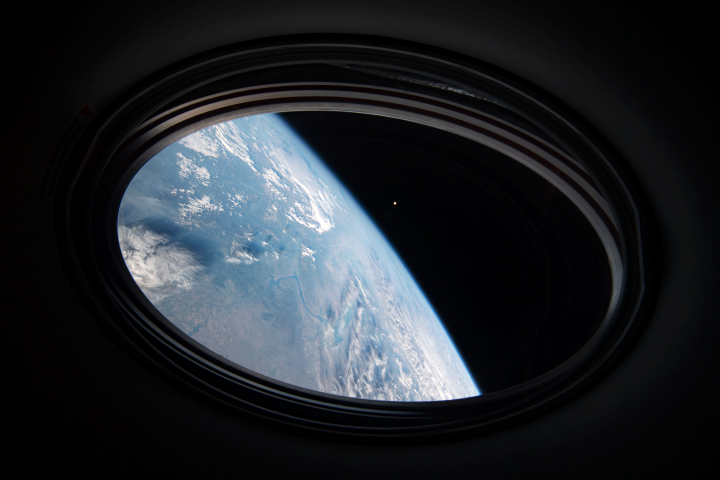
Twin Blue Marbles is the only #1 seed left in the tournament. In round 1, it captured 71 percent of the vote while besting Auroras Light Up the Antarctic Night. In round 2, Blue Marbles was the top overall vote getter and beat the iconic A Voyager Far from Home by 66 to 34 percent.
Fire in the Sky and On the Ground has pulled off two massive upsets. In round 1, it beat #2 seed Night Light Maps Open Up New Applications, 71 to 29 percent. In round 2, Fire beat the sentimental favorite and oldest image in Tournament Earth, All of You on the Good Earth — the original Blue Marble photo (1968) and the inspiration for the first Earth Day (1970). The voters chose the auroral fire over Apollo 8 fame by 57 to 43 percent.
This bracket pairs two low seeds that knocked off highly ranked opponents. #8 seed Where the Dunes End topped #1 A Curious Ensemble of Wonderful Features in round 1 (63 to 37 percent), then topped #4 Roiling Flows on Holuhraun Lava Field (56 to 44).
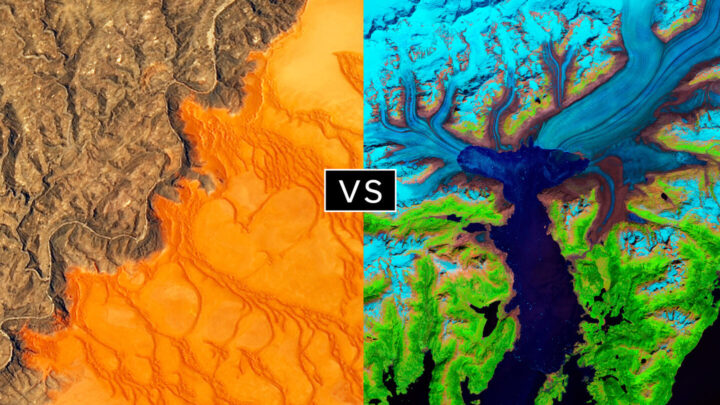
The false-color image Retreat of the Columbia Glacier got 57 percent of the vote to beat Icy Art in the Sanikov Strait in round 1. Round 2 was a close call: Columbia barely eclipsed Antartica Melts Under the Hottest Days on Record (51 to 49 percent).
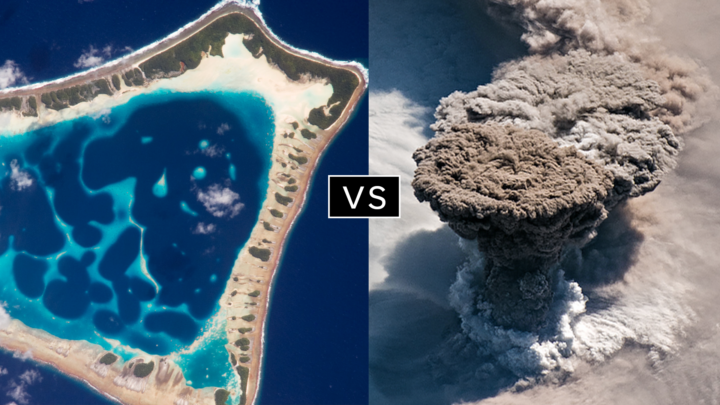
Another pair of Cinderella stories here. Atafu Atoll outclassed #1 seed Some Tea with Your River in round 1 by 75 to 25 percent. In round 2, it collected the second most votes overall, beating #5 Making Waves in the Andaman Sea 62 to 38 percent.
Raikoke erupted in round 1, collecting 72 percent of the vote while beating #3 Awesome, Frightening View of Hurricane Florence. In round 2, the volcanic plume smothered #2 Just Another Day on Aerosol Earth, 61 to 39 percent.
Since its launch on the web in April 1999, NASA Earth Observatory has published more than 15,500 image-driven stories about our planet. In celebration of our 20th anniversary — as well as the 50th anniversary of Earth Day — we want you to help us choose our all-time best image.
For now, we need you to help us brainstorm: what images or stories would you nominate as the best in the Earth Observatory collection? Do you go for the most beautiful and iconic view of our home? the most newsworthy? the most scientifically important? the most inspiring?
Search our site and then post the URLs of your favorite Earth images in the comments section below. Please send your ideas by March 17.

In late March 2020, we will include some of your selections in Tournament Earth, a head-to-head contest to vote for the best of the best from our archives. Each week, readers will pick from pairs of images as we narrow down the field from 32 nominees to one champion.
The all-time best Earth Observatory image will be announced on April 29, 2020, the end of our anniversary year.
If you want some inspiration as you begin your search, take a look at the galleries listed below. Or use our search tool (top left) to find your favorite places, images, and events.

Even after 50 years, the day of Apollo 11 Moon landing remains a vivid memory in many minds. But even generations that were not born before July 20, 1969, can appreciate the monumental achievement through numerous historical accounts, video, and photographs.
Inspection of EO’s 20-year archive turned up numerous occasions on which we have celebrated the Apollo program and the Moon—Earth’s only natural satellite. Below we highlight a few of our favorites. Still hungry for more Earth and Moon imagery? Check out our gallery “Earth From Afar.”
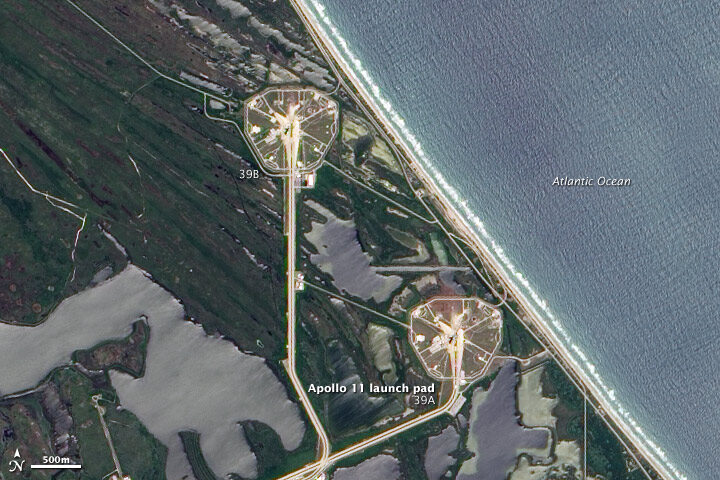
On July 16, 1969, Apollo 11 lifted off from launch pad 39A at Cape Canaveral, a headland along Florida’s Atlantic coast. Neil Armstrong, “Buzz” Aldrin, and Michael Collins began their journey to the Moon. On June 9, 2002, the Advanced Land Imager (ALI) on NASA’s Earth Observing-1 satellite captured this true-color image of launch pad 39A and neighboring pad 39B.
By launching from the east coast of Florida, NASA took advantage of both geography and physics. Rockets could aim eastward and fly over the Atlantic Ocean, far away from heavily populated areas should anything go wrong. And within the continental United States, Florida is closest to the Equator. Launching from a locality close to the Equator enables the rocket to harness Earth’s orbital energy to boost its own trajectory. Read more.
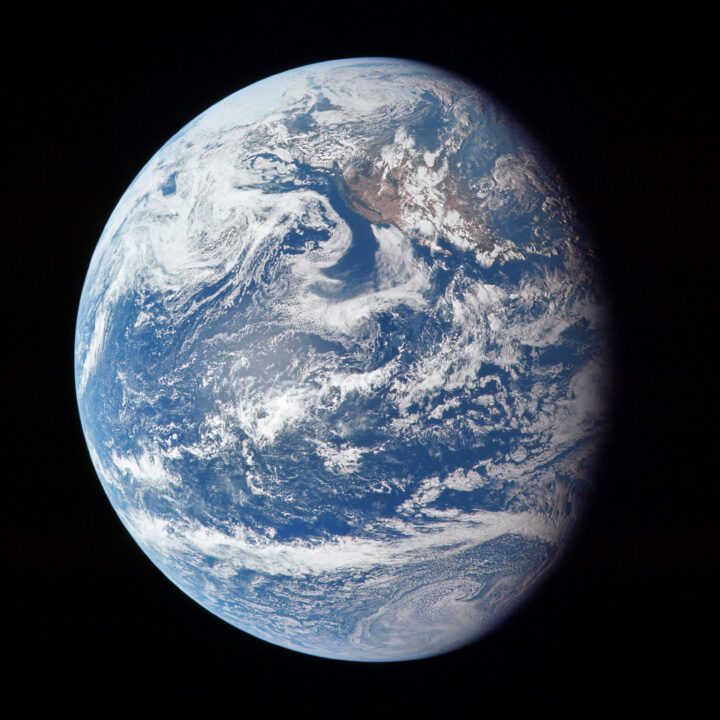
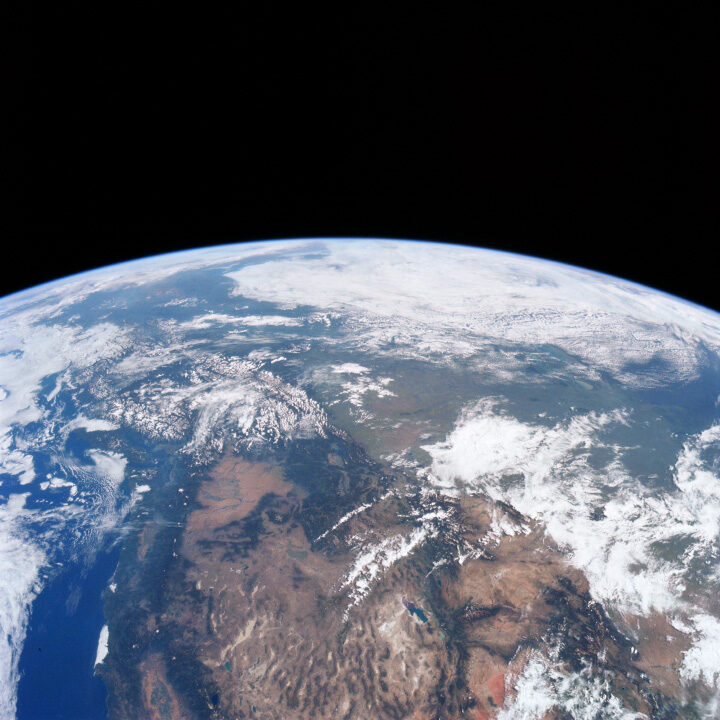
These two photographs were taken by the crew on their outbound journey from Earth to the Moon. Apollo 11 launched from Cape Canaveral at 9:32 a.m. on July 16, 1969, and these photos were captured that day. The top view shows the full disk of Earth, with bits of California, the Pacific Northwest coast, and Alaska peeking through the cloud cover in a scene otherwise dominated by the Pacific Ocean. The second, closer view shows more of the western United States and Canada, with the Rocky Mountains filling much of the center of the scene and the Arctic ice cap at the top. Read more.
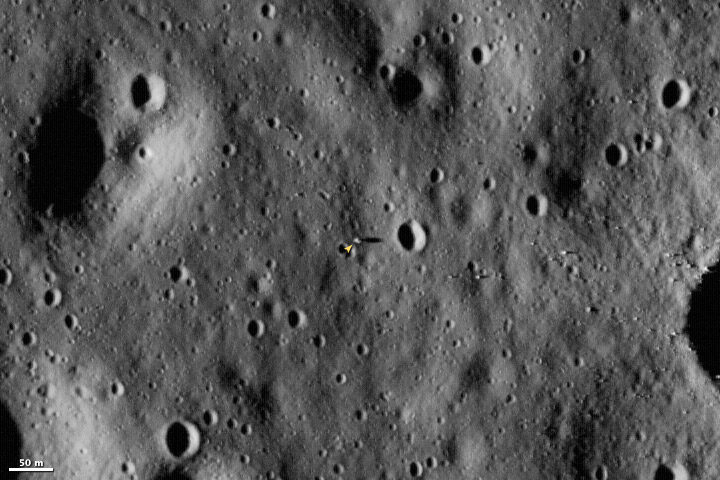
The Lunar Reconnaissance Orbiter launched on June 18, 2009, and began sending back images of the Moon on June 23. Launched to map the surface of the Moon, LRO was still moving towards its near-surface orbit when it acquired this image of the Apollo 11 landing site. When the orbiter reaches its final orbit, it will image the Moon’s surface at a resolution of 0.5 meters, providing an image that is about two times more detailed than the one shown here. Read more.
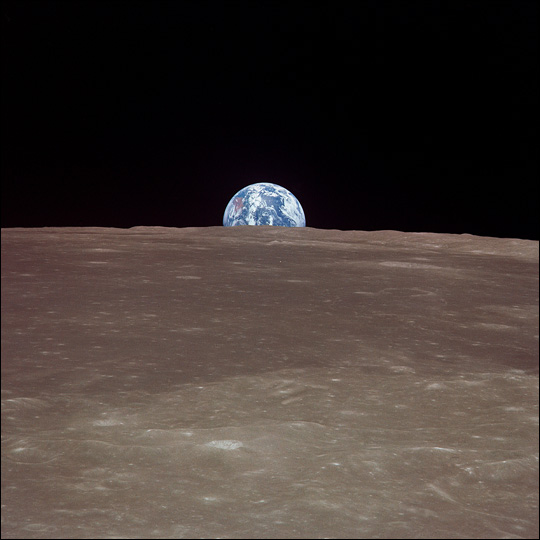
This image from Apollo 11 shows the Earth rising over the limb of the Moon much as the Harvest Moon does from our planetary perspective. Over the stark, scarred surface of the Moon, the Earth floats in the void of space, a watery jewel swathed in ribbons of clouds.
While the Harvest Moon has allowed humans throughout history to coax “just a little more” from the Earth’s bounty before the onset of winter, images of our home from the Moon helped raise awareness of the Earth as a rare (and perhaps unique) planetary ecosystem. The Apollo 11 images provided a global backdrop for the building U.S. environmental movement, including a surge of citizen-led environmental cleanups in the 1960s and 70s, and implementation of key national environmental policies. Read more.
If you are a fan of soccer (football), June has been an exciting month. Millions of people have been watching the 2019 Women’s World Cup in France, setting a record number for viewers. At least three of those spectators are watching from space.
Onboard the International Space Station, the astronauts have been able to watch from Node 2 as the 24 teams compete for the coveted international championship. Actually, ISS astronauts have 50 computers around the Space Station that can stream the tournament while they continue to work.
Or they can just look out the window.
It’s not the best seat in the house, as they are orbiting 250 miles (400 kilometers) above Earth’s surface. They are also moving at 17,500 miles per hour, so they only get about 5 minutes within sight of France.
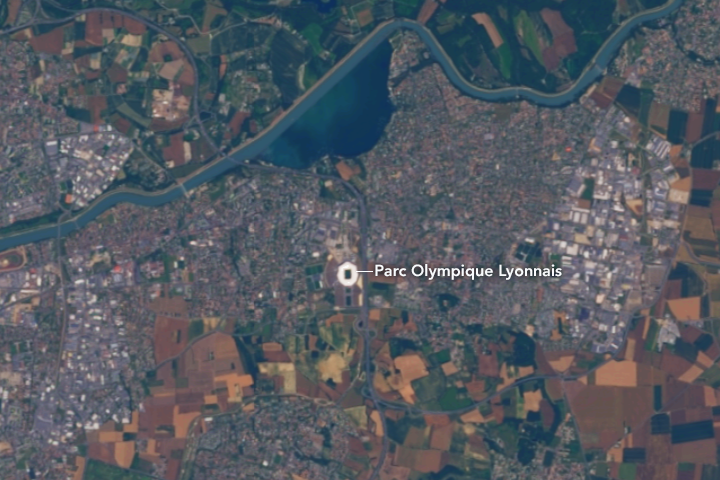
The Landsat 8 satellite caught a closer look at the action on June 29. The image below shows the Parc Olympique Lyonnais in Décines-Charpieu, France. The stadium fits almost 60,000 people and will host the semifinals and final game.
At the start of July 2, there were four teams still competing for the Cup: Sweden, the Netherlands, England, and the United States. We looked back into our archives to find images of each of these countries. Can you guess which satellite image below belongs to which country?
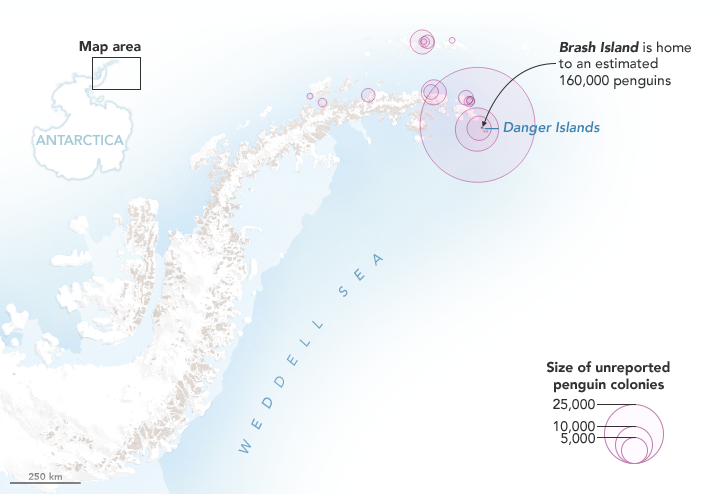
NASA Earth Observatory map by Joshua Stevens, using Landsat data from the U.S. Geological Survey and calculations from Lynch, H. J., & Schwaller, M. R.
Last year, we published a story explaining how scientists had used satellite images of rocks stained pink with guano to discover several unexpectedly large colonies of Adélie penguins on the Danger Islands. Now the researchers are back with a new announcement: Using Landsat data, they have analyzed how the size of that penguin population has changed since 1982. They also used Landsat’s deep archive of satellite imagery to analyze what the penguins eat and whether their diets have changed over the past three decades.
“While the Adélie population [on the Danger Islands] is massive, it was even larger in the past,” said Heather Lynch of Stony Brook University. “We believe the population peaked in the late 1990s and has been on a slow steady decline ever since.” The scientists are still working out what may have caused the 10 to 15 percent decline in the population, but they think it is probably related to changing environmental conditions.
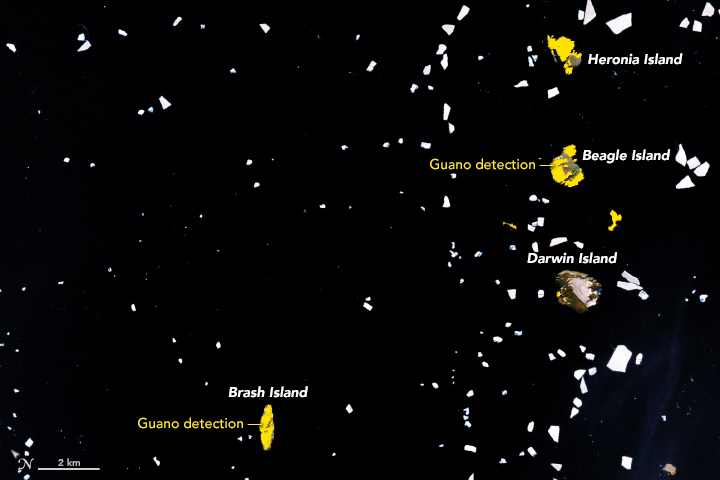
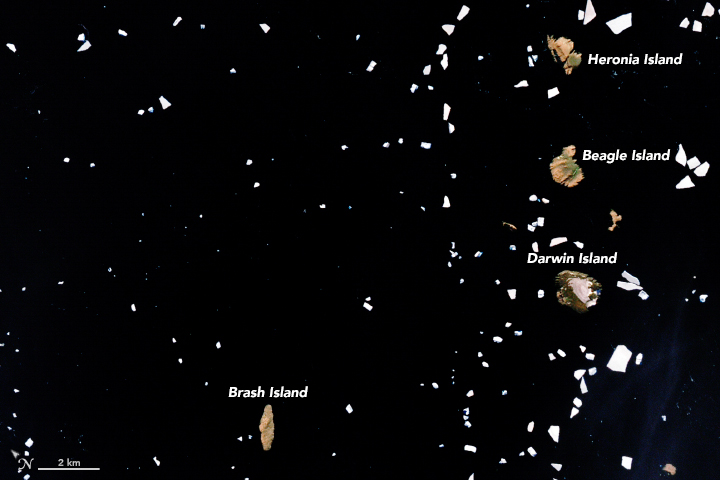
NASA Earth Observatory images by Joshua Stevens, using Landsat data from the U.S. Geological Survey and calculations from Lynch, H. J., & Schwaller, M. R. (2014).
Adélie penguins are particularly sensitive to changes in climate because they require ice-free land areas to breed and access to open water. They also need enough sea ice to support populations of key food sources. The researchers thought that changing diets would accompany the decline in population, but by analyzing the spectral signatures of all the guano stains found in cloud-free Landsat image of the islands since 1982, they were surprised to discover the penguins’ diets have stayed the same.
Penguin guano ranges from white to pink to dark red. White guano is from eating mostly fish; pink and red is from mostly eating krill. The University of Connecticut’s Casey Youngflesh, however, noticed some intriguing regional patterns in what Adélie penguins eat. Colonies in West Antarctica tend to eat more krill, while colonies in East Antarctic consume more fish. The reasons for the difference are not clear, though Youngflesh is looking into the possibility that differences in the Antarctic silverfish population may be a factor.
Discovering the big colonies on the Danger Islands has also opened up a new pathway for figuring out when penguins first arrived. By digging through layers of guano-stained pebbles during a recent field expedition and dirt and dating them with radiocarbon techniques, Michael Polito of Louisiana State University worked out that penguins must have arrived on the Danger Islands about 2,900 years ago, thousands of years earlier than previous evidence suggested.
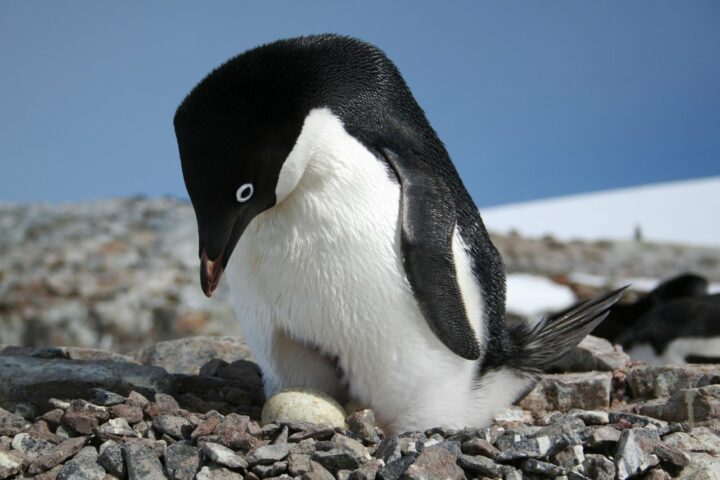
Credits: Heather Lynch, Stony Brook University.
Expect to hear even more guano-stained discoveries in the future. “We are only just scratching the surface of what we can do in terms of tracking seabirds from space,” said Lynch. “We should be able to extend the technique to snow petrel, boobies, and cormorants.”
Lynch put the total number of penguins on the Danger Islands at roughly 1.5 million (individual birds) — more than live on all the rest of the Antarctic Peninsula combined.
Read more about the Danger Island Adélie penguins from NASA and MAPPPD.
This article was published by NASA’s Jet Propulsion Laboratory on January 23, 2018. NASA is beginning several months of commemoration of the beginning of the Space Age and the evolution of Earth science from space.
Sixty years ago next week, the hopes of Cold War America soared into the night sky as a rocket lofted skyward above Cape Canaveral, a soon-to-be-famous barrier island off the Florida coast.
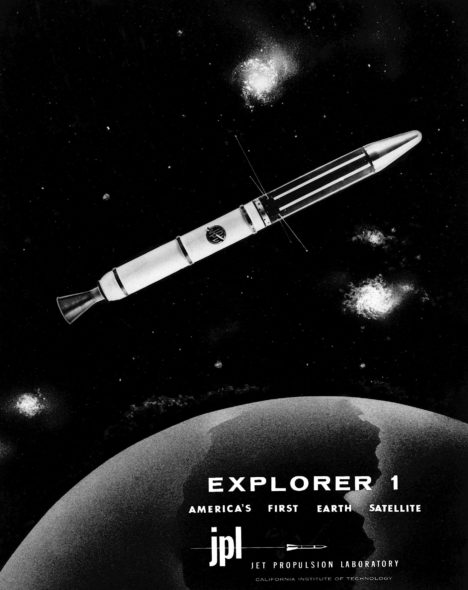
The date was Jan. 31, 1958. NASA had yet to be formed, and the honor of this first flight belonged to the U.S. Army. The rocket’s sole payload was a javelin-shaped satellite built by the Jet Propulsion Laboratory in Pasadena, California. Explorer 1, as it would soon come to be called, was America’s first satellite.
“The launch of Explorer 1 marked the beginning of U.S. spaceflight, as well as the scientific exploration of space, which led to a series of bold missions that have opened humanity’s eyes to new wonders of the solar system,” said Michael Watkins, current director of JPL. “It was a watershed moment for the nation that also defined who we are at JPL.”
In the mid-1950s, both the United States and the Soviet Union were proceeding toward the capability to put a spacecraft in orbit. Yet great uncertainty hung over the pursuit. As the Cold War between the two countries deepened, it had not yet been determined whether the sovereignty of a nation’s borders extended upward into space. Accordingly, then-President Eisenhower sought to ensure that the first American satellites were not perceived to be military or national security assets.
In 1954, an international council of scientists called for artificial satellites to be orbited as part of a worldwide science program called the International Geophysical Year (IGY), set to take place from July 1957 to December 1958. Both the American and Soviet governments seized on the idea, announcing they would launch spacecraft as part of the effort. Soon, a competition began between the Army, Air Force and Navy to develop a U.S. satellite and launch vehicle capable of reaching orbit.
At that time, JPL, which was part of the California Institute of Technology in Pasadena, primarily performed defense work for the Army. (The “jet” in JPL’s name traces back to rocket motors used to provide “jet assisted” takeoff for Army planes during World War II.) In 1954, the laboratory’s engineers began working with the Army Ballistic Missile Agency in Alabama on a project called “Orbiter.” The Army team included Wernher von Braun (who would later design NASA’s Saturn V rocket) and his team of engineers. Their work centered around the Redstone Jupiter-C rocket, which was derived from the V-2 missile Germany had used against Britain during the war.
JPL’s role was to prepare the three upper stages for the launch vehicle, which included the satellite itself. These used solid rocket motors the laboratory had developed for the Army’s Sergeant guided missile. JPL would also be responsible for receiving and transmitting the orbiting spacecraft’s communications. In addition to JPL’s involvement in the Orbiter program, the laboratory’s then-director, William Pickering, chaired the science committee on satellite tracking for the U.S. launch effort overall.
The Navy’s entry, called Vanguard, had a competitive edge in that it was not derived from a ballistic missile program — its rocket was designed, from the ground up, for civilian scientific purposes. The Army’s Jupiter-C rocket had made its first successful suborbital flight in 1956, so Army commanders were confident they could be ready to launch a satellite fairly quickly. Nevertheless, the Navy’s program was chosen to launch a satellite for the IGY.
University of Iowa physicist James Van Allen, whose instrument proposal had been chosen for the Vanguard satellite, was concerned about development issues on the project. Thus, he made sure his scientific instrument payload — a cosmic ray detector — would fit either launch vehicle. Meanwhile, although their project was officially mothballed, JPL engineers used a pre-existing rocket casing to quietly build a flight-worthy satellite, just in case it might be needed.
The world changed on Oct. 4, 1957, when the Soviet Union launched a 23-inch (58-centimeter) metal sphere called Sputnik. With that singular event, the space age had begun. The launch resolved a key diplomatic uncertainty about the future of spaceflight, establishing the right to orbit above any territory on the globe. The Russians quickly followed up their first launch with a second Sputnik just a month later. Under pressure to mount a U.S. response, the Eisenhower administration decided a scheduled test flight of the Vanguard rocket, already being planned in support of the IGY, would fit the bill. But when the Vanguard rocket was, embarrassingly, destroyed during the launch attempt on Dec. 6, the administration turned to the Army’s program to save the country’s reputation as a technological leader.
Unbeknownst to JPL, von Braun and his team had also been developing their own satellite, but after some consideration, the Army decided that JPL would still provide the spacecraft. The result of that fateful decision was that JPL’s focus shifted permanently — from rockets to what sits on top of them.
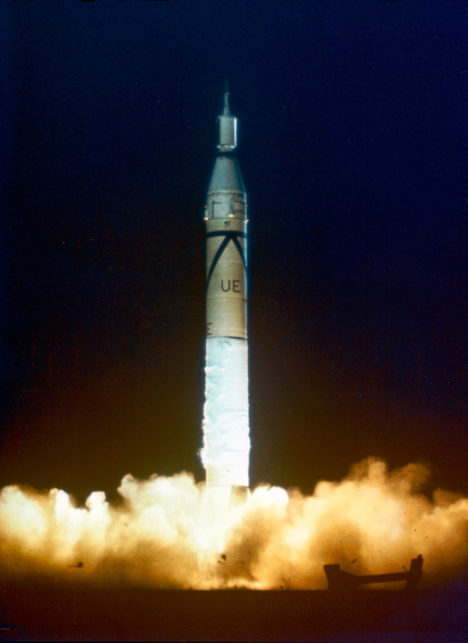
The Army team had its orders to be ready for launch within 90 days. Thanks to its advance preparation, 84 days later, its satellite stood on the launch pad at Cape Canaveral Air Force Station in Florida.
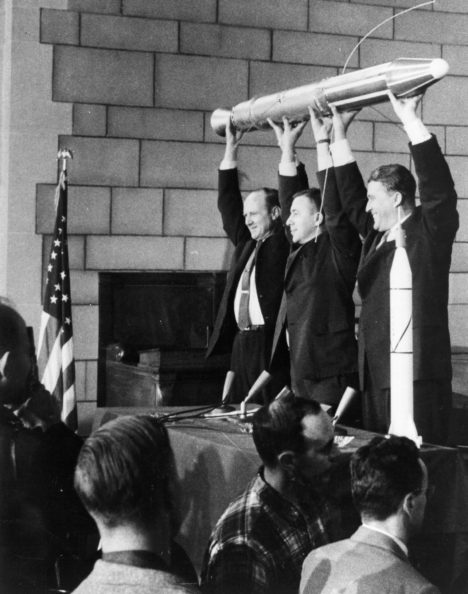
The spacecraft was launched at 10:48 p.m. EST on Friday, Jan. 31, 1958. An hour and a half later, a JPL tracking station in California picked up its signal transmitted from orbit. In keeping with the desire to portray the launch as the fulfillment of the U.S. commitment under the International Geophysical Year, the announcement of its success was made early the next morning at the National Academy of Sciences in Washington, with Pickering, Van Allen and von Braun on hand to answer questions from the media.
Following the launch, the spacecraft was given its official name, Explorer 1. (In the following decades, nearly a hundred spacecraft would be given the designation “Explorer.”) The satellite continued to transmit data for about four months, until its batteries were exhausted, and it ceased operating on May 23, 1958.
Later that year, when the National Aeronautics and Space Administration (NASA) was established by Congress, Pickering and Caltech worked to shift JPL away from its defense work to become part of the new agency. JPL remains a division of Caltech, which manages the laboratory for NASA.
The beginnings of U.S. space exploration were not without setbacks — of the first five Explorer satellites, two failed to reach orbit. But the three that made it gave the world the first scientific discovery in space — the Van Allen radiation belts. These doughnut-shaped regions of high-energy particles, held in place by Earth’s magnetic field, may have been important in making Earth habitable for life. Explorer 1, with Van Allen’s cosmic ray detector on board, was the first to detect this phenomenon, which is still being studied today.
In advocating for a civilian space agency before Congress after the launch of Explorer 1, Pickering drew on Van Allen’s discovery, stating, “Dr. Van Allen has given us some completely new information about the radiation present in outer space….This is a rather dramatic example of a quite simple scientific experiment which was our first step out into space.”
Explorer 1 re-entered Earth’s atmosphere and burned up on March 31, 1970, after more than 58,000 orbits.
For more information about Explorer 1 and the 60 years of U.S. space exploration that have followed it, visit:
NASA/EO-1/ALI/Jesse Allen and Robert Simmon. More info about this image here.
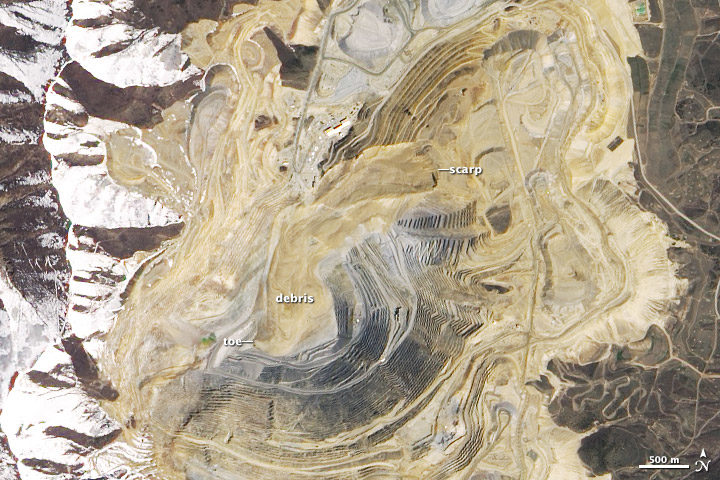
Four years ago today, one of the largest non-volcanic landslides in U.S. history began high on the northern wall of Utah’s Bingham Canyon mine. During two main bursts of activity that day, several million cubic meters of rock and soil careened deep into the mine’s pit.
This was a case where science and the right preparation saved lives. The company that runs the mine had installed an interferometric radar system months before the slide, and it prevented miners from being blindsided. With the radar system in place, mine operators detected changes in the stability of the pit’s walls well before the landslide occurred. When the slope finally gave way, all the workers in the pit had already been evacuated. Not one person was injured.
The image above was acquired by the Advanced Land Imager (ALI) on the Earth Observing-1 satellite on May 2, 2013. For more detailed and recent images of the mine pit, see the montage below. Photos A, B, and C — from Rio Tinto Kennecott — show an overview of the pit, the source area, and slide debris in the immediate aftermath of the event. D is an aerial image from the state government of Utah that shows the mine nine months before the landslide. E is part of the ALI satellite image above. F is a second aerial image taken in February 2014. By then, much of the debris had been removed and a new access road had been built.
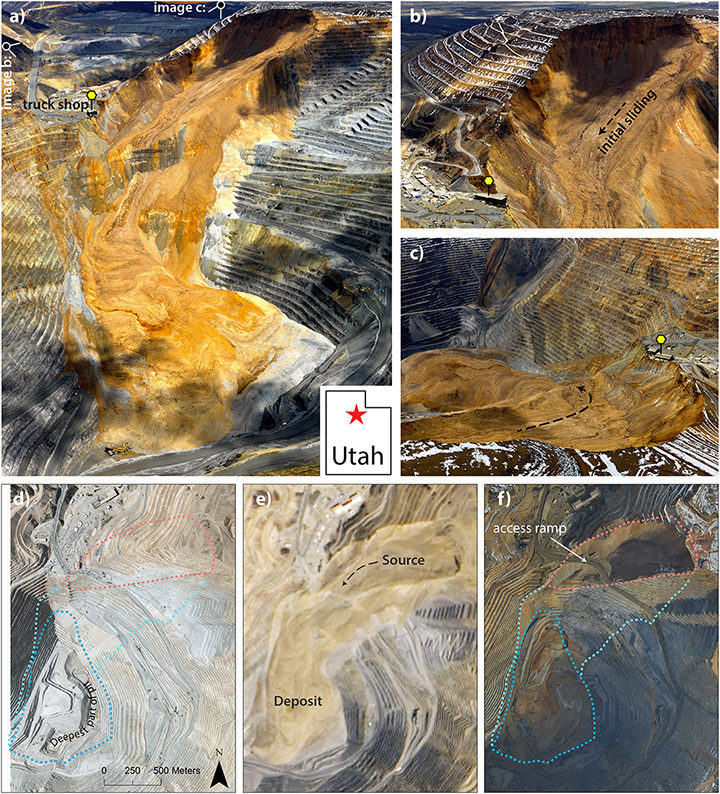
The montage was originally published in March 2017 by the Journal of Geophysical Research as part of a study authored by Jeffrey Moore of Lawrence Livermore National Laboratory. The University of Utah wrote about the research in a recent blog post:
On April 10, at 9:30 p.m. and again at 11:05 p.m., the slope gave way and thundered down into the pit, filling in part of what had been the largest man-made excavation in the world. Later analysis estimated that the landslide was at the time the largest non-volcanic slide in recorded North American history. Now, University of Utah geoscientists have revisited the slide with a combined analysis of aerial photos, computer modeling, and seismic data to pick apart the details. The total volume of rock that fell during the slide was 52 million cubic meters, they report, enough to cover Central Park with 50 feet of rock and dirt. The slide occurred in two main phases, but researchers used infrasound recordings and seismic data to discover 11 additional landslides that occurred between the two main events. Modeling and further seismic analysis revealed the average speeds at which the hillsides fell: 81 miles per hour for the first main slide and 92 mph for the second, with peak speeds well over 150 mph.
The interferometric radar system is not the only safety technology in place at Bingham Canyon. Drones, GPS, and trained experts keep a vigilant eye out for signs of landslides at this mine. Technology and tactics like this mean landslides cause very few injuries and deaths in the United States even though significant landslide potential exists in many parts of the country. As we recently reported, many other parts of the world (notably Africa and South America) are not nearly so fortunate.

On this day five years ago, the largest earthquake in modern Japanese history shook the mainland region of Tohoku. The tsunami that followed was devastating. Nearly 16,000 people were killed, and more than 127,000 buildings completely collapsed. The wave triggered power outages, explosions, and reactor meltdowns at a nuclear plant in Fukushima.
What is perhaps most tragic about the quake is that early-warning systems initially underestimated the magnitude of the event. If these systems had gotten it right, word may have spread more rapidly along Japan’s coast that a massive wave was fast approaching.
Five years later, seismology remains as one of the most unsettling fields of Earth science. As the New Yorker put it: “For seismologists, the Tohoku earthquake was a humbling reminder that our geophysical records offer only a peephole view of Earth’s behavior over time, and that our most advanced models for geological phenomena are cartoonish oversimplifications of nature.”
To learn more about the earthquake, see this gallery of NASA Earth Observatory images. Among the images included is the wave height map at the top of the page, and the closeup view of damage in the town of Rikuzentakata seen below.

