Editor’s note: This Image of the Day includes the answer to the March 2022 puzzler.
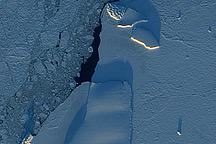
In summer 2019, a rift that began to accelerate across the Brunt Ice Shelf threatened to release an iceberg about twice the size of New York City. But as another Antarctic summer comes to an end, the ice shelf stubbornly continues to hold together. It has even escaped—so far—collisions with numerous icebergs that drifted nearby and threatened to pummel the shelf like an icy wrecking ball.
Throughout the austral summer of 2021-22, bergs in the eastern Weddell Sea drifted south with the Antarctic Coastal Current. Iceberg A-23A—currently the world’s largest iceberg—floated freely after wiggling loose from the seafloor where it had been “grounded” (stuck) for decades. And in January 2022, Iceberg D-28 rounded the Stancomb-Wills Glacier Tongue, floating roughly 4,300 kilometers (2,600 miles) from where it broke free of the Amery Ice Shelf in 2019.
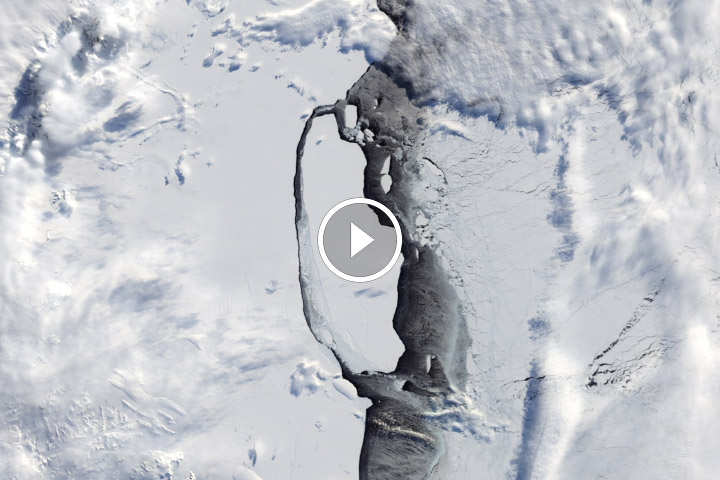
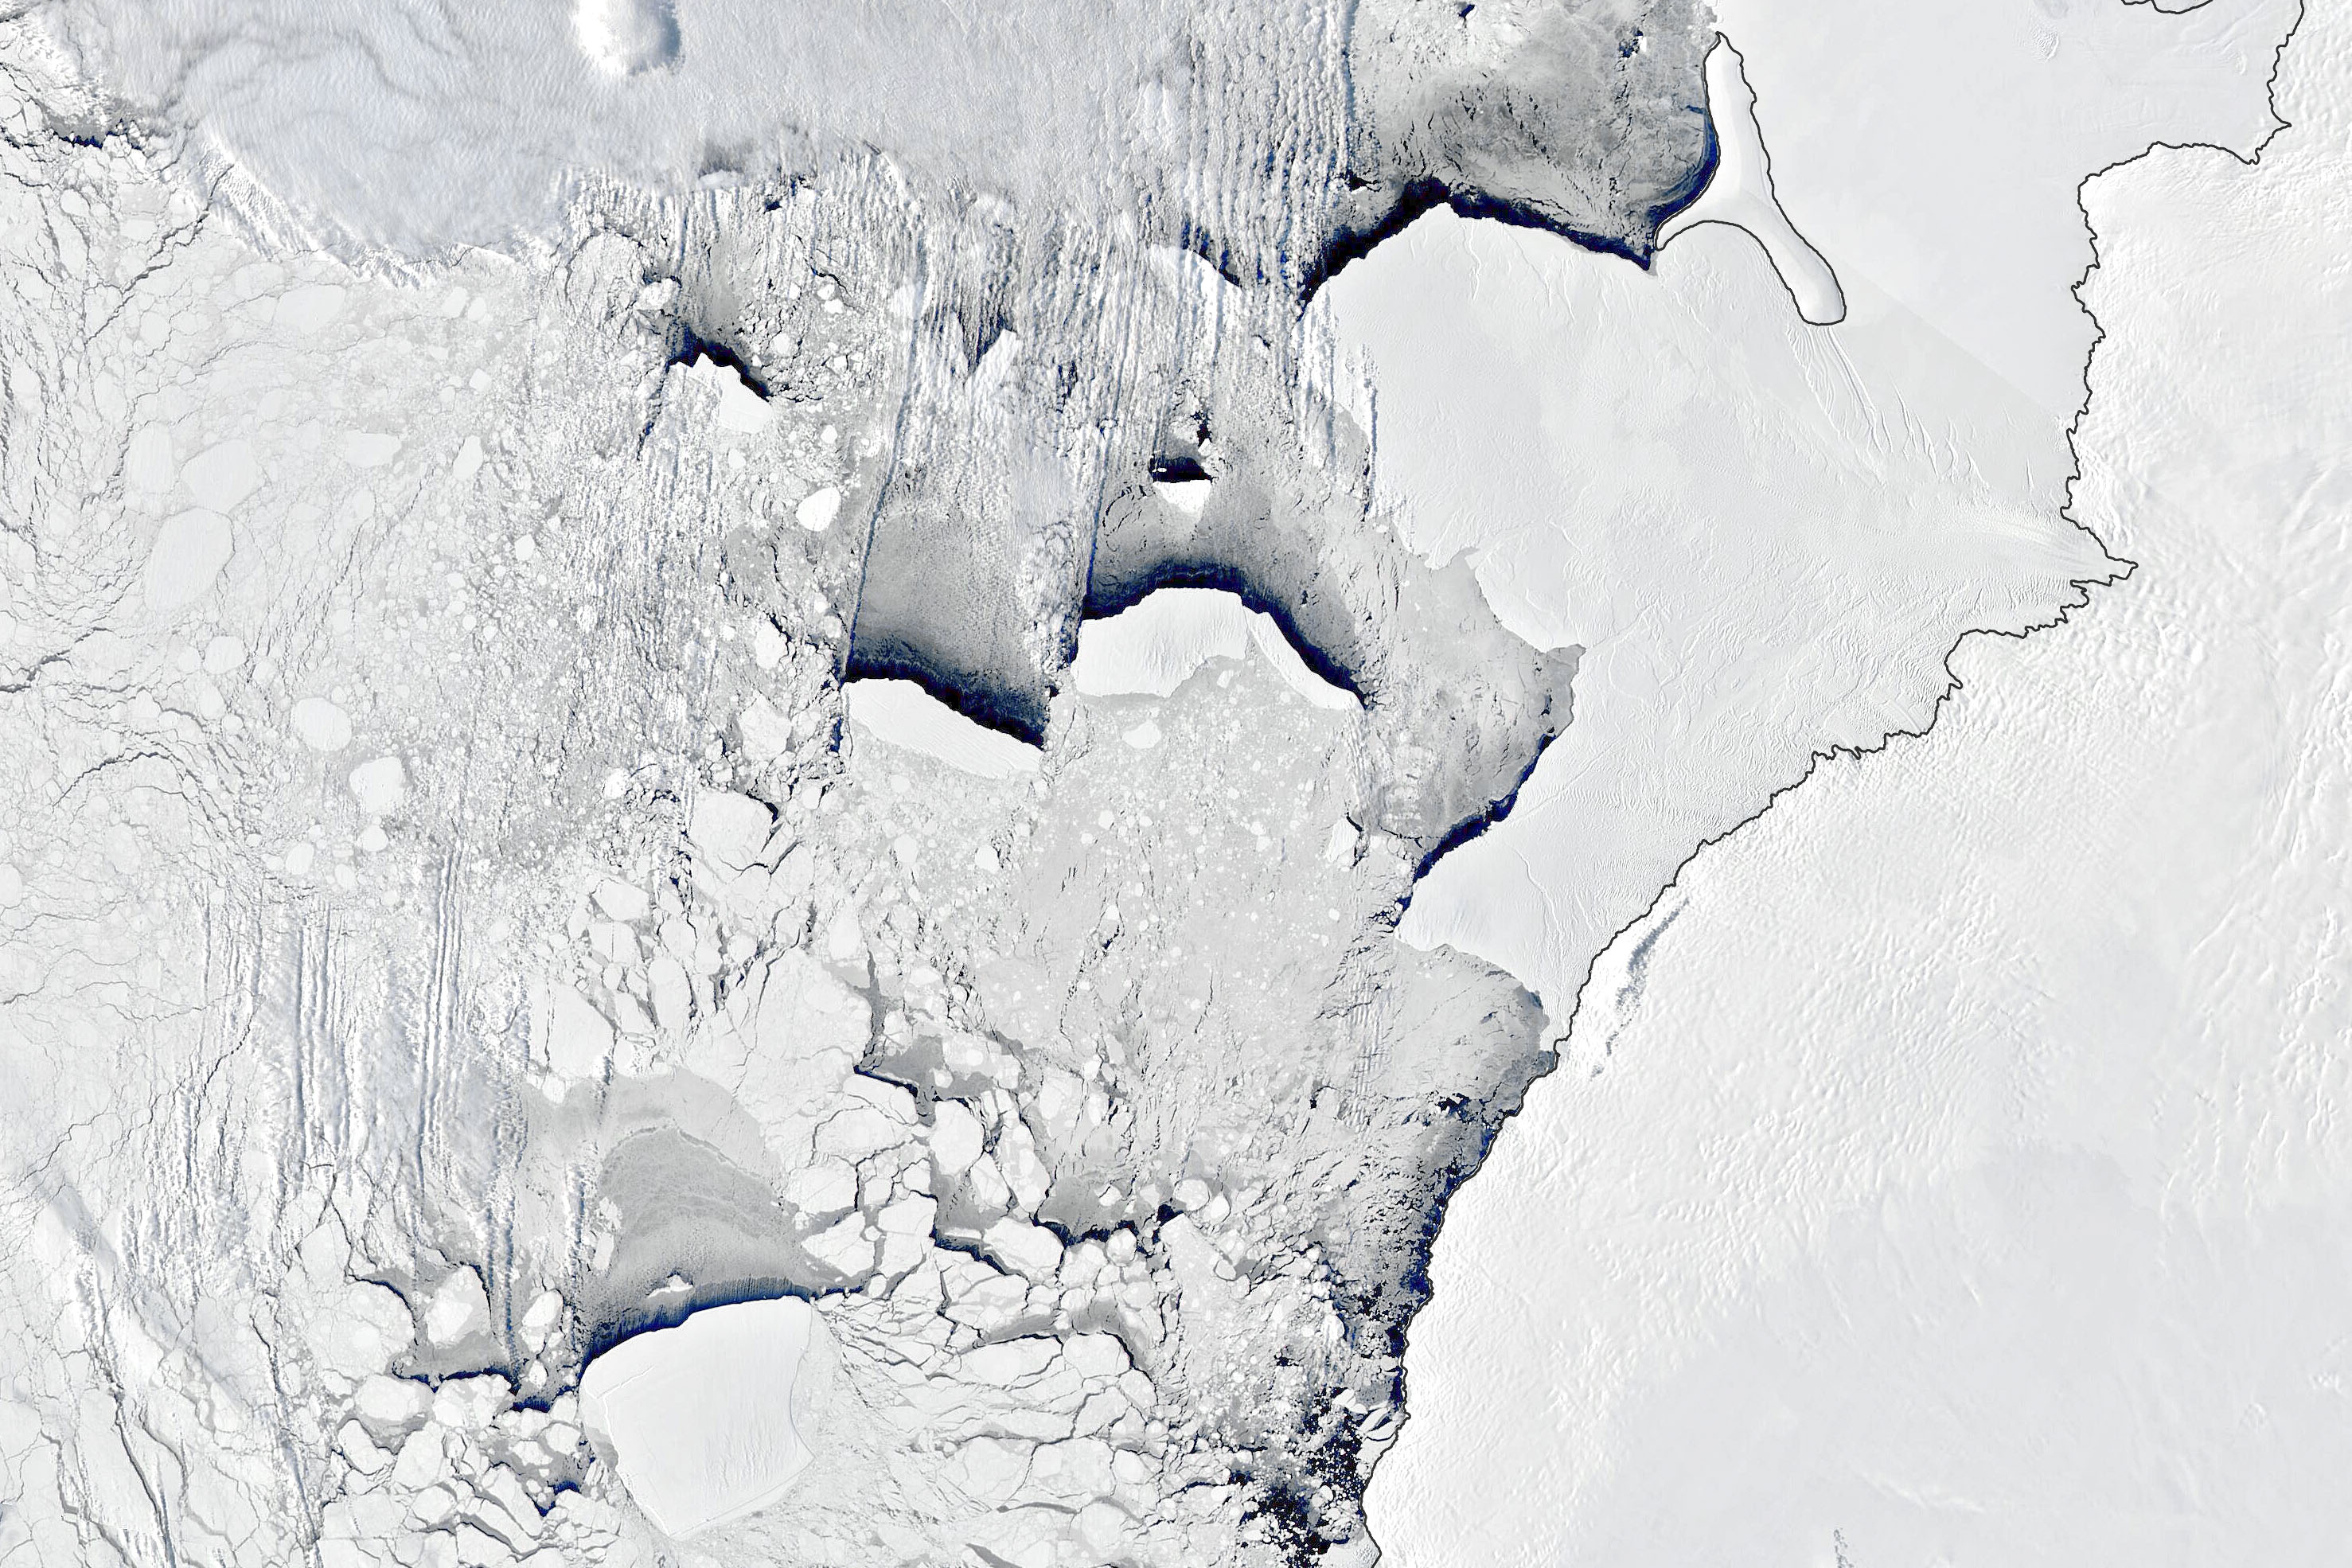
A medley of large bergs ultimately converged near the Brunt Ice Shelf. The image above, acquired on March 6, 2022, with the Moderate Resolution Imaging Spectroradiometer (MODIS) on NASA’s Aqua satellite, shows the bergs as they neared the end of their summer migration.
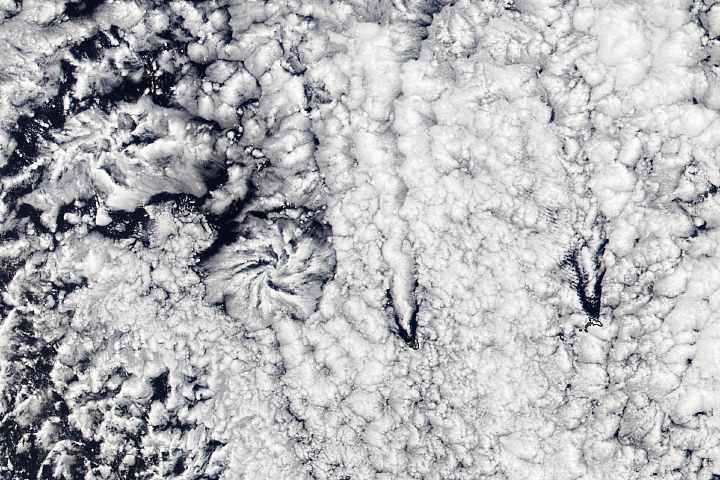
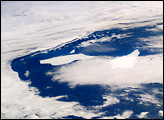
The drift of the icebergs has slowed as daylight hours have waned and temperatures have dropped, allowing sea ice to start growing in earnest on the Weddell Sea. The bergs will eventually become fully encased in seasonal sea ice for the austral winter. But for now, their enormous size makes them effective bulldozers, still capable of plowing through the sea ice and leaving paths of open water behind them. Notice also the striking cloud bands near the sides of icebergs D-30A and D-28. These are likely the result of vortices in the air produced by the edges of the thick, table-like bergs.
More bands of clouds are visible north of the bergs. Clouds like these, known as cloud streets or convective roll clouds, often line up when strong, cold winds blow over comparatively warm ocean water. In this instance, the air blowing off Antarctica was “quite cold,” according to Bart Geerts, an atmospheric scientist at University of Wyoming. Geerts inferred from the ERA5, a reanalysis product from the European Centre for Medium-Range Weather Forecasts (ECMWF), that the winds that day were blowing from the southwest and would have been about -20°C (-4°F).
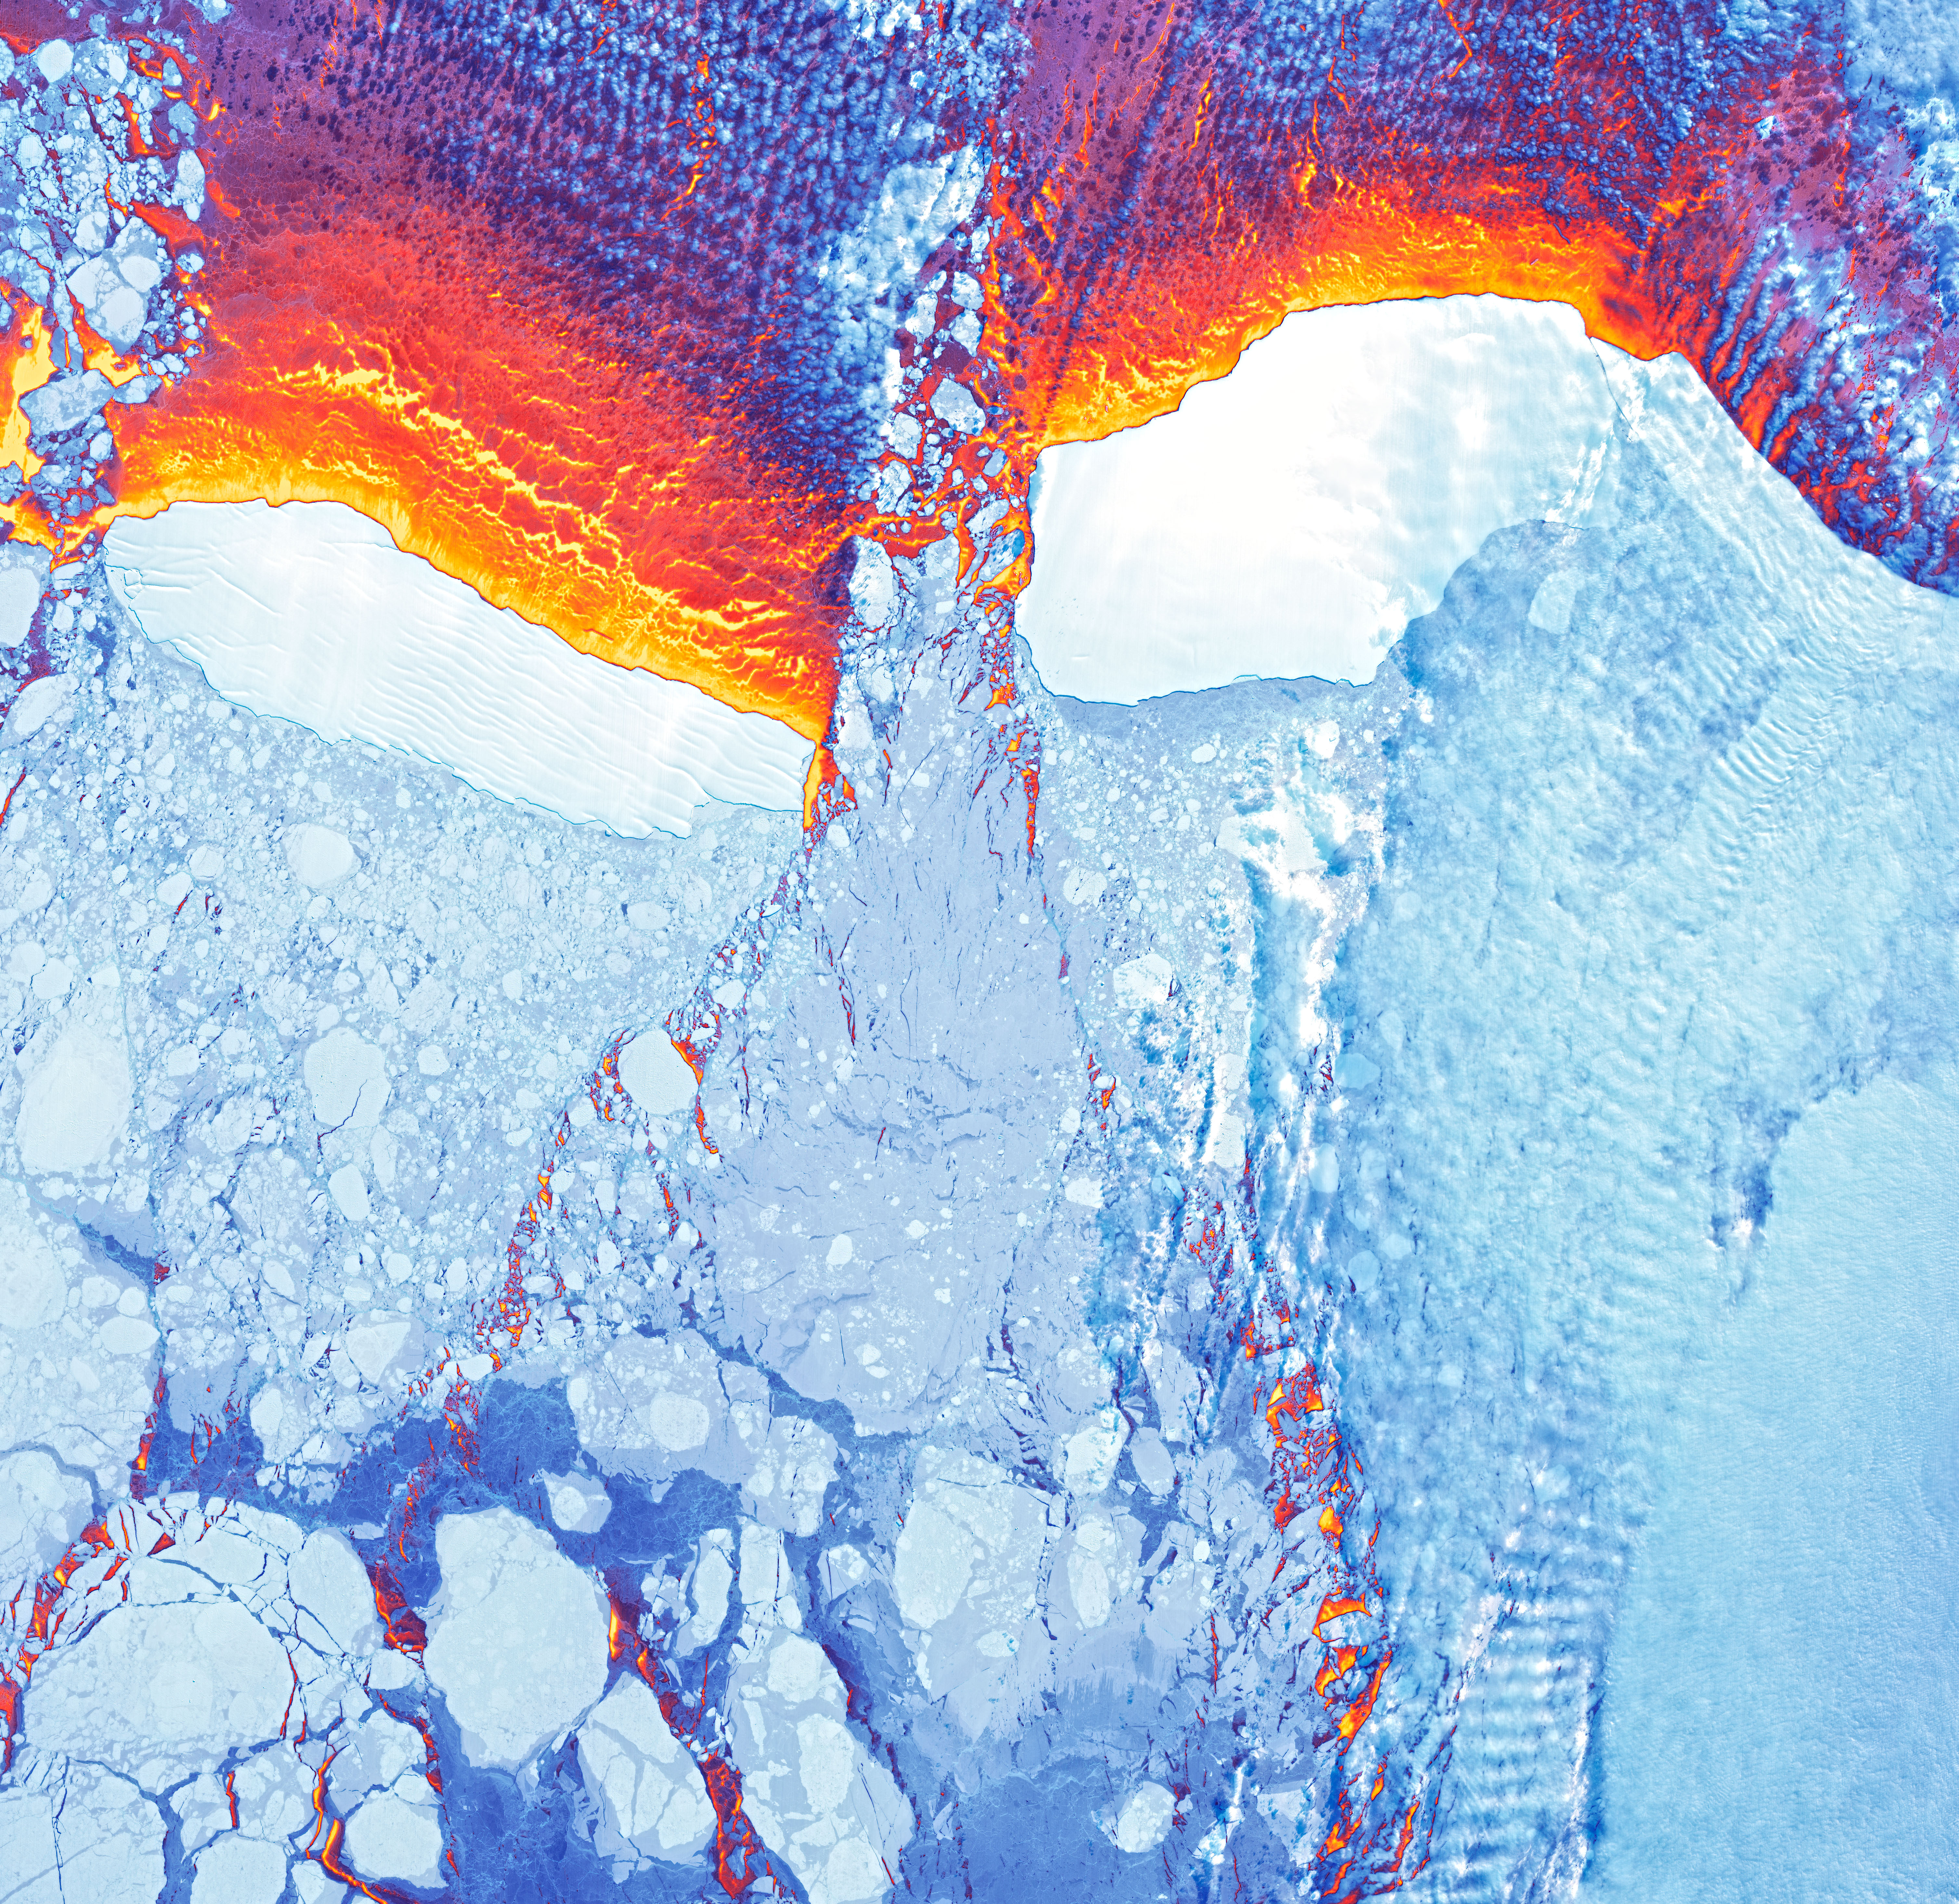
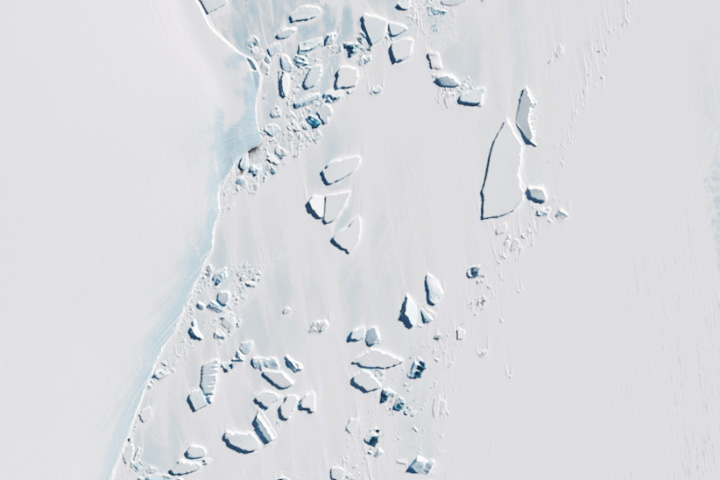
The relative warmth of seawater behind the icebergs and within leads in the sea ice is apparent in the second image, acquired on March 9 by the Landsat 8 satellite. The image is false-color, created by blending data from the satellite’s Operational Land Imager (for detail and texture) and its Thermal Infrared Sensor (TIRS). The warmest areas (yellow, orange, and red) depict open water and thin, newly formed sea ice. The coldest areas (blue and white) are older, thicker ice, including the icebergs and broken ice rubble in their paths.
NASA Earth Observatory images by Joshua Stevens, using Landsat data from the U.S. Geological Survey, and MODIS data from NASA EOSDIS LANCE and GIBS/Worldview. Story by Kathryn Hansen with image interpretation by Christopher Shuman, NASA/UMBC, and Bart Geerts, University of Wyoming.