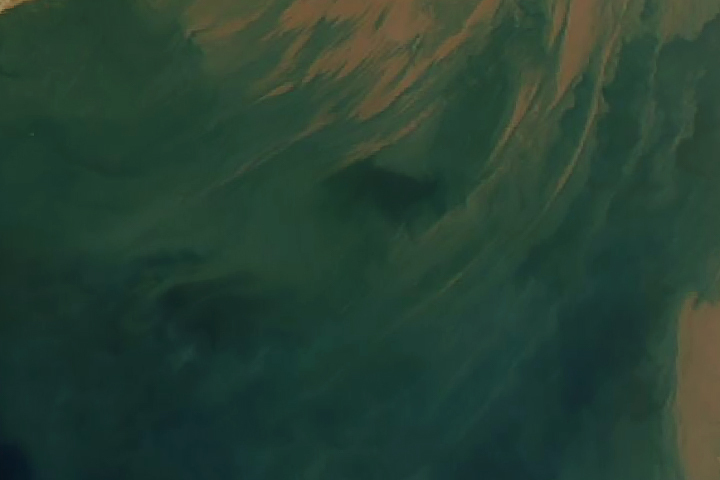
Every month on Earth Matters, we offer a puzzling satellite image. The January 2022 puzzler is shown above. Your challenge is to use the comments section to tell us where it is, what we are looking at, and why it is interesting.
How to answer. You can use a few words or several paragraphs. You might simply tell us the location, or you can dig deeper and offer details about what satellite and instrument produced the image, what spectral bands were used to create it, or what is compelling about some obscure feature. If you think something is interesting or noteworthy, tell us about it.
The prize. We cannot offer prize money or a trip on the International Space Station, but we can promise you credit and glory. Well, maybe just credit. Within a week after a puzzler image appears on this blog, we will post an annotated and captioned version as our Image of the Day. After we post the answer, we will acknowledge the first person to correctly identify the image at the bottom of this blog post. We also may recognize readers who offer the most interesting tidbits of information. Please include your preferred name or alias with your comment. If you work for or attend an institution that you would like to recognize, please mention that as well.
Recent winners. If you have won the puzzler in the past few months, or if you work in geospatial imaging, please hold your answer for at least a day to give less experienced readers a chance.
Releasing Comments. Savvy readers have solved some puzzlers after a few minutes. To give more people a chance, we may wait 24 to 48 hours before posting comments. Good luck!
February 1 update: The answer is suspended sediment in the Gulf of Khambhat, off the northwest coast of India. Congratulations to K Suraj, who correctly identified the Gujarat region of India and the Arabian Sea coast. Read more in this Image of the Day.
NASA will launch four Earth science missions in 2022 to provide scientists with more information about fundamental climate systems and processes including extreme storms, surface water and oceans, and atmospheric dust. Scientists will discuss the upcoming missions at the American Geophysical Union’s (AGU) 2021 Fall Meeting, hosted in New Orleans between Dec. 13 and 17.
NASA has a unique view of our planet from space. NASA’s fleet of Earth-observing satellites provides high-quality data on Earth’s interconnected environment, from air quality to sea ice. These four missions will enhance the ability to monitor our changing planet:
Measuring Tropical Cyclones – Time-Resolved Observations of Precipitation structure and storm Intensity with a Constellation of Smallsats (TROPICS)
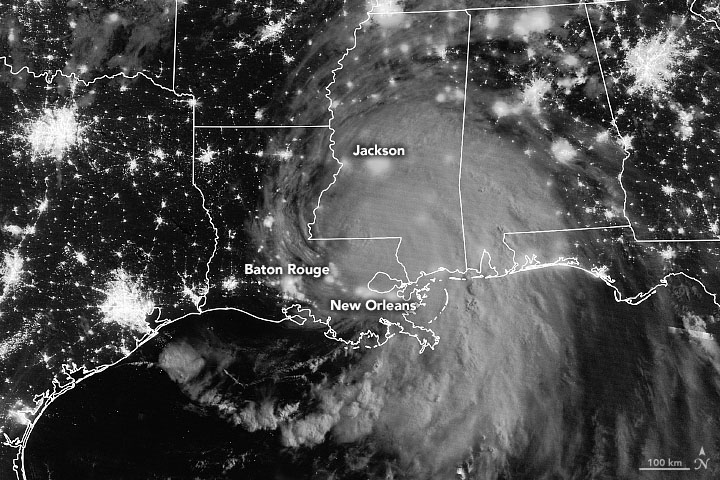
NASA’s TROPICS mission aims to improve observations of tropical cyclones. Six TROPICS satellites will work in concert to provide microwave observations of a storm’s precipitation, temperature, and humidity as quickly as every 50 minutes. Scientists expect the data will help them understand the factors driving tropical cyclone intensification and will contribute to weather forecasting models.
In June 2021, the first pathfinder, or proof of concept satellite of the constellation started collecting data, including from Hurricane Ida in August 2021. The TROPICS satellites will be deployed in pairs of two over three different launches, expected to be completed by July 31, 2022.
Each satellite is about the size of a loaf of bread and carries a miniaturized microwave radiometer instrument. Traveling in pairs in three different orbits, they will collectively observe Earth’s surface more frequently than current weather satellites making similar measurements, greatly increasing the data available for near real-time weather forecasts.
The TROPICS team is led by Principal Investigator Dr. William Blackwell at MIT’s Lincoln Laboratory in Lexington, Massachusetts, and includes researchers from NASA, the National Oceanic and Atmospheric Administration (NOAA), and several universities and commercial partners. NASA’s Launch Services Program, based at the agency’s Kennedy Space Center in Florida, will manage the launch service.
“The coolest part of this program is its impact on helping society,” Blackwell said. “These storms affect a lot of people. The higher frequency observations provided by TROPICS have the potential to support weather forecasting that may help people get to safety sooner.”
Studying Mineral Dust — Earth Surface Mineral Dust Source Investigation (EMIT)
Winds kick up dust from Earth’s arid regions and transport the mineral particles around the world. The dust can influence the radiative forcing — or the balance between the energy that comes toward Earth from the Sun, and the energy that Earth reflects back out into space — hence the temperature of the planet’s surface and atmosphere. Darker, iron-laden minerals tend to absorb energy, which leads to heating of the environment, while brighter, clay-containing particles scatter light in a way that may lead to cooling. In addition to affecting regional and global warming of the atmosphere, dust can affect air quality and the health of people worldwide, and when deposited in the ocean, can also trigger blooms of microscopic algae.
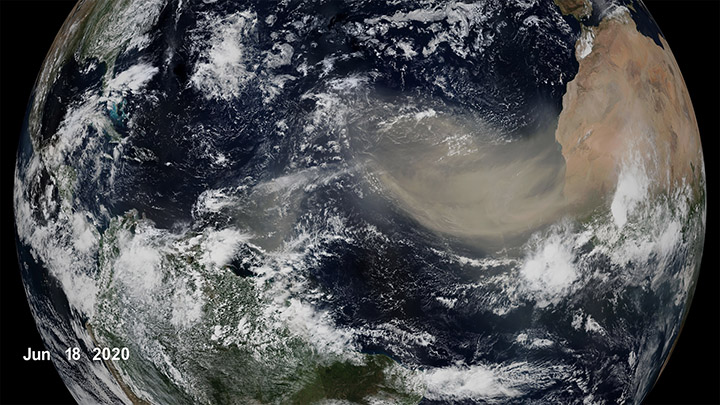
The goal of the Earth Surface Mineral Dust Source Investigation (EMIT) mission is to map where the dust originates and estimate its composition so that scientists can better understand how it affects the planet. Targeted to launch in 2022, EMIT has a prime mission of one year and will be installed on the International Space Station. EMIT will use an instrument called an imaging spectrometer that measures visible and infrared light reflecting from surfaces below. This data can reveal the distinct light-absorbing signatures of the minerals in the dust that helps to determine their composition.
“EMIT will close a gap in our knowledge about arid land regions of our planet and answer key questions about how mineral dust interacts with the Earth system,” said Dr. Robert Green, EMIT principal investigator at NASA’s Jet Propulsion Laboratory.
Observing Earth’s Storms — Joint Polar Satellite System (JPSS)
Forecasting extreme storms many days in advance requires capturing precise measurements of the temperature and moisture in our atmosphere, along with ocean surface temperatures. The NOAA/NASA Joint Polar Satellite System satellites provide this critical data, which is used by forecasters and first responders. The satellites also tell us about floods, wildfires, volcanoes, smog, dust storms, and sea ice.
“JPSS satellites are a vital component of the global backbone of numerical weather prediction,” said JPSS Program Science Adviser Dr. Satya Kalluri.
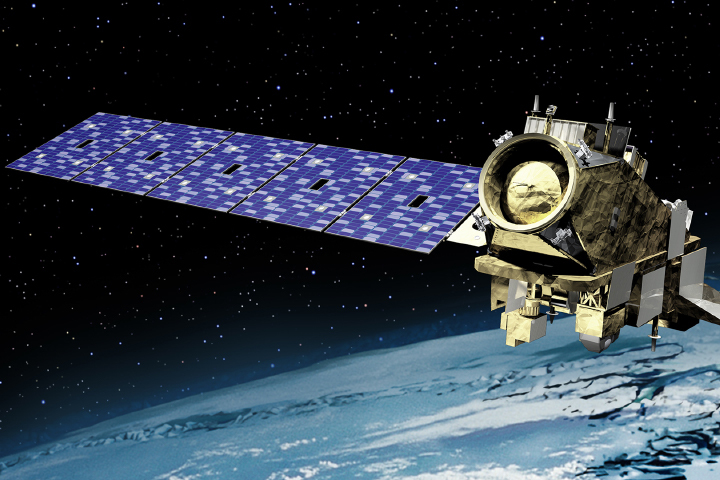
The JPSS satellites circle Earth from the North to the South Pole, taking data and images as they fly. As Earth rotates under these satellites, they observe every part of the planet at least twice a day.
The Suomi-NPP (National Polar orbiting-Partnership) and NOAA-20 satellites are currently in orbit. The JPSS-2 satellite is targeted to launch in 2022 from Vandenberg Space Force Base in California on a United Launch Alliance Atlas V rocket. Three more satellites will launch in the coming years, providing data well into the 2030s. NASA’s Launch Services Program, based at the agency’s Kennedy Space Center in Florida, will manage the launch service.
The Surface Water and Ocean Topography (SWOT) mission will help researchers determine how much water Earth’s oceans, lakes, and rivers contain. This will aid scientists in understanding the effects of climate change on freshwater bodies and the ocean’s ability to absorb excess heat and greenhouse gases like carbon dioxide.
NASA’s Launch Services Program, based at the agency’s Kennedy Space Center in Florida, will manage the launch service, which is targeted for November 2022. SWOT will launch on a SpaceX Falcon 9 rocket from Vandenberg Space Force Base in California.

The SUV-size satellite will measure the height of water using its Ka-band Radar Interferometer, a new instrument that bounces radar pulses off the water’s surface and receives the return signals with two different antennas at the same time. This measurement technique allows scientists to precisely calculate the height of the water. The data will help with tasks like tracking regional shifts in sea level, monitoring changes in river flows and how much water lakes store, as well as determining how much freshwater is available to communities around the world.
“SWOT will address the ocean’s leading role in our changing weather and climate and the consequences on the availability of freshwater on land,” said Dr. Lee-Lueng Fu, SWOT project scientist at NASA’s Jet Propulsion Laboratory.
The mission is a collaboration between NASA and the French space agency Centre National d’Etudes Spatiales, with contributions from the Canadian Space Agency and the United Kingdom Space Agency.
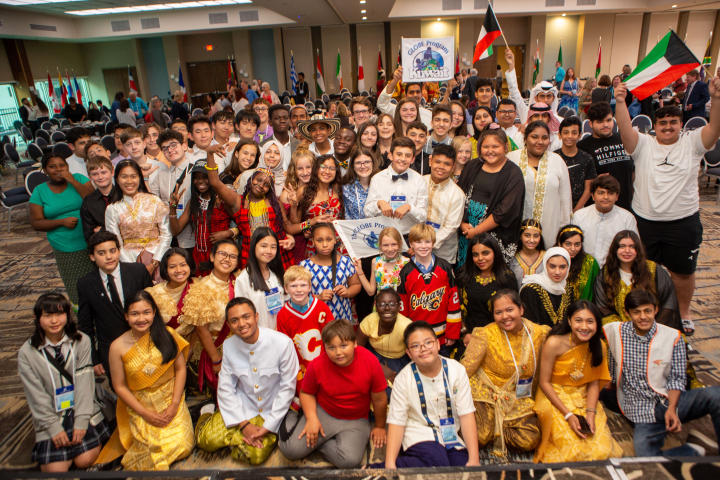
The NASA-sponsored Global Learning and Observations to Benefit the Environment (GLOBE) Program has received the American Geophysical Union (AGU) 2021 Excellence in Earth and Space Science Education Award. According to AGU, the annual award honors an individual, group, or team committed to promoting excellent geophysical education.
Through GLOBE, people around the world learn how to document and share useful information about their local environment with scientists. Launched on Earth Day in 1995, GLOBE connects scientists, teachers, and students in 126 countries with hands-on scientific activities.
“GLOBE is a phenomenal program that has a special place at NASA,” said Dr. Allison Leidner, program manager for education and communication in the Earth Science Division of NASA’s Science Mission Directorate. “Enabling students and citizen scientists to investigate our home planet gives them a greater appreciation of our environment, ignites their interest in science-related careers, and connects them to the international Earth science community. We are so happy to see AGU recognize GLOBE with this award.”
Through teachers that have been trained in GLOBE protocols, students learn how to conduct scientific investigations and collect data in their community. GLOBE science protocols were developed with Earth scientists and many protocols have connections to NASA’s satellite missions. So far, GLOBE participants have gathered and shared more than 200 million Earth science observations.
“The GLOBE Program has made outstanding achievements and contributions by pushing the frontiers of our science forward,” said AGU President Susan Lozier in a statement, on behalf of the AGU Earth and space science community. “GLOBE has also embodied AGU’s shared vision of a thriving, sustainable and equitable future for all, powered by discovery, innovation, and action. And you did this with integrity, respect, diversity, and collaboration while creating deep engagement in education and outreach.”
In addition to being sponsored by NASA, GLOBE is supported by the National Science Foundation (NSF), National Oceanic and Atmospheric Administration (NOAA), and the U.S. Department of State.
Dr. Tony Murphy, GLOBE Implementation Office director, and Dr. Caryn Long, middle school science teacher at Montverde Academy (Florida), share more about the program and its recent recognition. Their responses have been edited for clarity.
Tony Murphy: GLOBE has a strong community of citizen scientists, students, and teachers all over the world who are eager to contribute to Earth system science research. GLOBE allows people to contribute to data collection and submission, to understand the scientific research process and the work of scientists, and to see how their local environment fits into the regional and global environment.
Caryn Long: I have used GLOBE in my classroom for five years now. GLOBE is different from other science education programs because it educates students while also immersing them in the practical and applied nature of science. Knowing they are contributing to real research with NASA scientists is a powerful motivational tool to get them to practice the skills of observation, data collection, and analysis in a real and meaningful way. They want to practice the skills they are developing because what they are doing is valued.
Long: Our classroom participates in the Cloud, Aerosols and Hydrology Protocols and the Surface Temperature Field Campaign at the lake behind our school. We are adding more protocols each year. Each time I share with my students that we are learning a new protocol to add to their toolbox, they are excited to get started. What my students have enjoyed most about GLOBE is meeting some of the scientists that are involved with the program. Another highlight for them is gathering the cloud data because it involves NASA satellites. Receiving the email matches with the satellites is exciting to the kids because they love comparing what they saw from a ground level to what the satellite has viewed.
Murphy: Seeing students communicate their research at meetings, and especially at the two GLOBE Learning Expeditions I have attended, has been truly amazing. GLOBE Learning Expeditions are week-long, student-focused events held every few years at sites around the world. I gave a scientific presentation at a national science competition in Ireland when I was in middle school. That experience had a major influence on my life, so it’s incredible to see so many GLOBE participants have a similar opportunity.
Murphy: The GLOBE community has grown tremendously from a small number of countries in 1995 to 126 countries today with a database of over 200 million measurements for use in research by students and scientists. New technology advancements including the GLOBE Program’s app, GLOBE Observer, have impacted the ways in which the program is implemented and enables citizen scientists to participate. The GLOBE community worldwide, including students, country coordinators, teachers, program support staff, government officials, and program sponsors, have allowed GLOBE to earn this recognition.
What does Earth look like from 98 miles up? A project developed by Colorado community college students is providing the opportunity for the public to see Earth from the perspective of a small rocket in flight.
The 360-degree camera experiment flew on a Terrier-Improved Malemute suborbital sounding rocket in August 2021 from NASA’s Wallops Flight Facility. The camera experiment was flown as part of the RockSat-X mission, a NASA education program in partnership with the Colorado Space Grant Consortium. Participating schools in the project included Arapahoe Community College in Littleton, Colorado, and Red Rocks Community College in Lakewood, Colorado.
“The goal of the project was to produce a video of a sounding rocket flight away from the body of the vehicle,” said Giovanni Rosanova, chief of the NASA sounding programs office at Wallops. “In addition to the educational and public outreach values of the project, the technology may also be used on NASA sounding rocket flights to observe science or technology instrument deployments during flight.”
“Over 50 community college students participated in the project,” said Chris Koehler, director of the Colorado Space Grant Consortium. “Developed over a two-year period, the project provided the students with many challenges, including how to get the camera away from the rocket and then protecting it from re-entry then impact in the ocean.”
“The students met the challenges, during a pandemic, and the camera system provided a spectacular and immersive view from space,” Koehler said.
Sounding rockets fly a parabolic or arc trajectory. Flying from 75 to 800 miles altitude, these rockets are used to conduct science, pursue technology development, and provide educational opportunities for students. They do not place experiments or satellites into orbit.
“Not bad for a shoebox.”
This quip, uttered by an engineer at NASA’s Wallops Island Near Earth Network (NEN) receiving station on March 22, 2019, is something NASA oceanographer Gene Carl Feldman will never forget.
The comment came in response to the successful downlink and processing of the first image from the HawkEye imager aboard the University of North Carolina-Wilmington’s SeaHawk CubeSat, currently in low-Earth orbit approximately 575 kilometers above the surface.
The goal of the SeaHawk mission was to prove a concept: that it is possible to collect scientifically credible ocean color data comparable to that of previous ocean color satellite missions from a 3U (or unit) CubeSat, a small, cube-shaped satellite (also known as a nanosatellite) measuring just 10-centimeters x 10-centimeters x 30-centimeters. The first successful download of an image from HawkEye proved it was.
“The mission could have ended at that moment, and we could have declared 100 percent success,” said Feldman, who specializes in ocean color remote sensing. “This was the first X-band downlink from a CubeSat that NASA had ever done. The data came down, it was processed flawlessly through the system — it was amazing! Everything worked. Here you have this 11-meter dish collecting data from something you can hold in one hand.”
The mission could have ended at that time, but, of course, it didn’t. Although pursued as a proof-of-concept, Feldman admits he had bigger plans for SeaHawk from the start.
“I didn’t think it would be worth NASA’s investment to do a one-off, get one image, prove the concept, and go home,” he said. “My goal from the beginning was to integrate this mission into the infrastructure that we have built over the past 25 years to support ocean color satellites, and to demonstrate that a CubeSat can be treated like a normal, credible scientific mission.”
Click here to read more about the origins, development, and performance of SeaHawk and HawkEye.
The American West is in the grip of an exceptional drought. Following one of the planet’s hottest years on record — and with rainfall and snowfall in the western U.S. well below average — water managers, policymakers, government agencies, and scientists are facing strapped water supplies and anticipating potentially devastating wildfires.
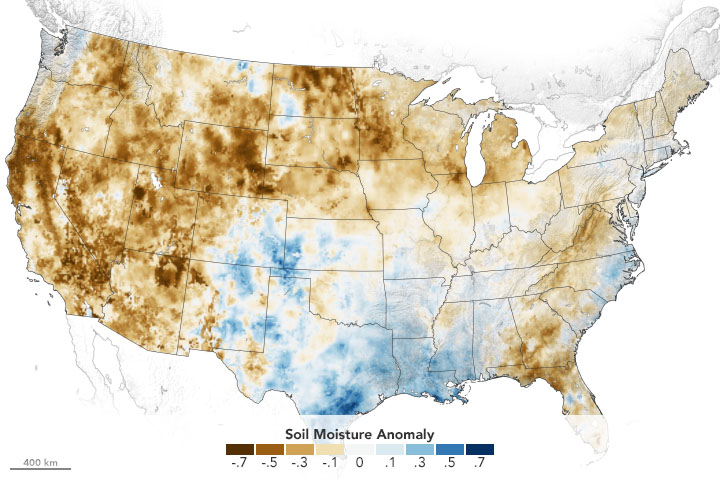
Using its satellites, aircraft, and computer models, NASA is helping water managers respond. NASA’s drought resource page details how the agency is helping farmers, reservoir managers, and decision makers track and monitor the ongoing drought, predict how much water will be available, and help improve how we use the water we have. The site will be updated throughout the year.
Underpinning all of this is NASA’s expertise in water science, our partnerships with water managers across the country, and our leadership in space and remote-sensing technology.
Learn more at the drought resource page.
Researchers have found that Earth’s energy imbalance approximately doubled during the 14-year period from 2005 to 2019.
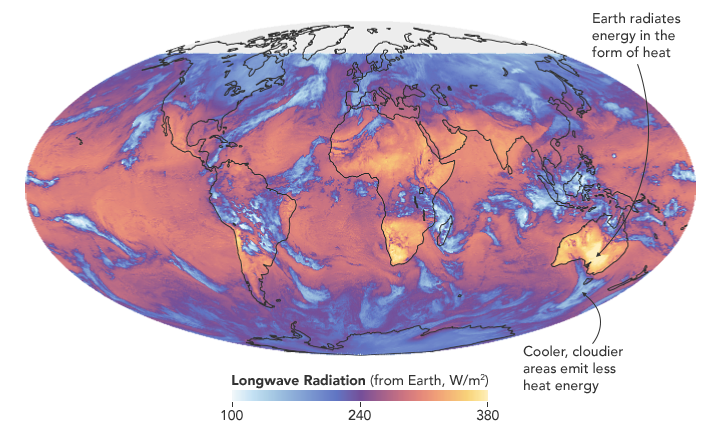
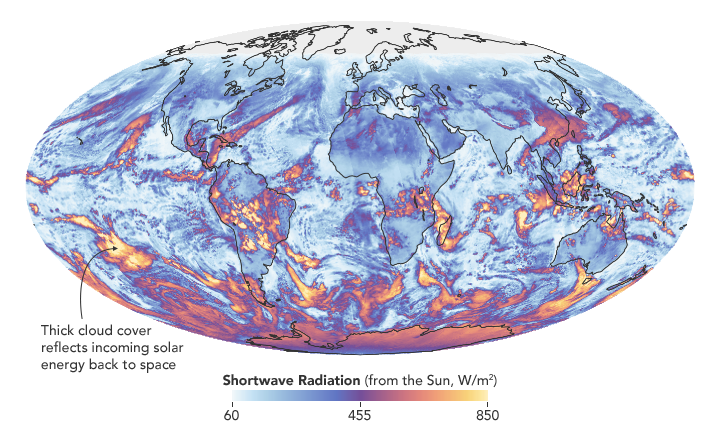
Earth’s climate is determined by a delicate balance between how much of the Sun’s radiative energy is absorbed in the atmosphere and at the surface and how much thermal infrared radiation Earth emits to space. A positive energy imbalance means the Earth system is gaining energy, causing the planet to heat up. The doubling of the energy imbalance is the topic of a recent study published June 15 in Geophysical Research Letters.
Scientists at NASA and the National Oceanic and Atmospheric Administration compared data from two independent sets of measurements. NASA’s Clouds and the Earth’s Radiant Energy System (CERES) satellite sensors measure how much energy enters and leaves Earth’s system. A global array of ocean floats, called Argo, provide data to enable an accurate estimate of the rate at which the world’s oceans are warming. Since approximately 90 percent of the excess energy from an energy imbalance ends up in the ocean, the overall trends of incoming and outgoing radiation should broadly agree with changes in ocean heat content.
“The two very independent ways of looking at changes in Earth’s energy imbalance are in really, really good agreement, and they’re both showing this very large trend, which gives us a lot of confidence that what we’re seeing is a real phenomenon and not just an instrumental artifact,” said Norman Loeb, lead author for the study and principal investigator for CERES at NASA’s Langley Research Center. “The trends we found were quite alarming in a sense.”
“It’s likely a mix of anthropogenic forcing and internal variability,” said Loeb. “And over this period they’re both causing warming, which leads to a fairly large change in Earth’s energy imbalance. The magnitude of the increase is unprecedented.”
Increases in emissions of greenhouse gases such as carbon dioxide and methane trap heat in the atmosphere, capturing outgoing radiation that would otherwise escape into space. The warming drives other changes, such as the melting of snow and ice, increased water vapor, and cloud changes that can further enhance the warming. Earth’s energy imbalance is the net effect of all these factors.
In order to determine the factors driving the imbalance, the investigators examined changes in clouds, water vapor, trace gases, the output of light from the Sun, Earth’s surface albedo (the amount of light reflected by the surface), atmospheric aerosols, and changes in surface and atmospheric temperature distributions.
The scientists found that the doubling of the energy imbalance is partially the result an increase in greenhouse gases from human activity, also known as anthropogenic forcing. It can also be attributed to increases in water vapor, which traps more outgoing longwave radiation and further contributes to Earth’s energy imbalance. The related decrease in clouds and sea ice also lead to more absorption of solar energy.
The authors also found that a flip of the Pacific Decadal Oscillation (PDO) from a cool phase to a warm phase likely played a major role in the intensification of the energy imbalance. The PDO is a pattern of Pacific climate variability in which a massive wedge of water in the eastern Pacific goes through cool and warm phases. This naturally occurring internal variability in the ocean can have far-reaching effects on weather and climate. An intensely warm PDO phase that began around 2014 and continued until 2020 caused a widespread reduction in cloud coverage over the ocean and a corresponding increase in the absorption of solar radiation.
“The lengthening and highly complementary records from Argo and CERES have allowed us both to pin down Earth’s energy imbalance with increasing accuracy, and to study its variations and trends with increasing insight, as time goes on,” said Gregory Johnson, co-author on the study and physical oceanographer at NOAA’s Pacific Marine Environmental Laboratory. “Observing the magnitude and variations of this energy imbalance are vital to understanding Earth’s changing climate.”
Loeb cautions that the study is only a snapshot relative to long-term climate change, and that it is not possible to predict with any certainty what the coming decades might look like for Earth’s energy budget. The study does conclude, however, that unless the rate of heat uptake subsides, greater changes in climate should be expected.
harmony: 1. A pleasing arrangement of parts. 2. An interweaving of different accounts into a single narrative. (Merriam-Webster Online Dictionary)
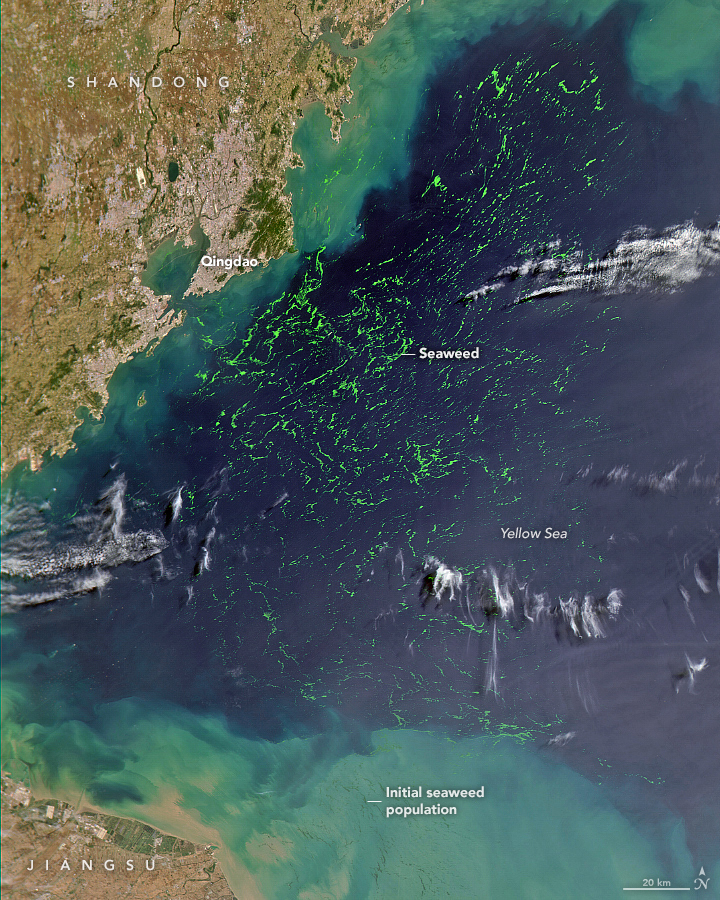
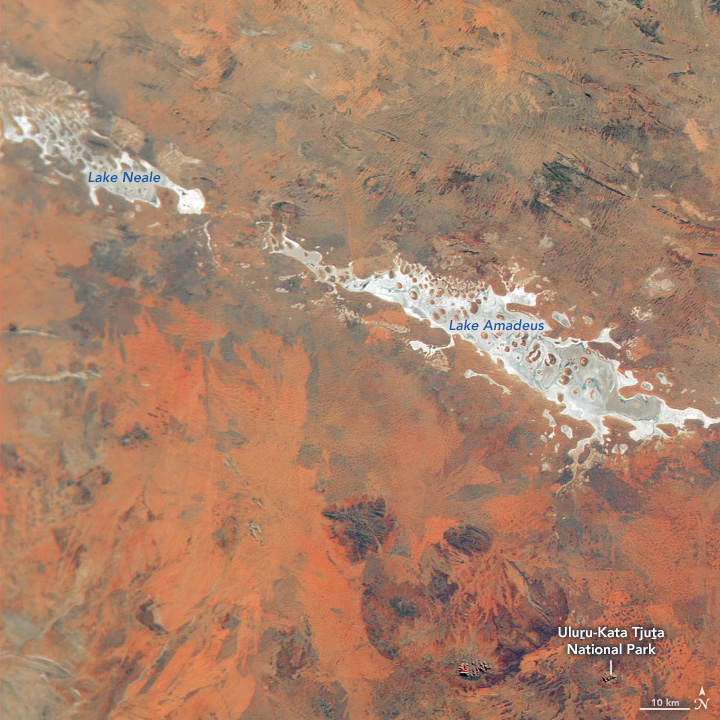
The Operational Land Imager (OLI) aboard the Landsat 8 satellite and the Multi-Spectral Instrument (MSI) aboard the Sentinel-2A and Sentinel-2B satellites tell two slightly different stories of Earth. OLI fully images the planet’s land surfaces every sixteen days at 30-meter resolution. MSI images Earth with repeat coverage every five days at 10- to 20-meter resolution.
But what if you could combine, or harmonize, these two data stories into a single narrative? With the provisional release of the Harmonized Landsat Sentinel-2 (HLS) dataset, NASA, the U.S. Geological Survey, and the European Space Agency have done just that. By combining OLI and MSI data—processing it to be used together as if it all came from a single instrument on one satellite—scientists have created global land surface products at 30-meter spatial resolution that are refreshed every two to three days.
“Our definition of ‘harmonized’ is that observations should be interchangeable for common [spectral] bands,” says Jeff Masek, the HLS principal investigator and Landsat 9 project scientist. “By harmonizing the datasets and making the corrections so that it appears to the user that the data are coming from a single platform, it makes it easier for a user to put these two datasets together and get that high temporal frequency they need for land monitoring.”
Two provisional surface reflectance HLS products are available through NASA’s Earthdata Search and NASA’s Land Processes Distributed Active Archive Center (LP DAAC): the Landsat 30-meter (L30) product (doi:10.5067/HLS/HLSL30.015) and the Sentinel 30-meter (S30) product (doi:10.5067/HLS/HLSS30.015). HLS imagery also is available through NASA’s Global Imagery Browse Services (GIBS) for interactive exploration using the NASA Worldview data visualization application.
The HLS image-processing algorithm was initially developed by a team at NASA’s Goddard Space Flight Center starting in 2013, with test versions released in 2015, 2016, and 2017. Even though HLS was still in the prototype stage and covered just 28 percent of Earth’s land surface, the team saw immediate and clear value for the scientific community. The project was scaled up from 28 percent to nearly 100 percent of Earth’s land surface (minus Antarctica) in 2019 by NASA’s Interagency Implementation and Advanced Concepts Team (IMPACT) at NASA’s Marshall Space Flight Center.
The HLS dataset is optimized for use in the Amazon Web Services commercial cloud environment; hosting it in the cloud has significant benefits for data users. “We’re really trying to take data analysis to the next level where we’re able to provide this large-scale processing without large-scale computing requirements,” says Brian Freitag, the HLS project manager at IMPACT. “For example, if you want to look at all the HLS data for a particular plot of land at the 30-meter resolution provided by HLS, you can do this using your laptop. Everything is in cloud-optimized GeoTIFF format.”
The harmonious combination of the OLI and MSI stories is opening new avenues of terrestrial research. A principal HLS application area will be agriculture, including studies of vegetation health; crop development, management, and identification; and drought impacts. HLS data also are being used in a new vegetation seasonal cycle dataset available through LP DAAC.
Global, 30-meter coverage every two to three days? The ability to access and work with years of Landsat and Sentinel imagery in the commercial cloud? That’s a harmonious arrangement the scientific community is eager to explore.
Five decades ago, NASA and the U.S. Geological Society launched a satellite to monitor Earth’s landmasses. The Apollo era had given us our first look at Earth from space and inspired scientists to regularly collect images of our planet. The first Landsat — originally known as the Earth Resources Technology Satellite (ERTS) — rocketed into space in 1972. Today we are preparing to launch the ninth satellite in the series.
Each Landsat has improved our view of Earth, while providing a continuous record of how our home has evolved. We decided to examine the legacy of the Landsat program in a four-part series of videos narrated by actor Marc Evan Jackson (who played a Landsat scientist in the movie Kong: Skull Island). The series moves from the birth of the program to preparations for launching Landsat 9 and even into the future of these satellites.
Episode 1: Getting Off the Ground
The soon-to-be-launched Landsat 9 is the intellectual and technical successor to eight generations of Landsat missions. Episode 1 answers the “why?” questions. Why did space exploration between 1962 and 1972 lead to such a mission? Why did the leadership of several U.S. government agencies commit to it? Why did scientists come to see satellites as important to advancing earth science? In this episode, we are introduced to William Pecora and Stewart Udall, two men who propelled the project forward, as well as Virginia Norwood, who breathed life into new technology.
Episode 2: Designing for the Future
The early Landsat satellites carried a sensor that could “see” visible light, plus a little bit of near-infrared light. Newer Landsats, including the coming Landsat 9 mission, have two sensors: the Operational Land Imager (OLI) and the Thermal Infrared Sensor (TIRS). Together they observe in visible, near-infrared, shortwave-infrared, and thermal infrared wavelengths. By comparing observations of different wavelengths, scientists can identify algal blooms, storm damage, fire burn scars, the health of plants, and more.
Episode 2 takes us inside the spacecraft, showing how Landsat instruments collect carefully calibrated data. We are introduced to Matt Bromley, who studies water usage in the western United States, as well as Phil Dabney and Melody Djam, who have worked on designing and building Landsat 9. Together, they are making sure that Landsat continues to deliver data to help manage Earth’s precious resources.
Episode 3: More Than Just a Pretty Picture
The Landsat legacy includes five decades of observations, one of the longest continuous Earth data records in existence. The length of that record is crucial for studying change over time, from the growth of cities to the extension of irrigation in the desert, from insect damage to forests to plant regrowth after a volcanic eruption. Since 2008, that data has been free to the public. Anyone can download and use Landsat imagery for everything from scientific papers to crop maps to beautiful art.
Episode 3 explores the efforts of USGS to downlink and archive five decades of Landsat data. We introduce Mike O’Brien, who is on the receiving end of daily satellite downloads, as well as Kristi Kline, who works to make Landsat data available to users. Jeff Masek, the Landsat 9 project scientist at NASA, describes how free access to data has revolutionized what we are learning about our home planet.
Episode 4: Plays Well With Others
For the past 50 years, Landsat satellites have shown us Earth in unprecedented ways, but they haven’t operated in isolation. Landsat works in conjunction with other satellites from NASA, NOAA, and the European Space Agency, as well as private companies. It takes a combination of datasets to get a full picture of what’s happening on the surface of Earth.
In Episode 4, we are introduced to Danielle Rappaport, who combines audio recordings with Landsat data to measure biodiversity in rainforests. Jeff Masek also describes using Landsat and other data to understand depleted groundwater.
Learn more about the Landsat science team at NASA.
Learn more about the Landsat program at USGS.
View images in our Landsat gallery.
Trees connect us scientifically, environmentally, and culturally. We all know that trees are vital to our planet’s health. As trees grow, they absorb carbon from the atmosphere, playing a vital role in Earth’s global carbon cycle and helping to regulate Earth’s carbon budget.
But before you read any further, look around…especially if you are outside. Most of you can look in any direction and see a tree. You might wonder about a few things like: “What type of tree is that?” or “Why is that tree so tall or short?” or “How old is that tree?” or even “Was that tree planted by someone, or did the wind blow a seed to where the tree is now standing?”
Or what if you don’t see any trees? What does that signify about the environment? Did nature make it that way, or did humans? All of these are great questions that can help us understand and connect with the environment.
A few trees on Earth also connect us to the Moon. Have you ever heard of “Moon Trees?”
“Moon Trees” never actually grew on the Moon, but their seeds were taken into lunar orbit 50 years ago this week. The NASA Moon Trees history website explains:
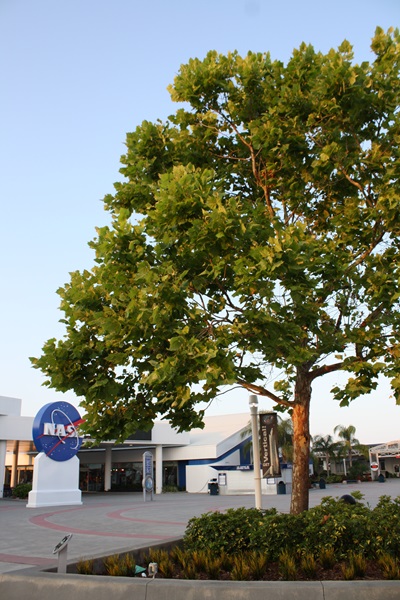
Apollo 14 launched in the late afternoon of January 31, 1971, on what was to be our third trip to the lunar surface. Five days later, Alan Shepard and Edgar Mitchell walked on the Moon while Stuart Roosa, a former U.S. Forest Service smoke jumper, orbited above in the command module. Packed in small containers in Roosa’s personal kit were hundreds of tree seeds, part of a joint NASA/USFS project. Upon return to Earth, the seeds were germinated by the Forest Service. Known as the “Moon Trees,” the resulting seedlings were planted throughout the United States (often as part of the nation’s bicentennial in 1976) and the world. They stand as a tribute to astronaut Roosa and the Apollo program.
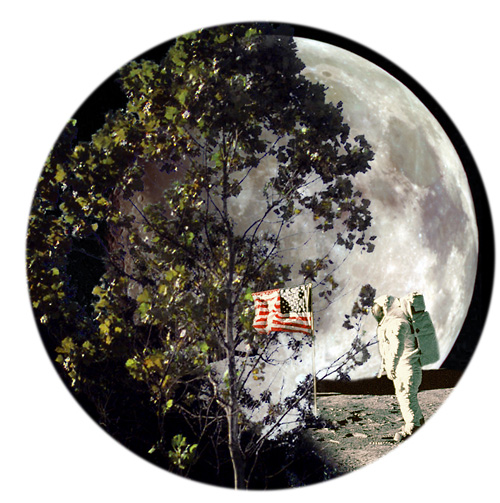
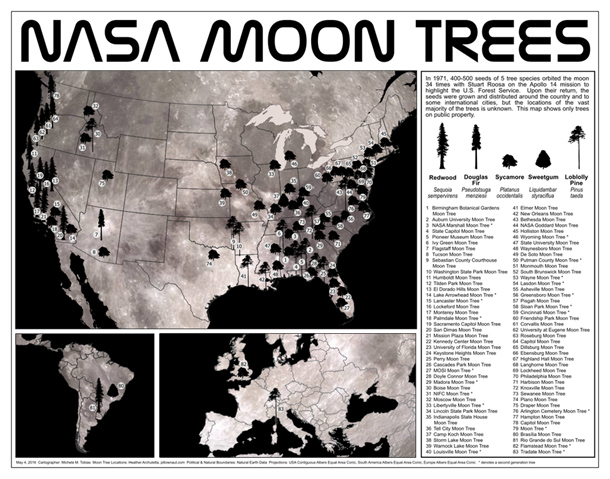
Among the Moon Trees that were eventually planted around the United States and the world were sycamores, Loblolly pines, redwoods, sweetgums, and Douglas firs. Though it is unlikely the Moon Tree seeds were changed much by their brief lunar orbit, it is still a wonder that they made it into space and back, and that many of the trees are growing and thriving today.
So, where can you find them? The NASA Moon Trees site has a list, and there is also an article and photographs from our friends at National Geographic. UC Davis data scientist Michele M. Tobias created the map below. You can also learn more about the trees from our colleagues at Marshall Space Flight Center.
Perhaps you might see some Moon Trees in person in the next year or two. If you do, consider making tree height observations using the tree tools on the NASA GLOBE Observer app. When completing your observation, let us know in the app.
Have you ever visited and seen a Moon Tree? Tell us about it below.

