Happy Solstice Day!
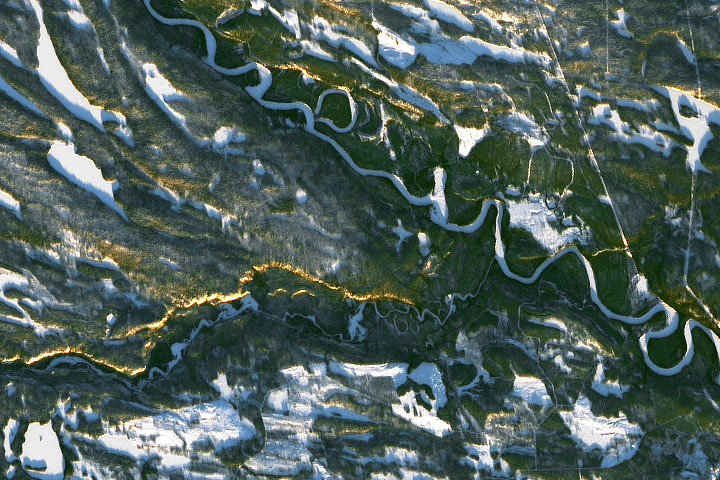
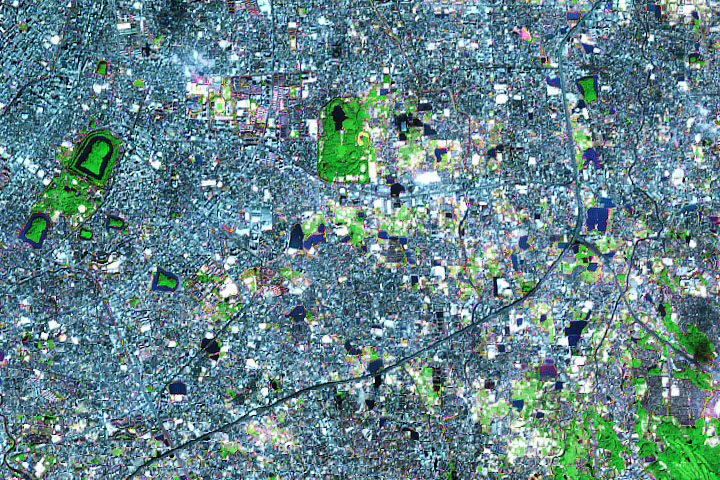
Every month on Earth Matters, we offer a puzzling satellite image. The December 2021 puzzler is shown above. Your challenge is to use the comments section to tell us where it is, what we are looking at, and why it is interesting. In particular this month, what is the golden line/streak across the image?
How to answer. You can use a few words or several paragraphs. You might simply tell us the location, or you can dig deeper and offer details about what satellite and instrument produced the image, what spectral bands were used to create it, or what is compelling about some obscure feature. If you think something is interesting or noteworthy, tell us about it.
The prize. We cannot offer prize money or a trip on the International Space Station, but we can promise you credit and glory. Well, maybe just credit. Within one week after a puzzler image appears on this blog, we will post an annotated and captioned version as our Image of the Day. After we post the answer, we will acknowledge the first person to correctly identify the image at the bottom of this blog post. We also may recognize readers who offer the most interesting tidbits of information. Please include your preferred name or alias with your comment. If you work for or attend an institution that you would like to recognize, please mention that as well.
Recent winners. If you’ve won the puzzler in the past few months, or if you work in geospatial imaging, please hold your answer for at least a day to give less experienced readers a chance.
Releasing Comments. Savvy readers have solved some puzzlers after a few minutes. To give more people a chance, we may wait 24 to 48 hours before posting comments. Good luck!
Update: The answer is the Sápmi region of Finland (formerly known as Lapland), not far from Oulanka National Park. You can read more here. Tom Franco correctly noted the low Sun angle (but it is not a sunset), while Frank correctly noted the proximity to the Arctic Circle.
NASA, the European Space Agency (ESA), and the Japan Aerospace Exploration Agency (JAXA) have joined forces to create the COVID-19 Earth Observation Dashboard. The web platform combines the collective scientific power of the agencies’ Earth-observing satellites to document changes in the environment and society in response to the pandemic.
The dashboard is a user-friendly tool to track changes in air and water quality, climate change, economic activity, and agriculture.
Air quality changes were among the first noticeable impacts of pandemic-related stay-at-home orders, and the resulting reductions in industrial activity, that could be tracked through satellite observations. Reductions in nitrogen dioxide (NO2) levels — primarily related to temporary reductions in the burning of fossil fuels — show up clearly in satellite data.
A preliminary analysis also indicates that planting (farming) activity dropped during the quarantines and lockdowns. For example, the cultivated area of white asparagus in Brandenburg, Germany, has been 20 to 30 percent lower this year, compared to 2019. More information on agricultural productivity changes will be added to the dashboard in the months to come.
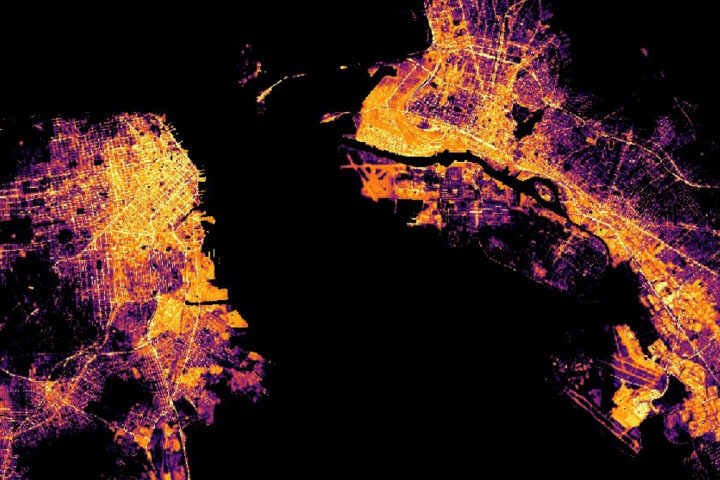
Recent water quality changes have been reported in a few locations that typically have intense industry and tourism — activities that have decreased during the pandemic. Data on ship identification, construction activity, and nighttime lights (above) are featured on the dashboard to keep track of some of the economic ramifications of the virus.
Together, ESA, JAXA, and NASA will continue to add new observations to the dashboard in the coming months to see how these indicators change. Learn more in the NASA press release, the video below, or by exploring the dashboard.
There have been two rounds of voting in Tournament Earth 2020, and two rounds of stunning upsets. Only two of the top eight seeds made it through. Night Lights? Snuffed out. Colorado River? Dried up. Caspian ice? Melted. Aerosols? Cleaned out. A river of tea? Gone cold. Dark side of the Moon? Someone broke the record. Iconic Earthrise? Didn’t make it to dawn.
Every time we run one of these tournaments, we are surprised by what catches the eyes of our readers. It is time to surprise us again. Cast your votes now in round three to pick the best four of the Earthly 8. Voting ends on April 13 at 9 a.m. U.S. Eastern Time. Check out the remaining competitors below.
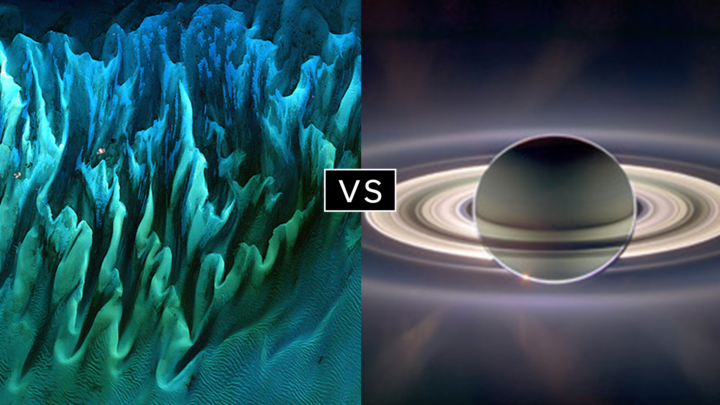
In round 1, Ocean Sand garnered the most votes overall and wiped out #4 seed and 2014 champion El Hierro Submarine Eruption, winning by the largest margin of any pairing (81 to 19 percent). In round 2, Sand beat the #1 seed, The Dark Side and the Bright Side, by a 57 to 43 percent margin.
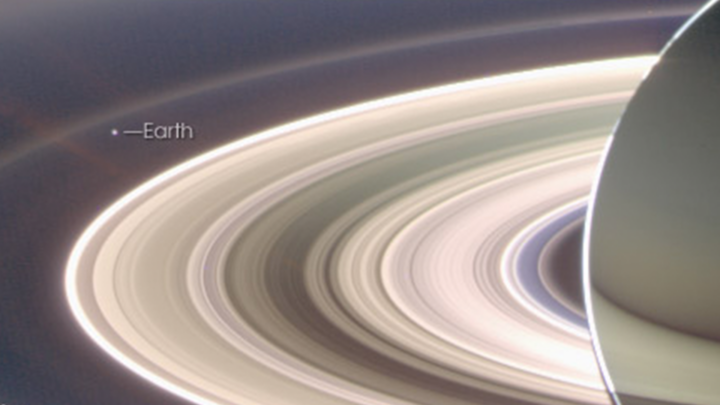
A View from Saturn garnered the second highest vote total in round 1, besting Blooming Baltic Sea by 77 to 23 percent. In the second round, Saturn beat Sensing Lightning from the Space Station, 60 to 40 percent. In case you didn’t notice, Earth is visible in that Saturn image.
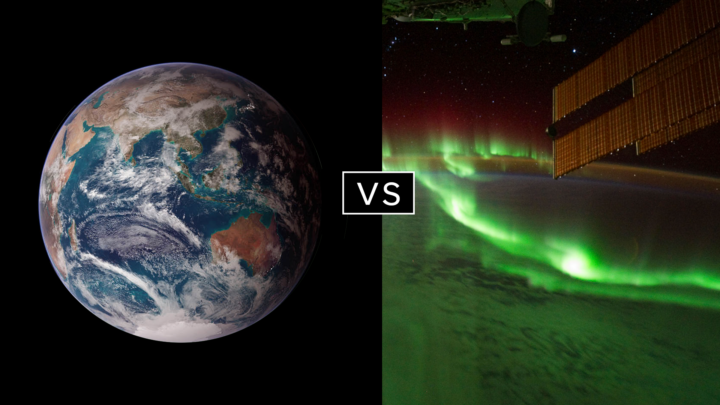
Twin Blue Marbles is the only #1 seed left in the tournament. In round 1, it captured 71 percent of the vote while besting Auroras Light Up the Antarctic Night. In round 2, Blue Marbles was the top overall vote getter and beat the iconic A Voyager Far from Home by 66 to 34 percent.
Fire in the Sky and On the Ground has pulled off two massive upsets. In round 1, it beat #2 seed Night Light Maps Open Up New Applications, 71 to 29 percent. In round 2, Fire beat the sentimental favorite and oldest image in Tournament Earth, All of You on the Good Earth — the original Blue Marble photo (1968) and the inspiration for the first Earth Day (1970). The voters chose the auroral fire over Apollo 8 fame by 57 to 43 percent.
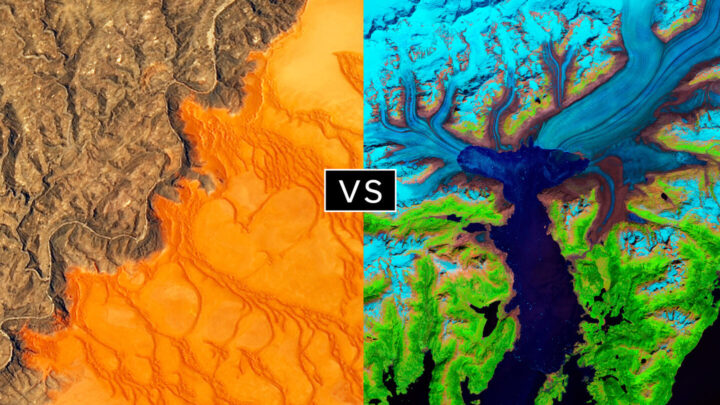
This bracket pairs two low seeds that knocked off highly ranked opponents. #8 seed Where the Dunes End topped #1 A Curious Ensemble of Wonderful Features in round 1 (63 to 37 percent), then topped #4 Roiling Flows on Holuhraun Lava Field (56 to 44).
The false-color image Retreat of the Columbia Glacier got 57 percent of the vote to beat Icy Art in the Sanikov Strait in round 1. Round 2 was a close call: Columbia barely eclipsed Antartica Melts Under the Hottest Days on Record (51 to 49 percent).
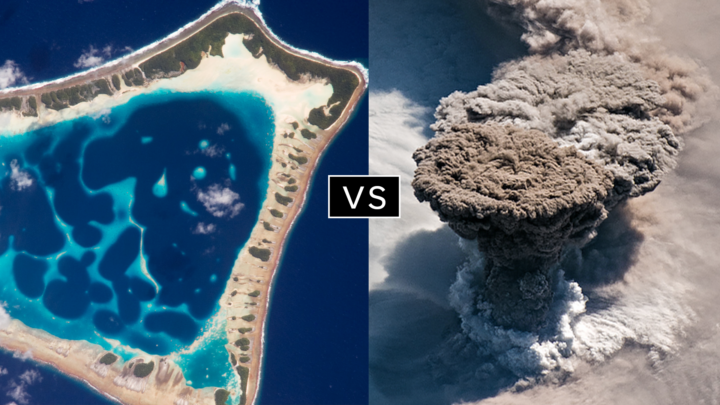
Another pair of Cinderella stories here. Atafu Atoll outclassed #1 seed Some Tea with Your River in round 1 by 75 to 25 percent. In round 2, it collected the second most votes overall, beating #5 Making Waves in the Andaman Sea 62 to 38 percent.
Raikoke erupted in round 1, collecting 72 percent of the vote while beating #3 Awesome, Frightening View of Hurricane Florence. In round 2, the volcanic plume smothered #2 Just Another Day on Aerosol Earth, 61 to 39 percent.
Every month on Earth Matters, we offer a puzzling satellite image. The November 2019 puzzler is above. Your challenge is to use the comments section to tell us what we are looking at, where it is, and why it is interesting.
November 2019 puzzler is above. Your challenge is to use the comments section to tell us what we are looking at, where it is, and why it is interesting.
How to answer. You can use a few words or several paragraphs. You might simply tell us the location. Or you can dig deeper and explain what satellite and instrument produced the image, what spectral bands were used to create it, or what is compelling about some obscure feature in the image. If you think something is interesting or noteworthy, tell us about it.
The prize. We can’t offer prize money or a trip to Mars, but we can promise you credit and glory. Well, maybe just credit. Roughly one week after a puzzler image appears on this blog, we will post an annotated and captioned version as our Image of the Day. After we post the answer, we will acknowledge the first person to correctly identify the image at the bottom of this blog post. We also may recognize readers who offer the most interesting tidbits of information about the geological, meteorological, or human processes that have shaped the landscape. Please include your preferred name or alias with your comment. If you work for or attend an institution that you would like to recognize, please mention that as well.
Recent winners. If you’ve won the puzzler in the past few months or if you work in geospatial imaging, please hold your answer for at least a day to give less experienced readers a chance.
Releasing Comments. Savvy readers have solved some puzzlers after a few minutes. To give more people a chance, we may wait 24 to 48 hours before posting comments.
Good luck!
See our “A Burial Site Fit for an Emperor“ Image of the Day for the answer.
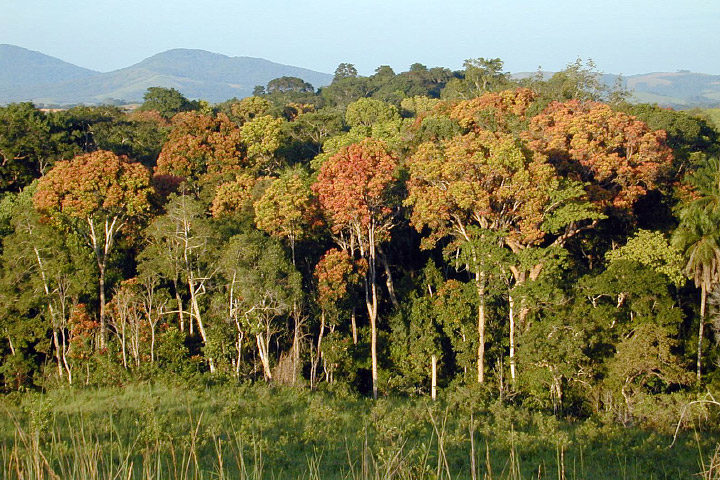
Tropical forests, such as those in Gabon, Africa, are an important reservoir of carbon. (Photography courtesy of Sassan Saatchi, NASA/JPL-Caltech.)
Old-growth forests are vital because they capture large amounts of carbon and provide homes to hundreds of species. In the Eastern United States, trees in these minimally disturbed ecosystems tend to be more than 120 years old.
Can satellites help pinpoint this “old-growth” and quantify its value? That was the question Joan Maloof posed to a group of researchers during a talk at NASA Goddard Space Flight Center in May 2017. As head of the Old-Growth Forest Network and a professor at Salisbury University, Maloof aims to identify stands of old-growth forests for conservation. A large part of her job involves explaining why these areas are important—something satellite data can help show.
As it turns out, satellites have already told us much about trees. A 2012 story from NASA Earth Observatory described some of the remote sensing methods researchers use:
Scientists have used a variety of methods to survey the world’s forests and their biomass. […] With satellites, they have collected regional and global measurements of the “greenness” of the land surface and assessed the presence or absence of vegetation, while looking for signals to distinguish trees from shrubs from ground cover.
In January 2017, a paper in Science Advances tracked intact forest landscapes between 2000 and 2013. (Intact forest landscapes were defined as areas larger than 500 square kilometers with no signs of human activity in Landsat imagery). This new research underscores the importance of such landscapes. The study’s authors identified several key findings:
For more information on trees and satellites, check out the NASA Earth Observatory feature, “Seeing Forests for the Trees and the Carbon: Mapping the World’s Forests in Three Dimensions.”
Bigger isn’t necessarily better—at least where satellites are concerned. Modern “CubeSat” satellites are smaller and more numerous than ever.
The CubeSat takes its name from its dimensions; it is made up of multiples of 10×10×11 centimeter cubic units. A basic CubeSat weighs roughly 3 pounds (1.3 kilograms) and looks a good deal like a portable speaker.
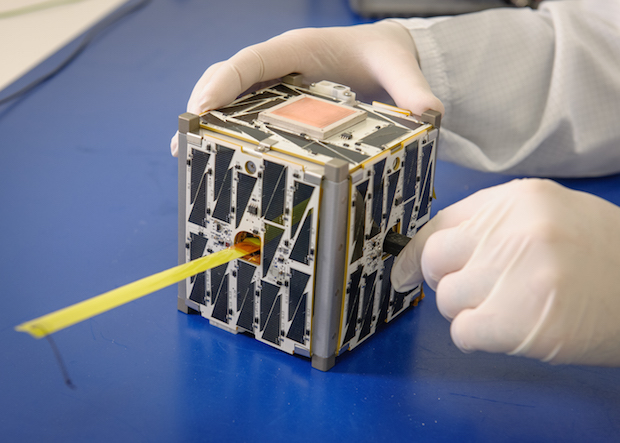
Image by NASA Ames.
BACK TO THEIR ROOTS
Early satellites started out small, too. Launched in 1957, Sputnik weighed around 184 pounds (83 kilograms). America’s first satellite, Explorer I, weighed just under 31 lbs (14 kg). Then, as the desire for more sensors grew, so did the size of satellites. The first American weather satellite, TIROS I, was a hefty 270 lbs (122 kg). But recent years have seen a reversal of this trend.
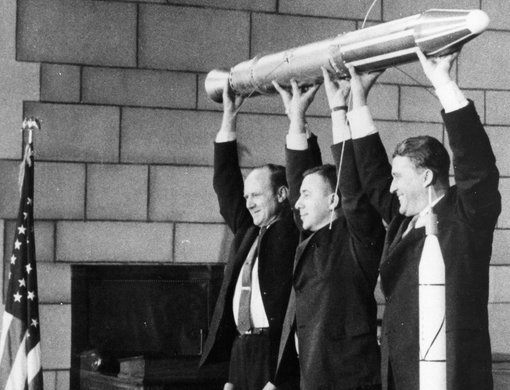
Explorer I. Image by NASA.
Like modern cell phones, satellites have benefited from more compact and more powerful computing technology. (A 1980s cell phone was an expensive, brick-sized gadget that could only place phone calls and store a couple dozen numbers.) Satellites, too, have sprouted new cameras and sensors. Take the IPEX CubeSat developed by NASA’s Jet Propulsion Laboratory (45 seconds into the video below); it can track features like forest fires, volcanic eruptions, and algae blooms.
THE UPSIDES OF BEING SMALL
A satellite today can be a “hitchhiker,” aboard a larger mission, as the video below mentions. Or, a CubeSat can be launched from the International Space Station.
Because they are smaller, CubeSats tend to cost less, so research organizations can deploy more of them. That means more spatial coverage for monitoring the Earth. Where researchers once relied on two or three larger satellites to keep an eye on weather over the Pacific Ocean, now, handfuls of smaller satellites can help with the job.
NASA is not the only organization that builds CubeSats. The space agency has delivered little satellites made by private companies, college students, and even grade school students.
To learn more, watch the video below. Or read more here.
