From Wisconsin to Washington D.C., pollen counts were quite high this spring, making seasonal allergies brutal for many people. Recent research shows that changes in the onset of spring—both early and late—can extend allergy misery and lead to more severe asthma for some people.
Warm springtime temperatures signal shrub buds to burst, trees to leaf-out, and flowers to bloom. As plants produce and release pollen, our bodies can mistakenly identify it as a dangerous intruder to our respiratory systems. Our immune systems produce chemicals to fight it, inducing sneezing, watery eyes, and stuffy noses. Research also shows allergenic pollen is also among the leading risk factors known to worsen asthma.
Amir Sapkota, a professor of public health at the University of Maryland, and his colleagues investigated how changes in the timing of spring onset affected asthma hospitalizations in Maryland over the past decade. The team used the Normalized Difference Vegetation Index (NDVI), which shows the relative “greenness” of vegetation, to determine the timing of the spring onset. (The data come from the Moderate Resolution Imaging Spectroradiometer (MODIS) on NASA’s Aqua and Terra satellites.) The team combined the satellite data with pollen counts and inpatient hospital admissions from the Maryland Department of Health.
They found that very early onset of spring (10 days early) was associated with a 17 percent increase in asthma hospitalizations in Maryland from 2001-2012, while late onset (3 days later) was associated with a 7 percent increase.
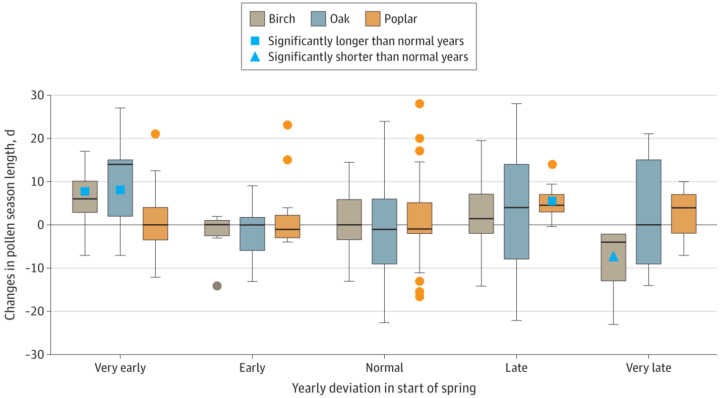
Sapkota explained that the hospitalization risk increased because of changes in pollen dynamics. Tree pollen is common in spring, while grass and weed pollen are more common during summer and fall. According to Sapkota, an early onset of spring leads to earlier and longer tree pollen seasons. At the other end, late onset causes different species of trees to bloom at the same time, thus increasing overall pollen levels in the environment. Both scenarios can lead to increases in asthma hospitalizations.
harmony: 1. A pleasing arrangement of parts. 2. An interweaving of different accounts into a single narrative. (Merriam-Webster Online Dictionary)
The Operational Land Imager (OLI) aboard the Landsat 8 satellite and the Multi-Spectral Instrument (MSI) aboard the Sentinel-2A and Sentinel-2B satellites tell two slightly different stories of Earth. OLI fully images the planet’s land surfaces every sixteen days at 30-meter resolution. MSI images Earth with repeat coverage every five days at 10- to 20-meter resolution.
But what if you could combine, or harmonize, these two data stories into a single narrative? With the provisional release of the Harmonized Landsat Sentinel-2 (HLS) dataset, NASA, the U.S. Geological Survey, and the European Space Agency have done just that. By combining OLI and MSI data—processing it to be used together as if it all came from a single instrument on one satellite—scientists have created global land surface products at 30-meter spatial resolution that are refreshed every two to three days.
“Our definition of ‘harmonized’ is that observations should be interchangeable for common [spectral] bands,” says Jeff Masek, the HLS principal investigator and Landsat 9 project scientist. “By harmonizing the datasets and making the corrections so that it appears to the user that the data are coming from a single platform, it makes it easier for a user to put these two datasets together and get that high temporal frequency they need for land monitoring.”
Two provisional surface reflectance HLS products are available through NASA’s Earthdata Search and NASA’s Land Processes Distributed Active Archive Center (LP DAAC): the Landsat 30-meter (L30) product (doi:10.5067/HLS/HLSL30.015) and the Sentinel 30-meter (S30) product (doi:10.5067/HLS/HLSS30.015). HLS imagery also is available through NASA’s Global Imagery Browse Services (GIBS) for interactive exploration using the NASA Worldview data visualization application.
The HLS image-processing algorithm was initially developed by a team at NASA’s Goddard Space Flight Center starting in 2013, with test versions released in 2015, 2016, and 2017. Even though HLS was still in the prototype stage and covered just 28 percent of Earth’s land surface, the team saw immediate and clear value for the scientific community. The project was scaled up from 28 percent to nearly 100 percent of Earth’s land surface (minus Antarctica) in 2019 by NASA’s Interagency Implementation and Advanced Concepts Team (IMPACT) at NASA’s Marshall Space Flight Center.
The HLS dataset is optimized for use in the Amazon Web Services commercial cloud environment; hosting it in the cloud has significant benefits for data users. “We’re really trying to take data analysis to the next level where we’re able to provide this large-scale processing without large-scale computing requirements,” says Brian Freitag, the HLS project manager at IMPACT. “For example, if you want to look at all the HLS data for a particular plot of land at the 30-meter resolution provided by HLS, you can do this using your laptop. Everything is in cloud-optimized GeoTIFF format.”
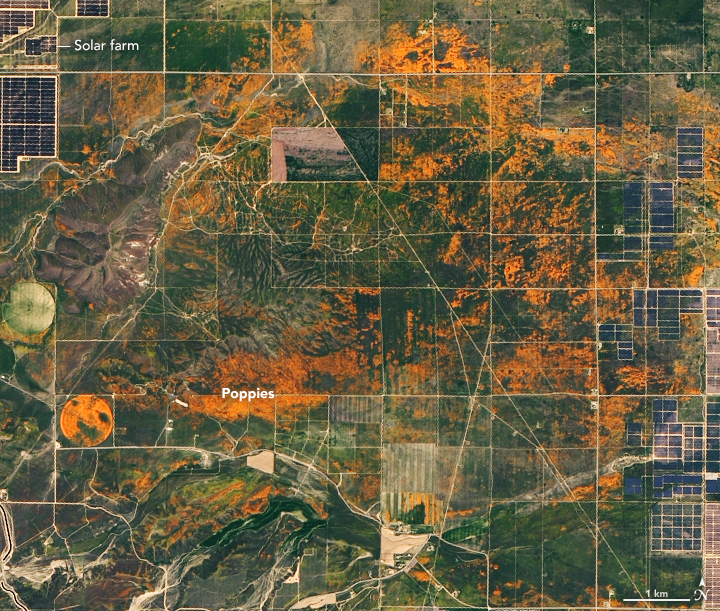
The harmonious combination of the OLI and MSI stories is opening new avenues of terrestrial research. A principal HLS application area will be agriculture, including studies of vegetation health; crop development, management, and identification; and drought impacts. HLS data also are being used in a new vegetation seasonal cycle dataset available through LP DAAC.
Global, 30-meter coverage every two to three days? The ability to access and work with years of Landsat and Sentinel imagery in the commercial cloud? That’s a harmonious arrangement the scientific community is eager to explore.
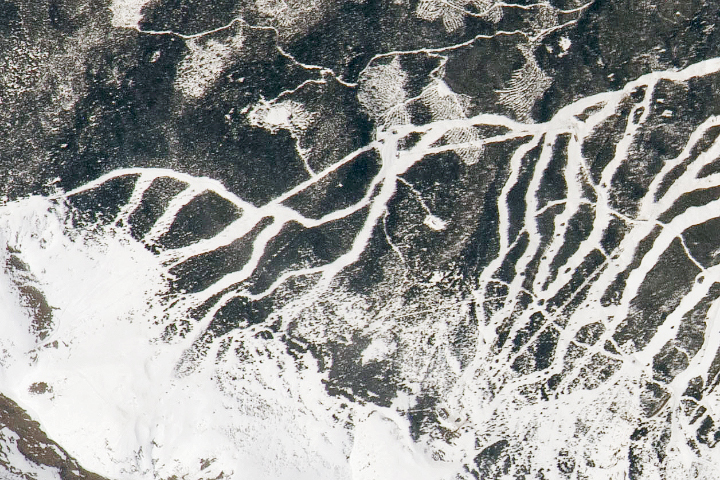
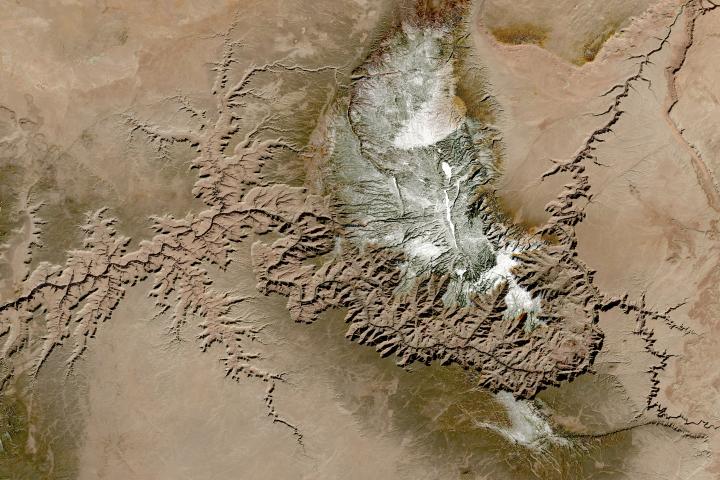
UPDATE on May 17, 2021 — This puzzling image shows part of Breckenridge Ski Resort in Colorado’s Tenmile Range. Congratulations to Steve Bassett, who guessed the correct location and deduced that the photo was shot from the International Space Station. The detailed view pictured here shows the resort’s newer slopes, which opened to skiers and snowboarders for the 2013-2014 winter season. See the full image and story in our Image of the Day, published on May 15.
Every month on Earth Matters, we offer a puzzling satellite image. The May 2021 puzzler is above. Your challenge is to use the comments section to tell us what we are looking at, where it is, and why it is interesting.
How to answer. You can use a few words or several paragraphs. You might simply tell us the location, or you can dig deeper and explain what satellite and instrument produced the image, what spectral bands were used to create it, or what is compelling about some obscure feature. If you think something is interesting or noteworthy, tell us about it.
The prize. We cannot offer prize money or a trip to Mars, but we can promise you credit and glory. Well, maybe just credit. Roughly one week after a puzzler image appears on this blog, we will post an annotated and captioned version as our Image of the Day. After we post the answer, we will acknowledge the first person to correctly identify the image at the bottom of this blog post. We also may recognize readers who offer the most interesting tidbits of information about the geological, meteorological, or human processes that have shaped the landscape. Please include your preferred name or alias with your comment. If you work for or attend an institution that you would like to recognize, please mention that as well.
Recent winners. If you’ve won the puzzler in the past few months, or if you work in geospatial imaging, please hold your answer for at least a day to give less experienced readers a chance.
Releasing Comments. Savvy readers have solved some puzzlers after a few minutes. To give more people a chance, we may wait 24 to 48 hours before posting comments. Good luck!
Through May 15, 2021, the GLOBE Program is hosting the 2021 Trees Community Challenge, a project aimed at making science better together by encouraging participants to collect data and learn about trees.
Using the Trees Challenge Activity Tracker, participants can pick and choose activities – or complete all of them – to become members of the NASA citizen science community. Activities include taking a tree height observation, writing a tree poem, and sharing stories about trees that are special to you on social media
Trees are diverse and tree height can tell us a lot about Earth’s ecosystems. Satellites and ground-based measurements are used to track tree growth, monitor how well an ecosystem supports trees, and estimate how much carbon is stored by trees. The GLOBE community encourages #CitizenScientists to use the GLOBE Observer app to take tree height measurements with their smartphones.
Read more about the challenge and how to participate.

Lake Van is one of the largest alkaline lakes on Earth, but today it has another superlative: Tournament Earth 2021 champion.
This year, readers, astronauts, and NASA staff chose 32 photos — shot by the astronauts from the International Space Station — to compete in our tournament. Lake Van was slotted as a #8 seed, but knocked out higher seeded fishing boat lights (#1 seed), Elba at night (#4), Typhoon Maysak (#2), the castellanus cloud tower (#6), and finally Stars in Motion (#3) to win the crown. Across the five rounds, more than 930,000 ballots were cast, a record in the history of our Tournament Earth competitions.
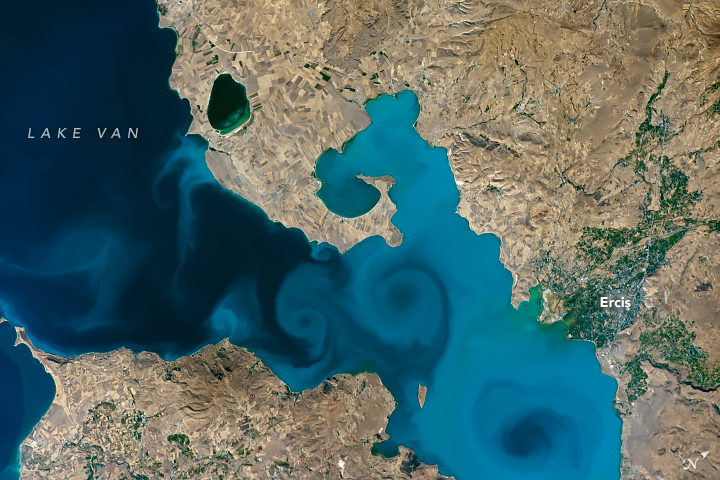
The winning image, showing a northeastern portion of the lake, was shot by astronaut Kate Rubins while orbiting on the space station in September 2016. Lake Van is an endorheic lake—it has no outlet, so its water disappears by evaporation—with a pH of 10 and high salinity levels. Turbidity plumes, which appear as swirls of light- and dark-toned water, are mostly comprised of calcium carbonate, detritus, and some organic matter. The lake is also the largest water body in Turkey.
Lake Van also has quirkier characteristics. According to legend, it is the home for a lake monster popularized in Turkish folklore. Akin to the Loch Ness monster, the Lake Van monster is rumored to look like an ancient marine reptile such as a plesiosaur. No monster-like creature has been confirmed, although archeologists have found parts of a 3,000-year-old castle buried under the lake’s waters.
The Lake Van region is also home to a special cat breed known as the Van cat. The felines have been seen swimming in Lake Van and are known for their almond-shaped eyes, often of different colors.
For the past five weeks, the competition has caught the eye of several Turkish news outlets, government officials, and Turkish citizens expressing love for their home. Other readers liked the photo due the simple beauty as a single photograph. The mayor of Van has since invited astronaut Rubins to visit.
The tournament may be over, but be sure to come back as we bring you a new view of our home planet every day of the year. If you really like astronaut photos, come back for a new one every weekend. To view other photos shot from the space station, visit the EO Astronaut Photography Collection and the Gateway to Astronaut Photography of Earth.
If you want to learn about the experience of observing the Earth from the International Space Station or about how astronauts are trained to observe our planet, watch our Picturing Earth video series above.
Thank you for voting in this year’s #TournamentEarth. We hope to bring you more competitions like this in future months and years.
Five decades ago, NASA and the U.S. Geological Society launched a satellite to monitor Earth’s landmasses. The Apollo era had given us our first look at Earth from space and inspired scientists to regularly collect images of our planet. The first Landsat — originally known as the Earth Resources Technology Satellite (ERTS) — rocketed into space in 1972. Today we are preparing to launch the ninth satellite in the series.
Each Landsat has improved our view of Earth, while providing a continuous record of how our home has evolved. We decided to examine the legacy of the Landsat program in a four-part series of videos narrated by actor Marc Evan Jackson (who played a Landsat scientist in the movie Kong: Skull Island). The series moves from the birth of the program to preparations for launching Landsat 9 and even into the future of these satellites.
Episode 1: Getting Off the Ground
The soon-to-be-launched Landsat 9 is the intellectual and technical successor to eight generations of Landsat missions. Episode 1 answers the “why?” questions. Why did space exploration between 1962 and 1972 lead to such a mission? Why did the leadership of several U.S. government agencies commit to it? Why did scientists come to see satellites as important to advancing earth science? In this episode, we are introduced to William Pecora and Stewart Udall, two men who propelled the project forward, as well as Virginia Norwood, who breathed life into new technology.
Episode 2: Designing for the Future
The early Landsat satellites carried a sensor that could “see” visible light, plus a little bit of near-infrared light. Newer Landsats, including the coming Landsat 9 mission, have two sensors: the Operational Land Imager (OLI) and the Thermal Infrared Sensor (TIRS). Together they observe in visible, near-infrared, shortwave-infrared, and thermal infrared wavelengths. By comparing observations of different wavelengths, scientists can identify algal blooms, storm damage, fire burn scars, the health of plants, and more.
Episode 2 takes us inside the spacecraft, showing how Landsat instruments collect carefully calibrated data. We are introduced to Matt Bromley, who studies water usage in the western United States, as well as Phil Dabney and Melody Djam, who have worked on designing and building Landsat 9. Together, they are making sure that Landsat continues to deliver data to help manage Earth’s precious resources.
Episode 3: More Than Just a Pretty Picture
The Landsat legacy includes five decades of observations, one of the longest continuous Earth data records in existence. The length of that record is crucial for studying change over time, from the growth of cities to the extension of irrigation in the desert, from insect damage to forests to plant regrowth after a volcanic eruption. Since 2008, that data has been free to the public. Anyone can download and use Landsat imagery for everything from scientific papers to crop maps to beautiful art.
Episode 3 explores the efforts of USGS to downlink and archive five decades of Landsat data. We introduce Mike O’Brien, who is on the receiving end of daily satellite downloads, as well as Kristi Kline, who works to make Landsat data available to users. Jeff Masek, the Landsat 9 project scientist at NASA, describes how free access to data has revolutionized what we are learning about our home planet.
Episode 4: Plays Well With Others
For the past 50 years, Landsat satellites have shown us Earth in unprecedented ways, but they haven’t operated in isolation. Landsat works in conjunction with other satellites from NASA, NOAA, and the European Space Agency, as well as private companies. It takes a combination of datasets to get a full picture of what’s happening on the surface of Earth.
In Episode 4, we are introduced to Danielle Rappaport, who combines audio recordings with Landsat data to measure biodiversity in rainforests. Jeff Masek also describes using Landsat and other data to understand depleted groundwater.
Learn more about the Landsat science team at NASA.
Learn more about the Landsat program at USGS.
View images in our Landsat gallery.
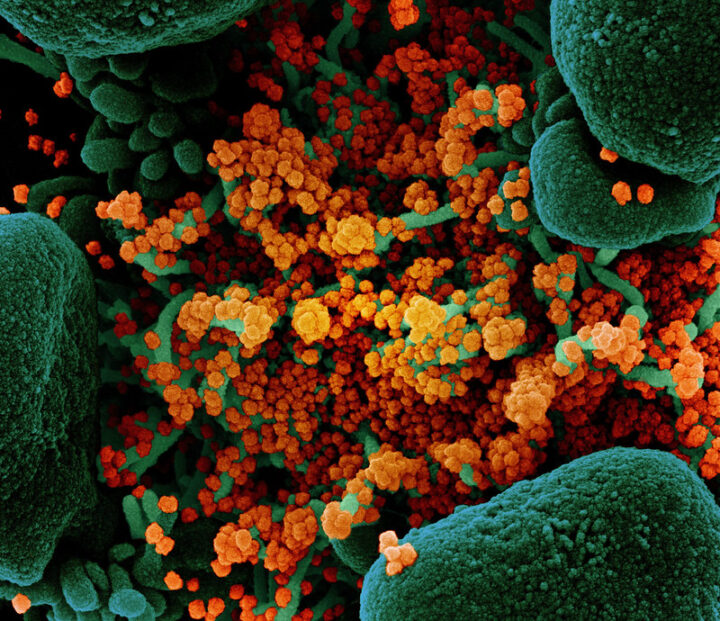
According to a new report from the World Meteorological Organization, seasonal weather conditions have not yet played a large role in influencing the spread of the virus that causes COVID-19. Government interventions and human behavior have been much more influential, according to the group of experts in Earth science, medical sciences, and public health.
“We saw waves of infection rise in warm seasons and warm regions in the first year of the pandemic, and there is no evidence that this couldn’t happen again in the coming year,” said Ben Zaitchik, the co-chair of the World Meteorological Organization team and a Johns Hopkins University earth scientist. At the start of the pandemic, there was some speculation that seasonal weather could influence the spread of COVID-19, with the virus spreading more readily in cooler, drier weather and spreading less in warmer, wetter seasons. “At this stage, evidence does not support the use of meteorological and air quality factors as a basis for governments to relax their interventions aimed at reducing transmission.”
Zaitchik also leads a NASA-funded team assessing the same topic. As we reported in August, that team is using weather reanalysis models and various statistical techniques to look for signals in satellite data and other sources of environmental data. Their goal is to detect potential relationships between environmental conditions (such as temperature, humidity, ultraviolet light, and rainfall) and the spread and severity of COVID-19.
Zaitchik recently published an article in Nature Communications that urges the research community to strive for rigor in designing studies on COVID-19 seasonality and for clarity in communicating findings so as to avoid confusing the public and policymakers with conflicting results. We checked in with Ben in March 2021 for an update on his research as COVID-19 cases were dropping in the United States and other countries.
Earth Observatory: The number of COVID-19 cases has been on quite a roller-coaster ride this year. What are the main drivers of the ups and downs in infection rates?
Zaitchik: It is pretty clear that the primary driver is still human behavior. When we stay home and stay socially distant, there is less transmission. That explains the biggest swings we’ve seen in the case curve in the United States and in other countries. As we see vaccines roll out in some countries, along with accumulating infections, we are likely also seeing the beginnings of herd immunity playing a role.

EO: We saw a surge of cases in the United States in the early part of winter and then a drop in February. Is that related to the weather?
Zaitchik: There are direct ways that weather might affect virus survival or our immune systems, but the most important effect now is indirect. If weather conditions make it easy for people to stay outside and to avoid crowding, then it is possible the weather can reduce transmission rates; vice versa if people are crowding indoors. That understanding is based on our experience with other upper respiratory viruses; on studies that show the potency of transmission in crowded indoor environments; and to some extent statistical analyses of patterns we have seen in the first year of COVID-19. But that last line of evidence still requires investigation. While the number of cases can sometimes align with seasonal patterns, that is not always the case. It does appear that weather conditions can reinforce case trends, but the impact of weather is still highly uncertain.
EO: Is it fair to say that how people behave in cooler, drier seasonal conditions is probably more important than how the virus reacts to the environment?
Zaitchik: It does appear that virus sensitivities exist. Coronaviruses are less stable at higher temperatures, when exposed to intense sunlight, and under certain humidity conditions. It is just not clear yet whether those sensitivities have mattered appreciably for transmission of COVID-19 so far. In general, those sensitivities suggest there are better chances for the virus to survive and thrive under wintertime conditions, leading to greater transmission potential. But in the end, the main driver of the spread is human behavior.
EO: How is your NASA-funded research project on COVID-19 seasonality going? Do you have any results yet?
Zaitchik: We have made a lot of progress on data integration and alignment, which has allowed us to release a consistent and quality-controlled database of COVID cases and hydrometeorological variables that is available to the public via GitHub. We think this is really important for studies of weather and COVID-19 since so many studies have suffered from questionable data or have been unrepeatable. We’ve also begun to understand why there were so many conflicting results in early publications on COVID’s weather sensitivity, and how the contribution of human movement to predictability of transmission rate has changed over time.
EO: How has your thinking changed about the potential seasonality of COVID-19 since the beginning of the pandemic?
Zaitchik: It hasn’t really changed much. Going into this, epidemiologists anticipated that we might see something like a cold weather peak in transmission just because so many other upper respiratory viruses do that. But we also knew that our instincts on seasonality come from endemic diseases like influenza, and that there is plenty of evidence from previous epidemics that viruses can spread even when the weather is unfavorable. That we are seeing some evidence of seasonality — but with lots of unexplained variability — is reasonably consistent with what epidemiologists expected.
EO: Americans are most familiar with how the pandemic has progressed in this country, while satellites excel at showing a global perspective. What are you seeing and learning from global data?
Zaitchik: The global perspective is really important. From a weather and COVID-19 perspective, we have seen interesting hemispheric patterns. For instance, there is some evidence that Southern Hemisphere countries experienced a peak in their winter, while Northern Hemisphere cases rose as our winter settled in. But there are also exceptions to that pattern, like the summertime peak in the US or the consistently low case counts in east Asian countries. Looking at the environment across countries and climate zones, we see a complicated, multi-scale set of patterns that we need to decipher. The global perspective is powerful because it has the potential to yield some general insights. It is also powerful because it can correct some too-simple narratives that have emerged from looking at one country at a time.
It is that time of year again…Tournament Earth is back! This time, the theme is astronaut photography. For more than 20 years, astronauts have been shooting stunning photos of Earth from the International Space Station that highlight the planet’s beauty, complexity, and vulnerabilities.
So which are the most unforgettable photographs of Earth taken from the space station? Over the next five weeks (March 8-April 13), you can help decide.
The first round has already begun. Cast your vote here: https://earthobservatory.nasa.gov/te
While you wait for the Round 1 results, download the bracket here and challenge your friends. After you fill out that bracket, post your predictions in the comment thread for which four photos will make the semifinals and which one will be crowned champion. We can’t offer prize money or a trip to the Moon, but bragging rights are forever if you can guess the eventual champion.
Also, bookmark this space. We will provide updates later in the tournament and highlight some of your predictions, commentary, and insights lower in the post. Just remember to use the hashtag #TournamentEarth and tag @NASAEarth on social media (we’re on Twitter, Facebook and Instagram) or we might not see your post.
If you are curious about the team behind the photos you see in Tournament Earth, check out our Picturing Earth video series.
Happy voting!
On February 18, 2021, the Perseverance rover is scheduled to make a historic landing in Jezero Crater on Mars. The rover will survey the area and collect rock samples to send back to Earth. Even though no human has set foot inside the crater, researchers have some ideas of what to expect thanks to a similar landscape on Earth: Lake Salda.
You might not think a lake in southwestern Turkey has much in common with an impact crater on Mars, but the two basins contain similar mineralogy and geology. In fact, Lake Salda is the only known lake on Earth that contains carbonate minerals and depositional features (deltas) similar to those found at Jezero Crater, which is thought to have once contained a lake.

Briony Horgan, a planetary scientist at Purdue University and member of the Perseverance science team, and colleagues from the Istanbul Technical University traveled to Lake Salda in the summer of 2019 to study the shorelines and surrounding area. They aimed to get a better understanding of the microbial and geological processes at Lake Salda to help guide the search for life at Jezero.
Below are photographs taken by Horgan’s graduate student Bradley Garczynski at Lake Salda showing some features that the Perseverance team hopes to find at Jezero Crater.
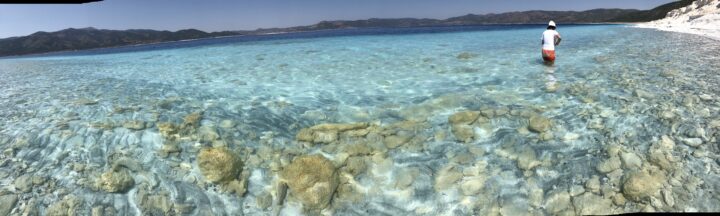
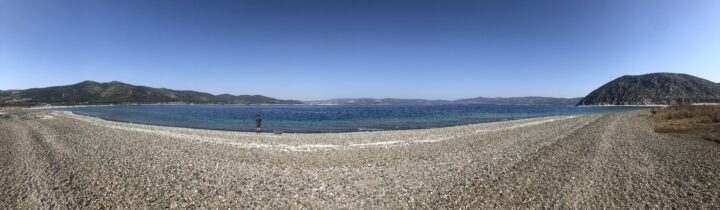
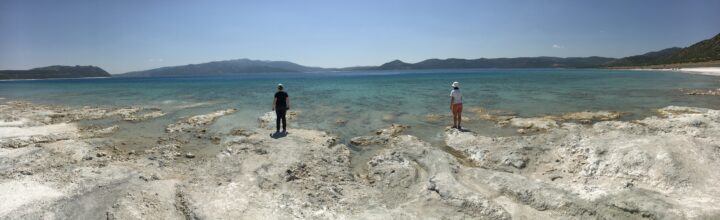
The shoreline and surrounding bedrock around Lake Salda contain sediments of different origins. The photo below shows beach sediments along the northeastern edge of the lake.
The darker-toned sediments were eroded from the steep exposures of the surrounding bedrock. The light-toned sediments are made up of the carbonate mineral hydromagnesite. You can also see the shallow carbonate bench (one to two meters thick) that extends about 40 meters offshore before steeply dropping off to deeper water.
Using data from NASA’s Mars Reconnaissance Orbiter, researchers detected a mixture of watershed minerals and possibly carbonate along the western margins of Jezero Crater, which scientists believe to be the shoreline of an ancient lake. Horgan and colleagues are interested to learn if these deposits are similar to those at Lake Salda.
Researchers are especially interested in the lighter sediments around Lake Salda because they could help inform the search for biosignatures — evidence of past or present life — at Jezero Crater.
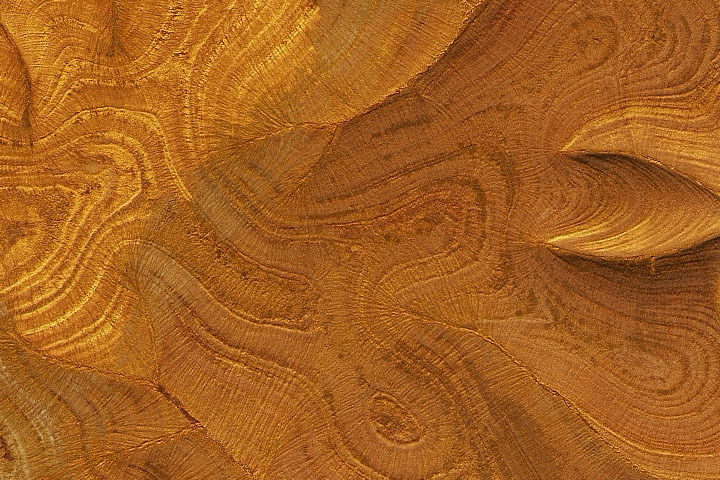
The hydromagnesite sediments around Lake Salda are thought to have eroded from large mounds called “microbialites”—rocks formed with the help of microbes. Hydromagnesite sediments may be similar to carbonate minerals detected at Jezero. The photo below shows an exposed island made up of large mounds of old microbialites at Lake Salda.
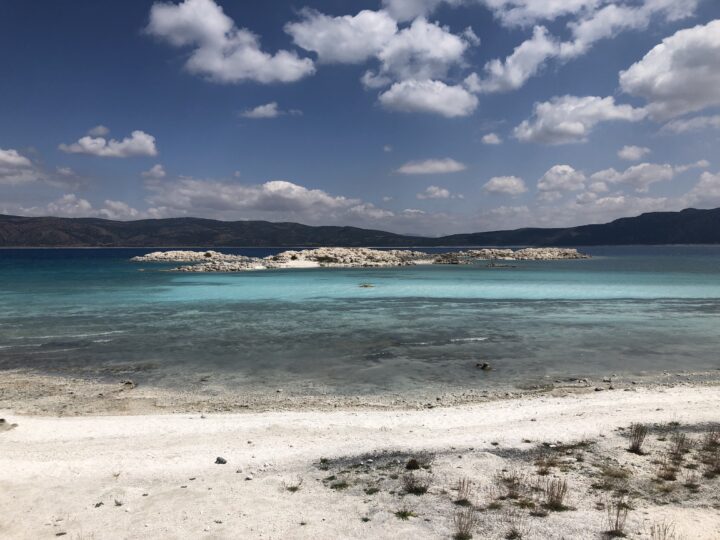
These structures themselves are good indicators that microbes were once active, so researchers will be looking for signs of these in rocks at the Martian crater.
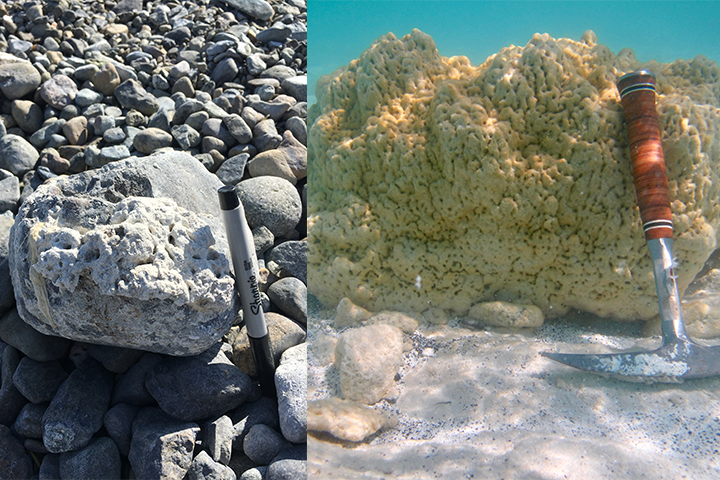
The images below show an older microbialite at Lake Salda that grew on the surface of a rock along the shore of an alluvial fan delta (left) and an underwater image of a modern microbialite at around one meter deep (right). The yellow-green film on the surface is made up of microbial communities that aid in the precipitation of hydromagnesite.
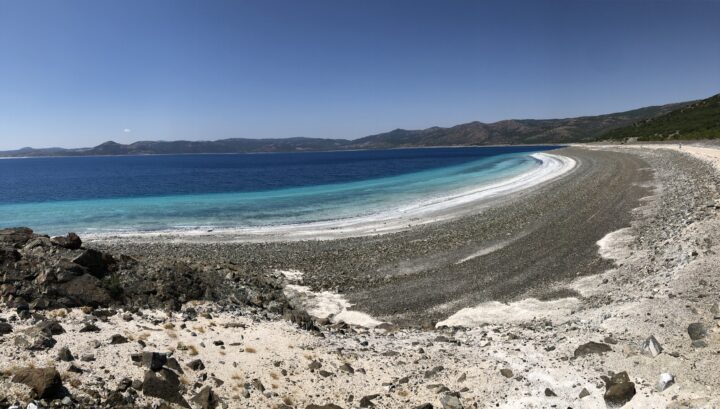
The delta near Jezero Crater adds to the evidence that it once contained a lake. Similarly, Lake Salda contains alluvial fans full of rock deposits eroded and washed down from the surrounding bedrock (shown below). By studying how stones settled in Lake Salda’s alluvial fans, the team can learn more about the depositional processes at Jezero.
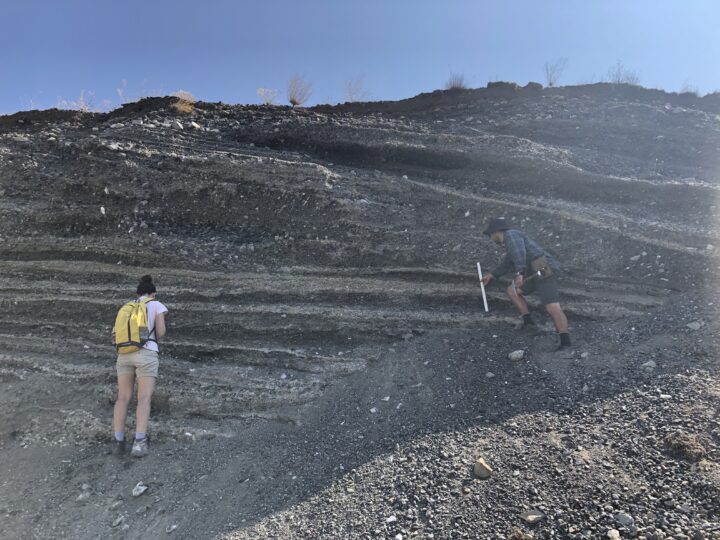
The image below shows an outcrop of sediment deposited by an ancient stream when the water levels were much higher around Lake Salda. The different layers represent different periods of deposition and include various grain types and sizes. The Perseverance rover will look for similar deposits at Jezero to learn more about its geologic history.
The image below shows a terrace deposit on the southwest peninsula of the lake.
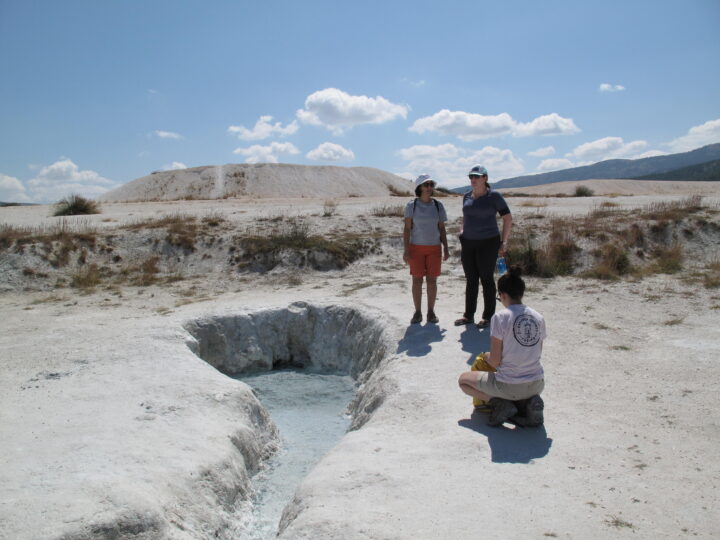
Groundwater springs at Lake Salda (shown below) play an important role in altering the lake chemistry and influencing the environment for microbes.
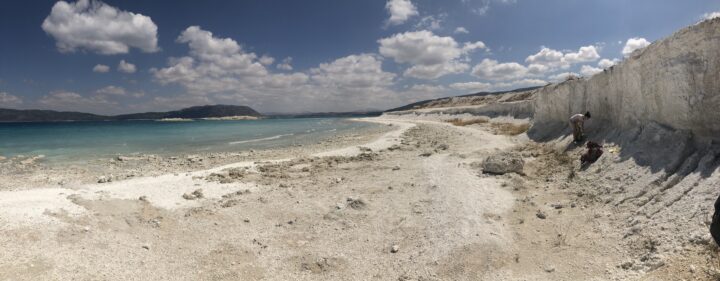
The image below shows a mud-dominated shoreline on the northeastern edge of Lake Salda. The mud is likely due to a nearby groundwater seep. The darker features just offshore are modern microbialites actively accreting in this muddy embayment.
It is unknown what role groundwater may have played at Jezero. Studying analog environments like Lake Salda helps provide researchers better context while looking for evidence of past groundwater at Jezero and further advance the search for potential biosignatures.
With these observations from Lake Salda, Horgan and her colleagues have been able to better focus their research questions. If microbes existed in the ancient Jezero lake, where did they live and build microbial structures? Where are the best places to search for past evidence of them: near groundwater springs? Near the delta? Or farther away in quiescent shorelines or muddy embayment?
The quest to answer these questions begins this month. Watch the Perseverance landing on February 18, 2021, at 11:15 a.m. PST / 2:15 p.m. EST live here.
Read more about the similarities between Lake Salda and Jezero Crater here.
Special thanks to Bradley Garczynski for helping provide the image descriptions.
Every month on Earth Matters, we offer a puzzling satellite image. The February 2021 puzzler is above. Your challenge is to use the comments section to tell us what we are looking at, where it is, and why it is interesting.
How to answer. You can use a few words or several paragraphs. You might simply tell us the location, or you can dig deeper and explain what satellite and instrument produced the image, what spectral bands were used to create it, or what is compelling about some obscure feature. If you think something is interesting or noteworthy, tell us about it.
The prize. We cannot offer prize money or a trip to Mars, but we can promise you credit and glory. Well, maybe just credit. A few days after a puzzler image appears on this blog, we will post an annotated and captioned version as our Image of the Day. After we post the answer, we will acknowledge the first person to correctly identify the image at the bottom of this blog post. We also may recognize readers who offer the most interesting tidbits of information about the geological, meteorological, or human processes that have shaped the landscape. Please include your preferred name or alias with your comment. If you work for or attend an institution that you would like to recognize, please mention that as well.
Recent winners. If you’ve won the puzzler in the past few months, or if you work in geospatial imaging, please hold your answer for at least a day to give less experienced readers a chance.
Releasing Comments. Savvy readers have solved some puzzlers after a few minutes. To give more people a chance, we may wait 24 to 48 hours before posting comments. Good luck!

