From Wisconsin to Washington D.C., pollen counts were quite high this spring, making seasonal allergies brutal for many people. Recent research shows that changes in the onset of spring—both early and late—can extend allergy misery and lead to more severe asthma for some people.
Warm springtime temperatures signal shrub buds to burst, trees to leaf-out, and flowers to bloom. As plants produce and release pollen, our bodies can mistakenly identify it as a dangerous intruder to our respiratory systems. Our immune systems produce chemicals to fight it, inducing sneezing, watery eyes, and stuffy noses. Research also shows allergenic pollen is also among the leading risk factors known to worsen asthma.
Amir Sapkota, a professor of public health at the University of Maryland, and his colleagues investigated how changes in the timing of spring onset affected asthma hospitalizations in Maryland over the past decade. The team used the Normalized Difference Vegetation Index (NDVI), which shows the relative “greenness” of vegetation, to determine the timing of the spring onset. (The data come from the Moderate Resolution Imaging Spectroradiometer (MODIS) on NASA’s Aqua and Terra satellites.) The team combined the satellite data with pollen counts and inpatient hospital admissions from the Maryland Department of Health.
They found that very early onset of spring (10 days early) was associated with a 17 percent increase in asthma hospitalizations in Maryland from 2001-2012, while late onset (3 days later) was associated with a 7 percent increase.
Sapkota explained that the hospitalization risk increased because of changes in pollen dynamics. Tree pollen is common in spring, while grass and weed pollen are more common during summer and fall. According to Sapkota, an early onset of spring leads to earlier and longer tree pollen seasons. At the other end, late onset causes different species of trees to bloom at the same time, thus increasing overall pollen levels in the environment. Both scenarios can lead to increases in asthma hospitalizations.
More than 20 years ago, NASA scientist Ralph Kahn authored a column for the Los Angeles Times anticipating the launch of a new satellite — and ultimately a whole fleet of satellites — that would study Earth.
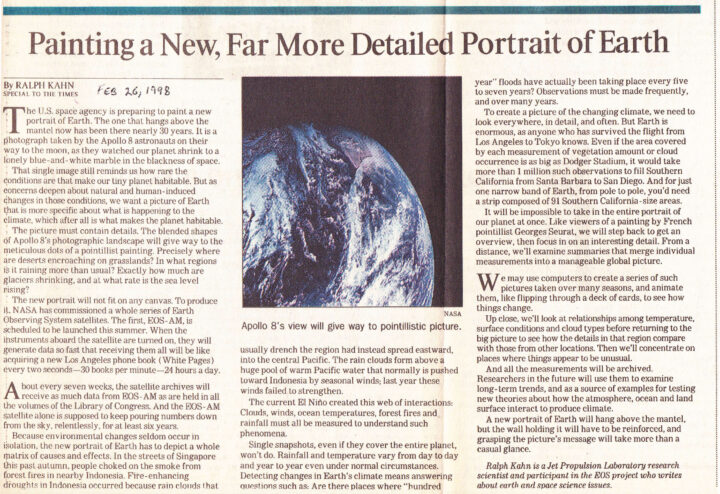
“We want a picture of Earth that is more specific about what is happening to the climate, which after all is what makes the planet habitable,” he wrote. And that picture needed to be rich with detail. “Precisely where are deserts encroaching on grasslands? In what regions is it raining more than usual? Exactly how much are glaciers shrinking, and at what rate is the sea level rising?” he asked.
The first satellite, Terra (originally named EOS-AM), roared into space on December 18, 1999, began collecting data in February and March 2000, and collected its first complete day of MODIS data on April 19, 2000.
“About every seven weeks, the satellite archives will receive as much data from EOS-AM as are held in all the volumes of the Library of Congress. And the EOS-AM satellite alone is supposed to keep pouring numbers down from the sky, relentlessly, for at least six years,” Kahn wrote.
Amazingly, all those numbers from Terra continue to pour down 20 years later. Over time, the flood of data from Terra and several other satellites has turned into scientific discoveries. Bit by bit, the questions Kahn initially posed in his column have been answered.
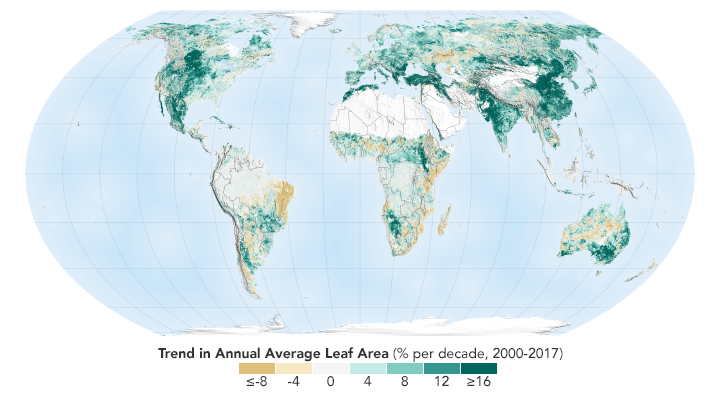
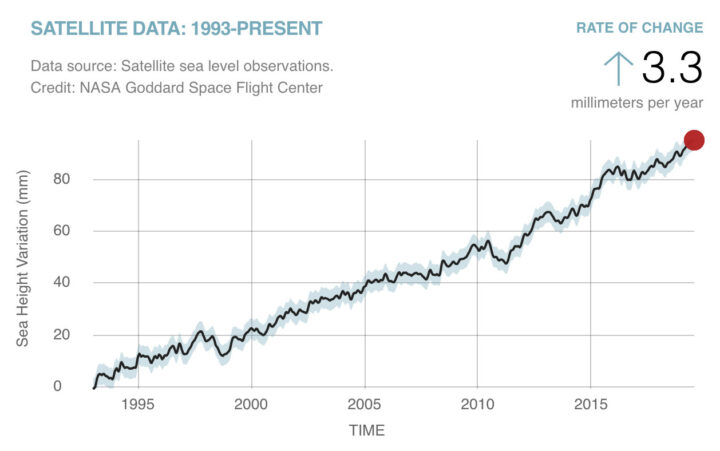
We can say now that sea level is rising at 3.3 millimeters (.13 inches) per year. We can show you a map of where exactly green vegetation has become more common and where it has faded. We can point you to a long-term dataset that will show you precisely where rain has fallen over the past two decades. And we can give you a tour of the world’s glaciers that shows you where they are and many examples of where they are shrinking.
The question to grapple with now: what do we with all this information?
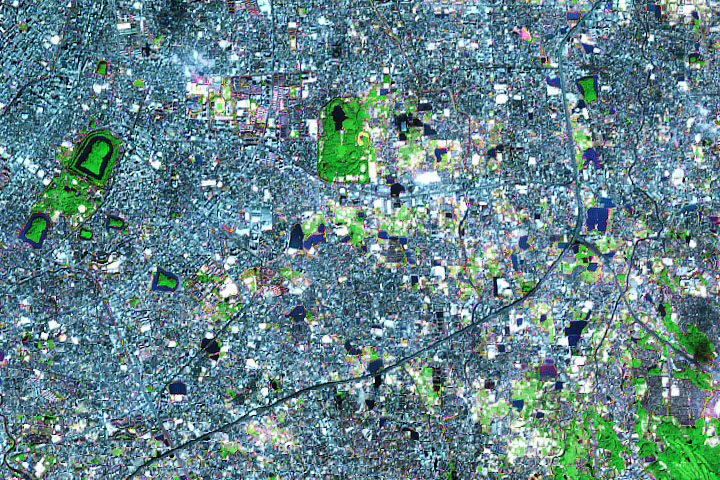
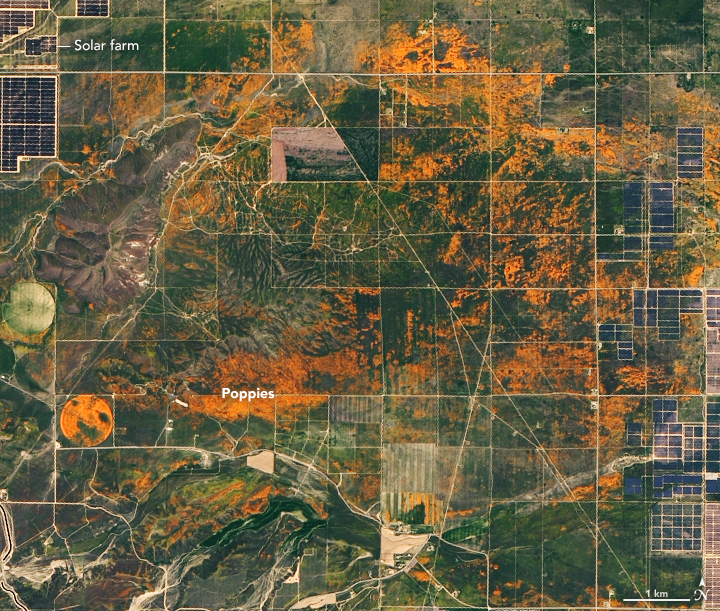
Every month on Earth Matters, we offer a puzzling satellite image. The November 2019 puzzler is above. Your challenge is to use the comments section to tell us what we are looking at, where it is, and why it is interesting.
November 2019 puzzler is above. Your challenge is to use the comments section to tell us what we are looking at, where it is, and why it is interesting.
How to answer. You can use a few words or several paragraphs. You might simply tell us the location. Or you can dig deeper and explain what satellite and instrument produced the image, what spectral bands were used to create it, or what is compelling about some obscure feature in the image. If you think something is interesting or noteworthy, tell us about it.
The prize. We can’t offer prize money or a trip to Mars, but we can promise you credit and glory. Well, maybe just credit. Roughly one week after a puzzler image appears on this blog, we will post an annotated and captioned version as our Image of the Day. After we post the answer, we will acknowledge the first person to correctly identify the image at the bottom of this blog post. We also may recognize readers who offer the most interesting tidbits of information about the geological, meteorological, or human processes that have shaped the landscape. Please include your preferred name or alias with your comment. If you work for or attend an institution that you would like to recognize, please mention that as well.
Recent winners. If you’ve won the puzzler in the past few months or if you work in geospatial imaging, please hold your answer for at least a day to give less experienced readers a chance.
Releasing Comments. Savvy readers have solved some puzzlers after a few minutes. To give more people a chance, we may wait 24 to 48 hours before posting comments.
Good luck!
See our “A Burial Site Fit for an Emperor“ Image of the Day for the answer.
