
The DC-8’s four engines burned either JP-8 jet fuel or a 50-50 blend of JP-8 and renewable alternative fuel made from camelina plant oil. Credits: NASA/SSAI Edward Winstead
Taking Some of the Search Out of ‘Search and Rescue’
NASA engineers are developing prototypes of second-generation locator beacons. The little devices have been used by pilots, mariners, and hikers since the 1970s to relay distress signals in times of emergency. Until now, those beacons have had a 2-kilometer (1 mile) radius. The new beacons will pinpoint location within a 140-meter radius—that’s more than 10 times more precise.
Small Satellites Will Track Big Storms
Atlantic hurricane season has just begun—and the CYGNSS mission has it covered. The constellation of eight mini-satellites, launched into low-Earth orbit in December 2016, measures surface winds using GPS signals reflected from the ocean surface. The data will help track storms as they grow, giving forecasters a better sense of storm intensity.
Cleaner Contrails?
Long a source of wonder (and occasional conspiracy theories), the white plumes that trail behind aircraft are a focus of study for NASA scientists testing the effects of biofuels. A new study shows that alternative fuels made from plant oils can cut down on particle emissions in jet exhaust by as much as 50 to 70 percent. From the news release:
Contrails are produced by hot aircraft engine exhaust mixing with the cold air that is typical at cruise altitudes several miles above Earth’s surface, and are composed primarily of water in the form of ice crystals…Researchers are most interested in persistent contrails because they create long-lasting, and sometimes extensive, clouds that would not normally form in the atmosphere, and are believed to be a factor in influencing Earth’s environment.
A Different Kind of Scat
Scientists have a new tool for measuring both ocean winds and water currents. Tested on airborne missions this spring, DopplerScatt is a cousin of QuickSCAT and RapidScat, which used a scatterometer to measure the “roughness” of the ocean surface and determine the direction and intensity of wind. DopplerScat adds a doppler radar to the package, allowing scientists to measure the speed and direction of the moving water. The instrument is another potential tool to measure currents along shipping routes or predict the direction that oils and other slicks might move.
In recognition of World Oceans Day (June 8) and this week’s UN Oceans Conference, here are some recent highlights from ocean science…
1.4 Million Pixels of Salt
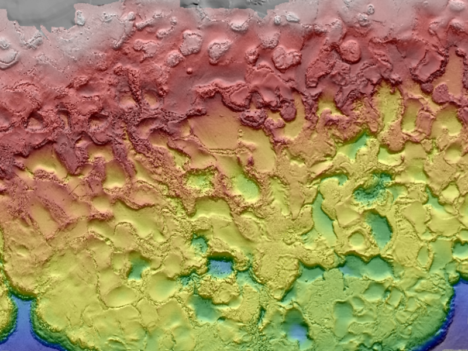
The Gulf of Mexico, like any sea, is rich in dissolved salts. Unlike most seas, the Gulf also sits atop a big mound of salt. Left behind by an ancient ocean, salt deposits lie beneath the Gulf seafloor and get pressed and squeezed and bulged by the heavy sediments laying on top of them. The result is pock-marked, almost lunar-looking seafloor. The many mounds and depressions came into clearer relief this spring with the release of a new seafloor bathymetry map compiled from oil and gas industry surveys and assembled by the U.S. Bureau of Ocean Energy Management.
3D Water Babies
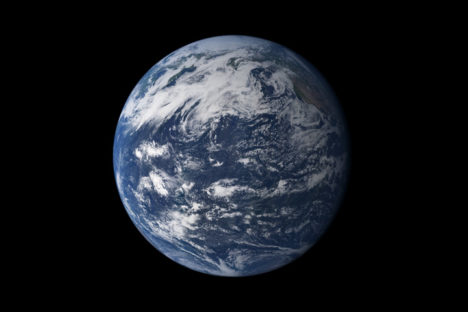
NASA’s Scientific Visualization Studio took a look back at conditions in the Pacific Ocean in 2015-16, which included the arrival and departure of both El Nino and La Nina. The 3D visualizations were derived from NASA’s Modern-Era Retrospective Analysis for Research and Applications (MERRA) dataset, a global climate modeling effort that is built from remote sensing data.
In other Nino news, a research team led by NASA Langley scientists found that the strong 2015-2016 El Niño lofted abnormal amounts of cloud ice and water vapor unusually high into the atmosphere, creating conditions similar to what could happen on a larger scale in a warming world.
Not the Kind of Brightening You Want to See
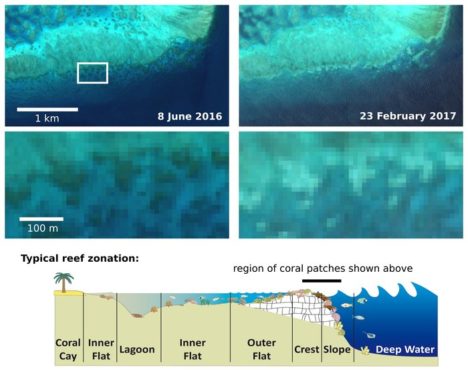
For past few years, warm ocean temperatures in the western Pacific Ocean have wrecked havoc on the Great Barrier Reef. Extreme water temperatures can disrupt the symbiotic partnership between corals and the algae that live inside their tissues. This leads the colorful algae to wash out of the coral, leaving them bright white in what scientists refer to as “bleaching” events. The health of coral reefs is usually monitored by airborne and diver-based surveys, but the European Space Agency recently reported that scientists have been able to use Sentinel 2 data to identify a bleaching event on the Great Barrier Reef. Such satellite monitoring could prove especially useful for monitoring reefs that are more remote and not as well studied as those around Australia.
Eyeing the Fuel for Hurricane Season
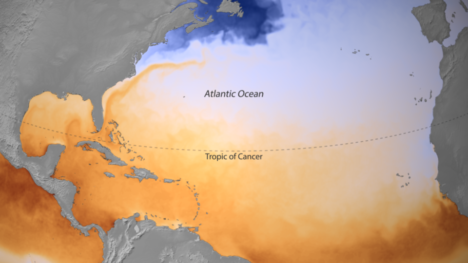
On June 1, the beginning of Atlantic Hurricane Season, the National Oceanic and Atmospheric Administration released a map of sea surface temperatures in the Caribbean, the Gulf of Mexico, and the tropical North Atlantic Ocean. The darkest orange areas indicate water temperatures of 26.5°C (80°F) and higher — the temperatures required for the formation and growth of hurricanes. Forecasters are expecting a hurricane season that is a bit more active than average.
(Finger)Prints of Tides
In a new comprehensive analysis published in Geophysical Research Letters, a French-led research team found that global mean sea level is rising 25 percent faster now than it did during the late 20th century. The increase is mostly due to increased melting of the Greenland Ice Sheet. A big part of the study was a reanalysis and recalibration of data acquired by satellites over the past 25 years, which are now better correlated to surface-based measurements. The study found that mean sea level has been increasing by 3 millimeters (0.1 inches) per year. The American Geophysical Union published a popular summary of the study.
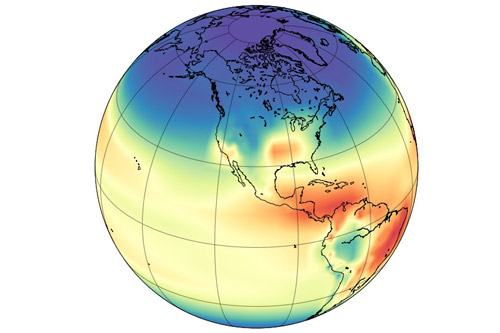
Model simulation of the hydroxyl radical concentration in the atmosphere. Image by Angharad Stell, University of Bristol.
A mystery about global methane trends just got more muddled. Two studies published in April 2017 suggest that recent increases in atmospheric concentrations of methane may not be caused by increasing emissions. Instead, the culprit may be the reduced availability of highly reactive “detergent” molecules called hydroxyl radicals (OH) that break methane down.
Understanding how globally-averaged methane concentrations have fluctuated in the past few decades—and particularly why they have increased significantly since 2007—has proven puzzling to researchers. As we reported last year:
“If you focus on just the past five decades—when modern scientific tools have been available to detect atmospheric methane—there have been fluctuations in methane levels that are harder to explain. Since 2007, methane has been on the rise, and no one is quite sure why. Some scientists think tropical wetlands have gotten a bit wetter and are releasing more gas. Others point to the natural gas fracking boom in North America and its sometimes leaky infrastructure. Others wonder if changes in agriculture may be playing a role.”
The new studies suggest that such theories may be off the mark. Both of them find that OH levels may have decreased by 7 to 8 percent since the early 2000s. That is enough to make methane concentrations increase by simply leaving the gas to linger in the atmosphere longer than before.
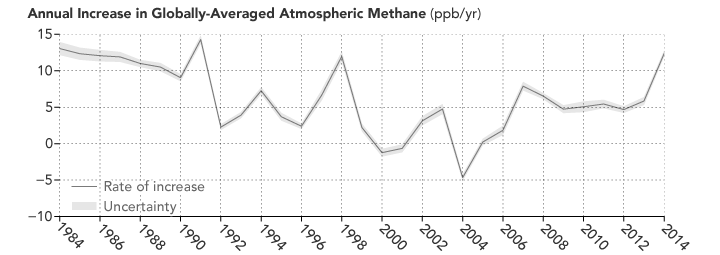
Atmospheric methane has continued to increase, though the rate of the increase has varied considerably over time and puzzled experts. (NASA Earth Observatory image by Joshua Stevens, using data from NOAA. Learn more about the image.)
As a press release from the Jet Propulsion Laboratory (JPL) noted: “Think of the atmosphere like a kitchen sink with the faucet running,” said Christian Frankenberg, an associate professor of environmental science and engineering at Caltech and a JPL researcher. “When the water level inside the sink rises, that can mean that you’ve opened up the faucet more. Or it can mean that the drain is blocking up. You have to look at both.”
Unfortunately, neither of the new studies is definitive. The authors of both papers caution that high degrees of uncertainty remain, and future work is required to reduce those uncertainties. “Basically these studies are opening a new can of worms, and there was no shortage of worms,” Stefan Schwietzke, a NOAA atmospheric scientist, told Science News.
You can find the full studies here and here. The University of Bristol has also published a press release.
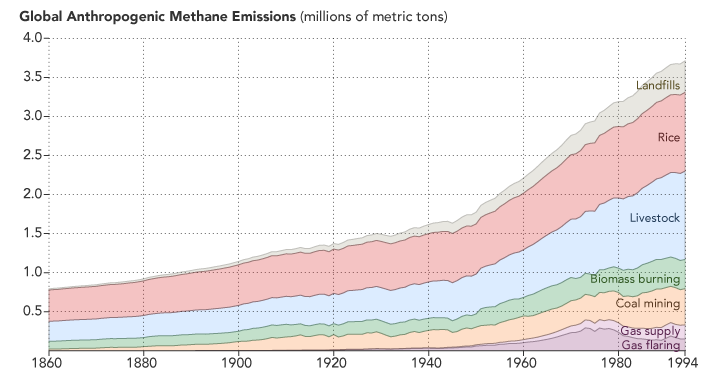
Methane emissions related to human activity are on the rise. (NASA Earth Observatory image by Joshua Stevens, using data from CDIAC. Learn more.)
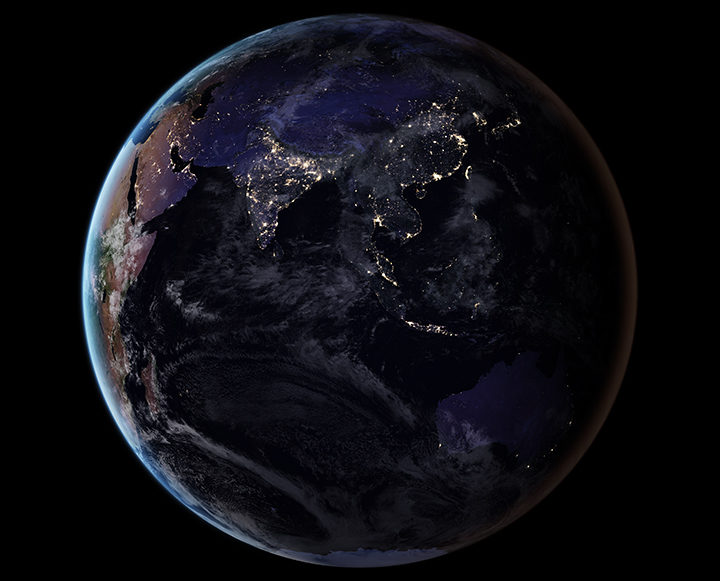
By removing natural and stray light sources, researchers have provided a clearer picture of the human footprint on Earth. Learn more about this image. (NASA Earth Observatory image by Joshua Stevens, using Suomi NPP VIIRS data from Miguel Román, NASA GSFC.)
As we arrive at Earth Day 2017, reporting on Earth science can sometimes feel like a gloomy affair. Global temperatures are at record highs. Arctic sea ice is in pretty bad shape. Bleaching events are taking a toll on coral reefs. And as an interesting article in EOS recently noted, humanity is affecting the very shape of Earth’s surface in unprecedented ways.
“We have altered flood patterns, created barriers to runoff and erosion, funneled sedimentation into specific areas, flattened mountains, piled hills, dredged land from the sea, and even triggered seismic activity,” the authors wrote. (Read our stories about land reclamation in China, mining in Canada, gas and oil infrastructure in Texas, the growing Wax Lake Delta in Louisiana, and the retreat of the Aral Sea to see changes of this nature.)
In spite of the challenges in a changing world, there are reasons to be optimistic. The world has come together to confront global problems before. Levels of protective ozone are stabilizing because of the Montreal Protocol. In the United States and Europe, better technology and regulations have led to drastic reductions in air pollutants such as sulfur dioxide and nitrogen dioxide. There are signs that efforts to clean up the Chesapeake Bay are making a difference.
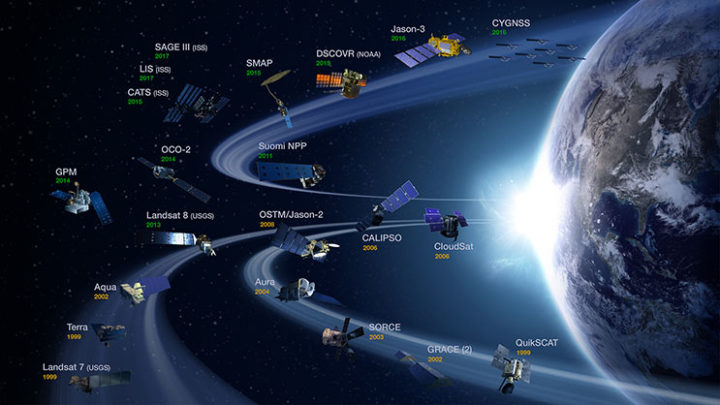
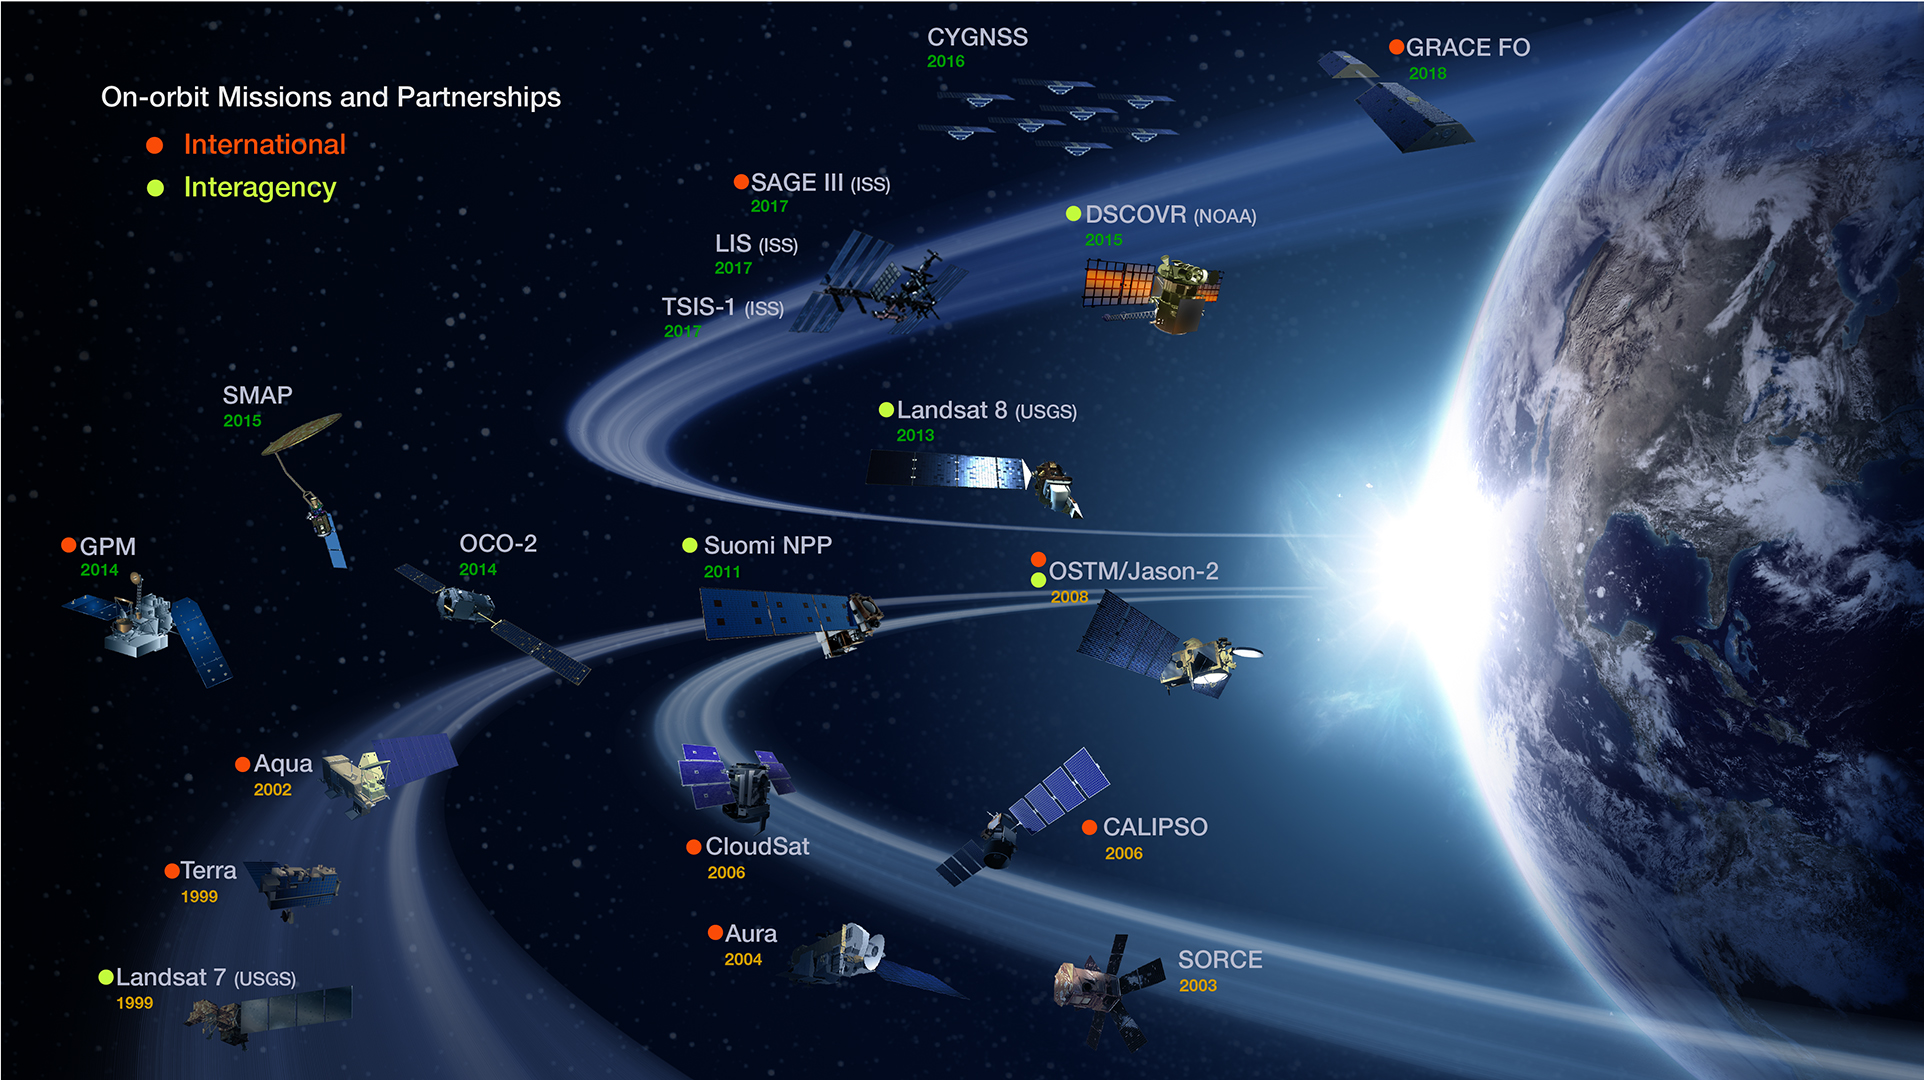
NASA’s operating Earth science missions as of March 31, 2017. (Image Credit: NASA’s Earth Observing Project Science Office.)
Some of the environmental challenges we face are daunting and can seem intractable, but there are some good reasons to feel reassured by the tools and expertise that the scientific community brings to the table. Americans live in a country where the number of deaths due to hurricanes, landslides, floods, droughts, tornadoes, blizzards, and other weather hazards have plummeted over the past century, and that is largely due to better understanding and to appropriate hazards warning systems that Earth scientists have developed.
Computers and instruments that used to take up whole rooms now fit snugly onto autonomous aircraft, satellites, and robots. At this moment, 1,459 satellites orbit Earth—including 19 that are part of the NASA fleet keeping a watchful eye on this dynamic, fragile planet. The authors of the EOS article note that a unified, global, high-resolution 3-D map of the human fingerprint on Earth is within reach due to the remarkable lidar instruments, aerial photogrammetry, and satellite observations that are now available.
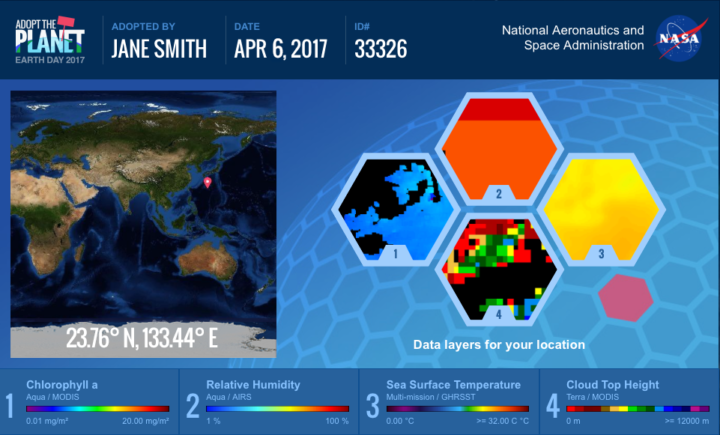
NASA invites people around the world to help us celebrate Earth Day 2017 by “adopting” one of 64,000 individual pieces of Earth as seen from space. Learn more. (Image Credit: NASA)
To get a sense of the sophistication and breadth of the information satellites now collect, just navigate to your home town with NASA’s Worldview browser or take a look at the Earth Observations (NEO) data archive. You will find information on everything from plant health to particulate aerosol levels to fires to city lights.
As you look, keep in mind that NASA isn’t just collecting that data for data’s sake. The Applied Sciences program is focused on making that data useful to citizens, resource managers, and civic planners in ways that make life better here on Earth. So if you plan to celebrate Earth Day by cleaning up trash in your neighborhood or adopting a piece of the planet with NASA, rest assured that you are not alone in working to make the planet just a little bit more livable.
Bigger isn’t necessarily better—at least where satellites are concerned. Modern “CubeSat” satellites are smaller and more numerous than ever.
The CubeSat takes its name from its dimensions; it is made up of multiples of 10×10×11 centimeter cubic units. A basic CubeSat weighs roughly 3 pounds (1.3 kilograms) and looks a good deal like a portable speaker.
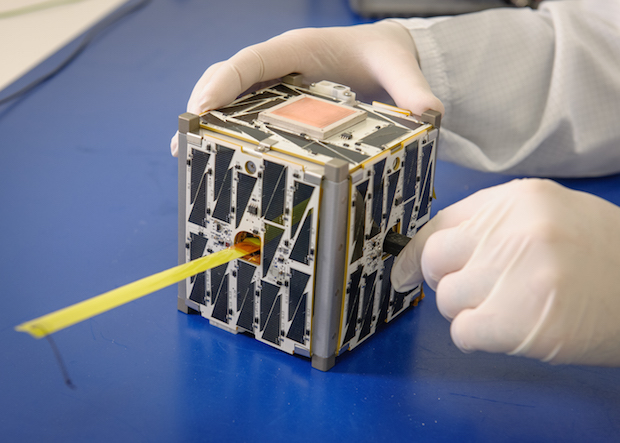
Image by NASA Ames.
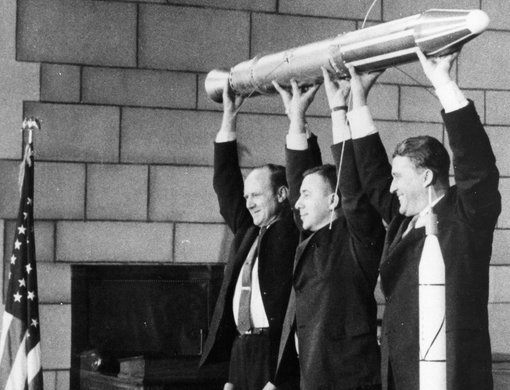
BACK TO THEIR ROOTS
Early satellites started out small, too. Launched in 1957, Sputnik weighed around 184 pounds (83 kilograms). America’s first satellite, Explorer I, weighed just under 31 lbs (14 kg). Then, as the desire for more sensors grew, so did the size of satellites. The first American weather satellite, TIROS I, was a hefty 270 lbs (122 kg). But recent years have seen a reversal of this trend.
Explorer I. Image by NASA.
Like modern cell phones, satellites have benefited from more compact and more powerful computing technology. (A 1980s cell phone was an expensive, brick-sized gadget that could only place phone calls and store a couple dozen numbers.) Satellites, too, have sprouted new cameras and sensors. Take the IPEX CubeSat developed by NASA’s Jet Propulsion Laboratory (45 seconds into the video below); it can track features like forest fires, volcanic eruptions, and algae blooms.
THE UPSIDES OF BEING SMALL
A satellite today can be a “hitchhiker,” aboard a larger mission, as the video below mentions. Or, a CubeSat can be launched from the International Space Station.
Because they are smaller, CubeSats tend to cost less, so research organizations can deploy more of them. That means more spatial coverage for monitoring the Earth. Where researchers once relied on two or three larger satellites to keep an eye on weather over the Pacific Ocean, now, handfuls of smaller satellites can help with the job.
NASA is not the only organization that builds CubeSats. The space agency has delivered little satellites made by private companies, college students, and even grade school students.
To learn more, watch the video below. Or read more here.
On March 17, 2002, two small satellites (nicknamed Tom and Jerry) blasted off from the Plesetsk Cosmodrome in northern Russia. In the 15 years since, there is nothing funny about what this pair has accomplished. In fact, as my colleague Carol Rasmussen noted, revolutionary is more often the word used when scientists describe the Gravity Recovery and Climate Experiment (GRACE).
By measuring Earth’s gravity field, the satellites have pioneered a whole new way of monitoring water. The details of what this pair has observed has been eye-opening. Among the most sobering of GRACE’s many discoveries:
In cat years, Tom and Jerry are nearing 75. To celebrate their longevity, give a read of this excellent overview story written by Holli Riebeek of the Earth Observatory and this list of all the GRACE press announcements from the Jet Propulsion Laboratory. Below are a few of my favorite videos and data visualizations about the mission.
The American Museum of Natural History video offers a quick overview. The State Department video is longer and wonkier, but has some really interesting details. And the 60 Minutes clip (part of this longer episode) is a reminder that NASA studies earth science in a way that few other organizations can. Click on each of the maps below to find out more about them.
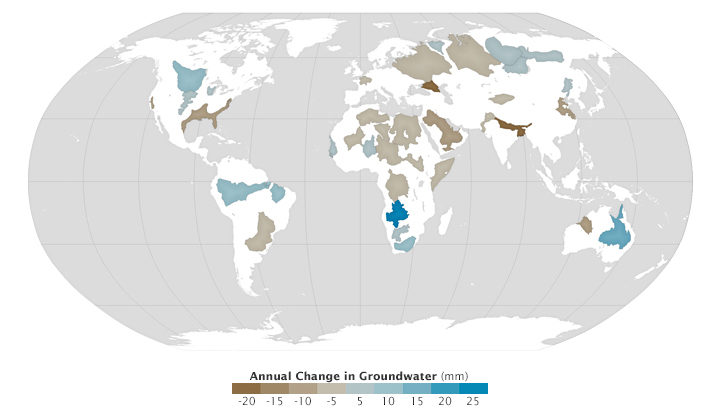
NASA Earth Observatory images by Joshua Stevens using GRACE global groundwater data courtesy of Jay Famiglietti NASA JPL/University of California Irvine and Richey et al. (2015).
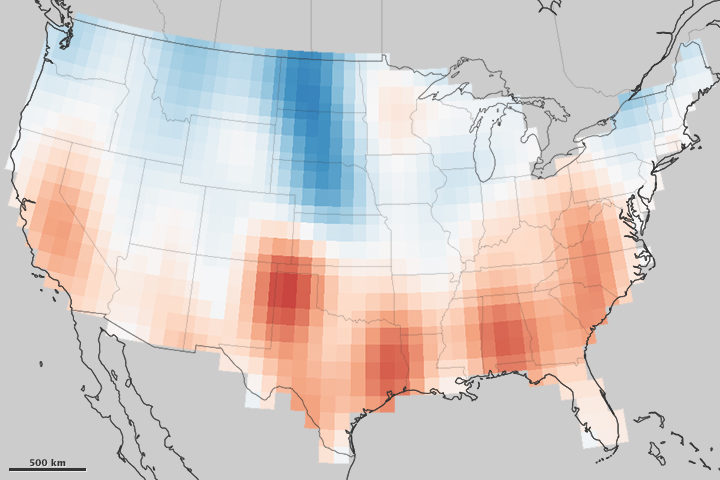
NASA Earth Observatory image by Jesse Allen, using GRACE data provide courtesy of Jay Famigleitti, University of California Irvine and Matthew Rodell, NASA GSFC, and Famiglietti & Rodell (2013).
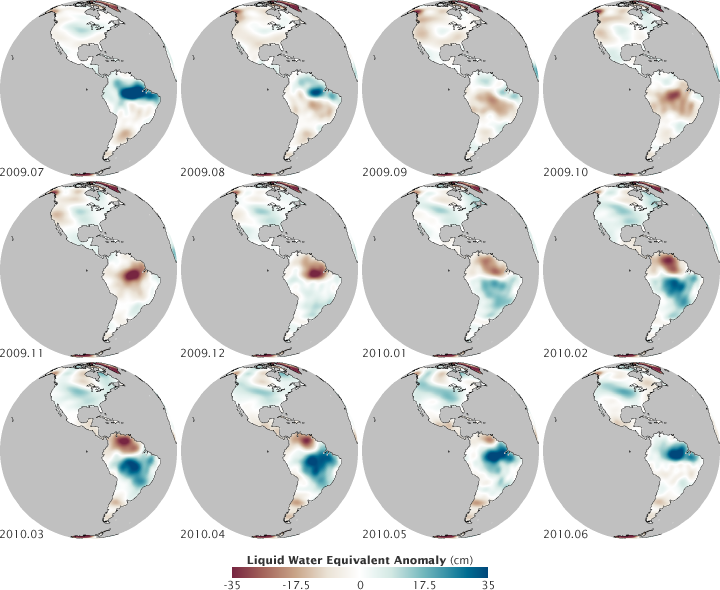
NASA maps by Robert Simmon, using GRACE data.
If you’re like me, you’ll find yourself transfixed by this newly released clip of lightning flashes flitting across Texas skies at night. These data were captured by the Geostationary Lightning Mapper (GLM), a first-of-its-kind sensor that was launched into space on GOES-16 (called GOES-R prior to launch) in November 2016. The sensor makes continuous observations of lightning flashes—a new capability that should markedly improve weather forecasts of severe thunderstorms and tornadoes.
The video clip—an animation of GLM observations overlaid on Advanced Baseline Imager (ABI) cloud imagery—shows lightning flashing over southeast Texas on the morning of February 14, 2017. As explained by NOAA’s Michelle Smith, the green cross indicates the location of Houston, and the green dotted lines show the Texas coastline. Rendered at 25 frames per second, the animation simulates what your eye might see if it was above the clouds. GLM observes the scene at 500 frames per second, and can distinguish the location, intensity, and horizontal propagation of individual strokes within each lightning flash.

At the time of his death on December 23, 2016, Piers Sellers was the deputy director of the Sciences and Exploration Directorate and the acting director of the Earth science division at NASA’s Goddard Space Flight Center. But he was a lot more than that to his colleagues and to the world. NASA science writer Patrick Lynch (and occasional Earth Observatory contributor) had the unenviable task of trying to capture the essence of Sellers:
“As an astronaut, he helped build the International Space Station. As a manager, he helped lead hundreds of scientists. And as a public figure he was an inspiration to many for his optimistic take on humanity’s ability to confront Earth’s changing climate. But his most lasting contributions will be in the field where he began his career: science.”
Piers came to NASA Goddard from Britain in 1982 as a research meteorologist and climate scientist. His focus was the interaction between the biosphere — the living, breathing plant-life of Earth — and the atmosphere. He helped develop models and wrote several papers that are still widely cited in the field. But he also had another lifelong dream: to become an astronaut. He applied to the astronaut training program in the 1990s, and worked through rigorous screening and training to go into space. He flew to the International Space Station in 2002, 2006, and 2010, participating in six spacewalks and helping with assembly of the station. Upon retiring from the astronaut corps, he came back to Goddard and resumed his place as a leader in Earth science, while also promoting conversations and collaborations with researchers studying planetary science and hunting for life beyond our solar system.
I did not have the chance to get to know Piers well. He was someone I mostly watched from afar and our interactions were sporadic, though always interesting, dignified, and thoughtful. I came to know him mostly through his words — to the media and to my fellow scientific and communications staff of NASA Goddard — and in the ways he inspired people. The more I read, the more I wish I had been able to spend more time with him.

In January 2016, one year ago this week, he wrote a poignant op-ed in The New York Times. The words were a compelling prelude to his final year with us.
I’m a climate scientist who has just been told I have Stage 4 pancreatic cancer. This diagnosis puts me in an interesting position. I’ve spent much of my professional life thinking about the science of climate change, which is best viewed through a multi-decadal lens. At some level I was sure that, even at my present age of 60, I would live to see the most critical part of the problem, and its possible solutions, play out in my lifetime. Now that my personal horizon has been steeply foreshortened, I was forced to decide how to spend my remaining time. Was continuing to think about climate change worth the bother?
You should read the full text of “Cancer and Climate Change” for its insight and inspiration.
*******************************************
In the summer of 2016, Sellers wrote another compelling piece, this time in The New Yorker. In “Space, Climate Change, and the Real Meaning of Theory,” he took on a very sensitive and fundamental facet of science: the accumulation of evidence and observation that leads to truth. Here is my favorite passage:
When we talk about why the climate has changed, and what the future climate is likely to be, scientists use analyses and predictions that rest heavily on results from computer models, which in turn rest on layers and layers of theory. And there’s the rub—a lot of the confusion about what is known and unknown about the changing climate can be traced to people’s understanding of the role of theory in science.
Fundamentally, a theory in science is not just a whim or an opinion; it is a logical construct of how we think something works, generally agreed upon by scientists and always in agreement with the available observations. A good example is Isaac Newton’s theory of gravitation, which says that every physical object in the universe exerts a gravity force field around itself, with the strength of that field depending on its mass. The theory—one simple equation—does a superb job of explaining our observations of how planets orbit around the sun, and was more than good enough to make the calculations we needed to send spacecraft to the moon and elsewhere. Einstein improved on Newton’s theory when it comes to large-scale astronomical phenomena, but, for everyday engineering use, Newton’s physics works perfectly well, even though it is more than three hundred years old.
…Engineering theory, based on Newton’s work, is so accepted and reliable that we can get it right the first time, almost every time. The theory of aerodynamics is another perfect example: the Boeing 747 jumbo-jet prototype flew the first time it took to the air—that’s confidence for you. So every time you get on a commercial aircraft, you are entrusting your life to a set of equations, albeit supported by a lot of experimental observations. A jetliner is just aluminum wrapped around a theory.
The full text is here.
**************************************************
On camera, it is easy to pick up the energy, humor, and dignity of the man. In the past year, he was a frequent interview subject for the television and radio media. He also made an appearance in Leonardo DiCaprio’s documentary Before the Flood. Some of us think Piers stole the show.
But I am most fond of this simple video, posted last month to YouTube. It’s a conversation between Piers and Compton Tucker, one of his best friends, his next-door neighbor, and a fellow NASA scientist. So many people have stilted and distant impressions about scientists, and Hollywood caricatures don’t help. I like this video because it shows bright people having fun, being human, and savoring life, learning, and friendship.
Other interviews worth watching or listening to:
WBEZ Chicago — The Thin Blue Ribbon
HBO Vice News – A New Hope
CNN On GPS: An astronaut on his final mission
**************************************
At the conclusion of his January 2016 piece in The New York Times, Piers offers a thought that inspires us to keep up the good work.
As for me, I’ve no complaints. I’m very grateful for the experiences I’ve had on this planet. As an astronaut I spacewalked 220 miles above the Earth. Floating alongside the International Space Station, I watched hurricanes cartwheel across oceans, the Amazon snake its way to the sea through a brilliant green carpet of forest, and gigantic nighttime thunderstorms flash and flare for hundreds of miles along the Equator. From this God’s-eye-view, I saw how fragile and infinitely precious the Earth is. I’m hopeful for its future.
And so, I’m going to work tomorrow.

NASA Profile – Piers Sellers: A Legacy of Science
NASA Statement – NASA Administrator Remembers Scientist, Astronaut Piers Sellers
Flickr: Piers Sellers
The Washington Post — Piers Sellers, climate scientist turned astronaut, dies at 61
September 2016 was the warmest September in 136 years of modern record-keeping, according to a monthly analysis of global temperatures by scientists at NASA’s Goddard Institute for Space Studies (GISS) in New York.
NASA Earth Observatory chart by Joshua Stevens, based on data from the NASA Goddard Institute for Space Studies.
September 2016’s temperature was a razor-thin 0.004 degrees Celsius warmer than the previous warmest September in 2014. The margin is so narrow those two months are in a statistical tie. Last month was 0.91 degrees Celsius warmer than the mean September temperature from 1951-1980.
The record-warm September means 11 of the past 12 consecutive months dating back to October 2015 have set new monthly high-temperature records. Updates to the input data have meant that June 2016, previously reported to have been the warmest June on record, is, in GISS’s updated analysis, the third warmest June behind 2015 and 1998 after receiving additional temperature readings from Antarctica. The late reports lowered the June 2016 anomaly by 0.05 degrees Celsius to 0.75.
“Monthly rankings are sensitive to updates in the record, and our latest update to mid-winter readings from the South Pole has changed the ranking for June,” said GISS director Gavin Schmidt. “We continue to stress that while monthly rankings are newsworthy, they are not nearly as important as long-term trends.”
The monthly analysis by the GISS team is assembled from publicly available data acquired by about 6,300 meteorological stations around the world, ship- and buoy-based instruments measuring sea surface temperature, and Antarctic research stations. The modern global temperature record begins around 1880 because previous observations didn’t cover enough of the planet. Monthly analyses are updated when additional data become available, and the results are subject to change.
Related Links
+ For more information on NASA GISS’s monthly temperature analysis, visit: data.giss.nasa.gov/gistemp.
+ For more information about how the GISS analysis compares to other global analysis of global temperatures, visit:
http://earthobservatory.nasa.gov/blogs/earthmatters/2015/01/21/why-so-many-global-temperature-records/
+ To learn more about climate change and global warming, visit:
http://earthobservatory.nasa.gov/Features/GlobalWarming/
August 2016 was the warmest August in 136 years of modern record-keeping, according to a monthly analysis of global temperatures by scientists at NASA’s Goddard Institute for Space Studies (GISS).
Although the seasonal temperature cycle typically peaks in July, August 2016 wound up tied with July 2016 for the warmest month ever recorded. August 2016’s temperature was 0.16 degrees Celsius warmer than the previous warmest August (2014). The month also was 0.98 degrees Celsius warmer than the mean August temperature from 1951-1980.
NASA Earth Observatory chart by Joshua Stevens, based on data from the NASA Goddard Institute for Space Studies.
“Monthly rankings, which vary by only a few hundredths of a degree, are inherently fragile,” said GISS Director Gavin Schmidt. “We stress that the long-term trends are the most important for understanding the ongoing changes that are affecting our planet.” Those long-term trends are apparent in the plot of temperature anomalies above.
The record warm August continued a streak of 11 consecutive months (dating to October 2015) that have set new monthly temperature records. The analysis by the GISS team is assembled from publicly available data acquired by about 6,300 meteorological stations around the world, ship- and buoy-based instruments measuring sea surface temperature, and Antarctic research stations. The modern global temperature record begins around 1880 because previous observations didn’t cover enough of the planet.
Related Links
+ For more information on NASA GISS’s monthly temperature analysis, visit: data.giss.nasa.gov/gistemp.
+ For more information about how the GISS analysis compares to other global analysis of global temperatures, visit:
http://earthobservatory.nasa.gov/blogs/earthmatters/2015/01/21/why-so-many-global-temperature-records/
+ To learn more about climate change and global warming, visit:
http://earthobservatory.nasa.gov/Features/GlobalWarming/
Related Reading in the News
+ Mashable: Earth sets record for hottest August, extending warm streak another month
http://mashable.com/2016/09/12/earth-warmest-august-hottest-summer/#ivXnyy8yusqu
+ XKCD: A Timeline of Earth’s Average Temperature
http://xkcd.com/1732/
+ Climate Central: August Ties July as Hottest Month Ever on Record
http://www.climatecentral.org/news/august-ties-july-as-hottest-month-on-record-20691
