The Earth Observatory has published its last Image of the Day on this website. Please join us on our new home at science.nasa.gov/earth/earth-observatory.
Two years ago, we wrote: “The year 2014 was Earth’s warmest in 134 years of records.” Last year we wrote: “2015 was the warmest year ever recorded on Earth, and it was not even close.” This year, we are running out of ways to say it.
In 2016, surface temperatures on Earth were the warmest that they have been since modern recordkeeping began in 1880, according to independent analyses by NASA and the National Oceanic and Atmospheric Administration (NOAA). This is the third year in a row that a new global temperature record has been set. The UK Met Office and Japan Meteorological Agency have announced similar findings.
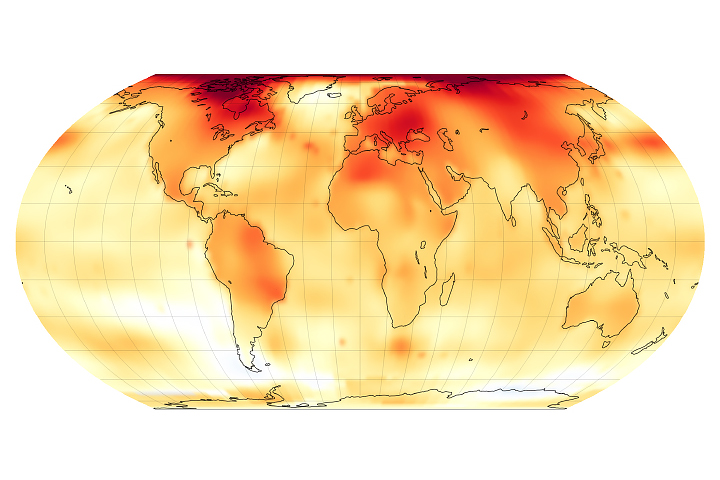
Globally-averaged temperatures in 2016 were 0.99 degrees Celsius (1.78 degrees Fahrenheit) warmer than the mid-20th century mean, according to an analysis by scientists at NASA’s Goddard Institute for Space Studies (GISS). Because the location of weather stations and temperature measurement practices change over time, there can be uncertainties in the interpretation of specific year-to-year global mean temperature differences. However, even taking this into account, the NASA GISS analysis has greater than 95 percent certainty that 2016 was the warmest year on record.
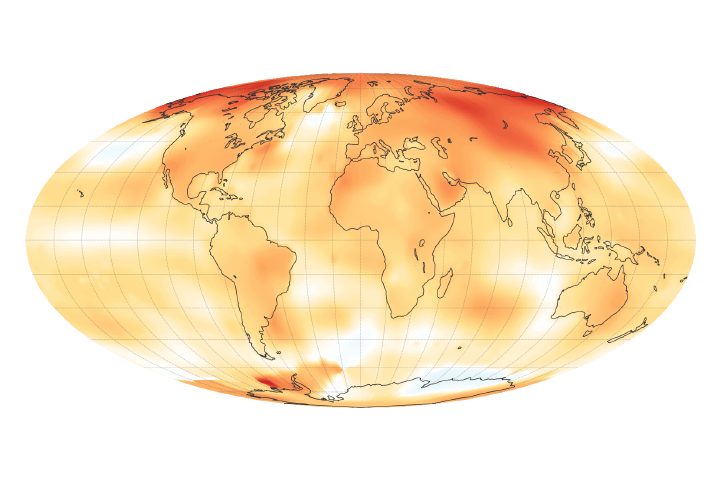
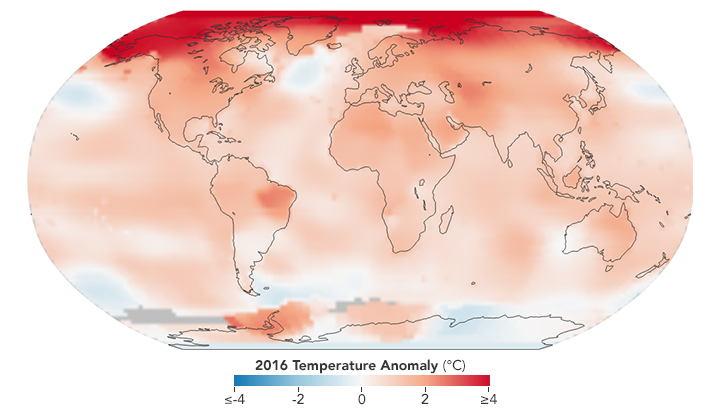
The map above depicts global temperature anomalies in 2016. It does not show absolute temperatures; instead, it shows how much warmer or cooler each region of Earth was compared to a baseline average from 1951 to 1980.
“We don’t expect record years every year, but the ongoing long-term warming trend is clear,” said GISS Director Gavin Schmidt. The planet’s average surface temperature has risen about 1.1°C (2.0°F) since the late 19th century, a change driven largely by increased carbon dioxide and other manmade emissions into the atmosphere. Much of the warming has occurred in the past 35 years.
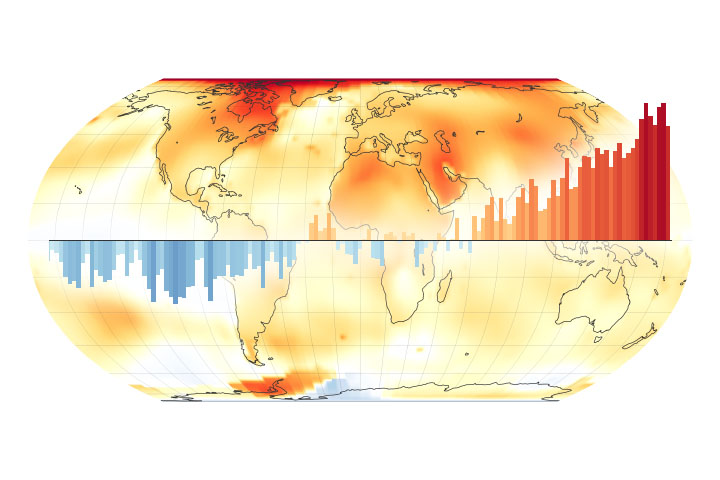
The animated figure above shows global temperature anomalies for every month since 1880, a result of the Modern-Era Retrospective analysis for Research and Applications, version 2 (MERRA-2) model run by NASA’s Global Modeling and Assimilation Office. Each line shows how much the global monthly temperature was above or below the annual global mean from 1980–2015. The column on the right lists each year when a new global record was set.
Not only was 2016 the warmest year on record, but eight of the 12 months of the year—from January through September, with the exception of June—were the warmest on record for those respective months. October and November were the second warmest of those months, just behind records set in 2015.
Phenomena such as El Niño and La Niña—which warm and cool the surface waters of the tropical Pacific Ocean and cause variations in global wind and weather patterns—contribute to short-term variations in global average temperature. An El Niño event spanned much of 2015 and the first third of 2016, and researchers estimate that it increased the annual global temperature anomaly for 2016 by 0.12°C (0.2°F).
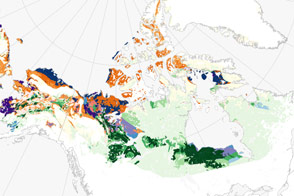
Weather dynamics often affect local temperatures, so not every region on Earth experienced record temperatures last year. Both NASA and NOAA found the 2016 annual mean temperature for the contiguous (“lower”) 48 United States was the second warmest on record. The Arctic experienced its warmest year ever, consistent with record low sea ice for most of the year.
The NASA GISS team assembles its analysis from publicly available data acquired by roughly 6,300 meteorological stations around the world; from ship- and buoy-based instruments measuring sea surface temperature; and from Antarctic research stations. This raw data is analyzed using methods that account for the distribution of temperature stations around the globe and for urban heating effects that could skew the calculations. (For more explanation of how the analysis works, read World of Change: Global Temperatures.)
Scientists from NOAA, JMA, and the UK Met Office use much of the same raw temperature data, but with different baseline periods or slightly different methods to analyze Earth’s polar regions and global temperatures.
NASA Earth Observatory images by Joshua Stevens, based on data from the NASA Goddard Institute for Space Studies. Caption by Kate Ramsayer, NASA Goddard Space Flight Center, with Mike Carlowicz.