Camp managers and other officials overseeing Rohingya refugee camps in Bangladesh are now incorporating NASA satellite observations into their decision-making. Information like daily rain totals can help inform how to lay out refugee camps and how to store supplies. The goal is to reduce the risk to refugees from landslides and other natural hazards.
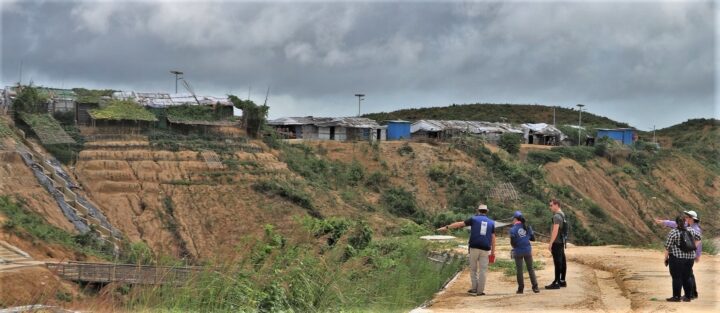
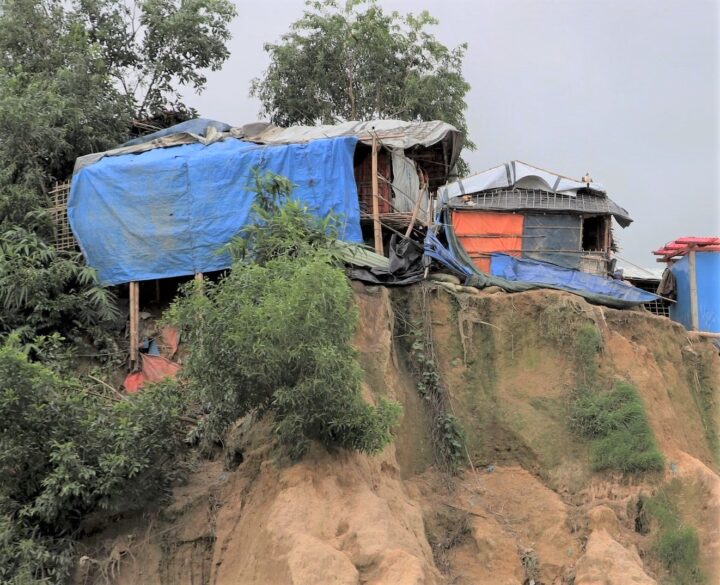
Since August 2017, more than 740,000 Rohingya refugees have fled from Myanmar (Burma) to Bangladesh. Many of them have sought shelter in camps in the hilly countryside, where landslide risks are greatest. When refugee camps were built in the southeastern part of the country, many plants and trees were removed — taking with them the roots that could hold the soil in place and help stabilize the landscape when heavy rains come.
Increasing this danger is Bangladesh’s intense monsoon season. Approximately 80 percent of the country’s yearly rain falls from June to October, bringing with it an increased risk of flash flooding and landslides. For instance, July 2019 storms dropped 14 inches of rain in just 72 hours, causing 26 landslides in Rohingya refugee camps around Cox’s Bazar, Bangladesh. One person was killed and more than 4,500 others were left without shelter.
“We have little information on landslides,” said Hafizol Islam, who is in charge of one of the most densely populated camps at Cox’s Bazar. “It is unpredictable for us and can happen at any time.”
Now Islam and other camp managers have access to maps and a website (updated daily) that provides near real-time NASA data on land use, rainfall, and elevation. Data come from the Global Precipitation Measurement (GPM) mission and the Moderate Resolution Imaging Spectroradiometer (MODIS) instruments on NASA’s Terra and Aqua satellites, among other sources. Taken together, these maps and data provide a clearer picture of when and where landslide hazards are concentrated.
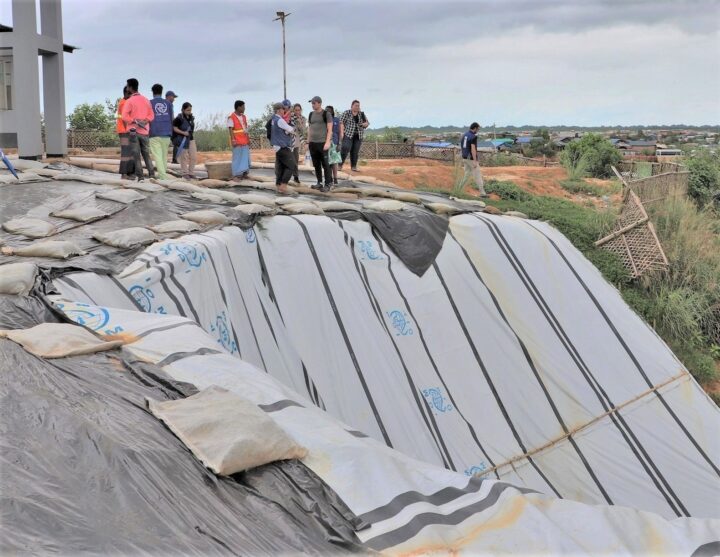
“With landslides, flash floods, and rapid development, the terrain of these camps is constantly changing,” said Robert Emberson, a postdoctoral fellow at NASA’s Goddard Space Flight Center.
Emberson and other researchers from NASA’s Earth Applied Sciences Disasters Program and Columbia University’s International Research Institute for Climate and Society (IRI) are using new approaches to work alongside humanitarian end-users and develop products to address pressing needs in vulnerable settings. The partnership seeks the feedback of the local people affected and develops maps based on their input.
“We need to understand if, why, and when existing risk information is being used,” said Andrew Kruczkiewicz of IRI, one of the principal investigators of the project. “This strengthens the development of data services for humanitarian emergencies, where decisions and priorities change rapidly. Working in teams that bridge traditional professional and disciplinary boundaries gives data and climate scientists the opportunity to learn more about decision-making in specialized contexts.”
The need for coordination is pressing. Bangladesh has seen steadily increasing rainfall totals over the past 50 years. Climate change is making monsoons in Asia more extreme, and it may be doubling the likelihood of extreme rainfall events even before monsoon season begins.
“The partnership with NASA and IRI helps the UN agencies to assess risks like landslides or flash flooding and supports the disaster management in a scientific way to save lives and reduce damages in the refugee camps,” said Cathrine Haarsaker, a project manager for UNDP Disaster Risk Management.
Emberson said seeing the camps in person brought home the importance of connecting with the people on the ground. “Working with satellite data can sometimes feel quite abstract and separate from the people within the images,” he said. “Visiting the camps not only helped us understand more about the specific problems associated with landsliding to help improve our models in the future, but also drove home the human side to this disaster, emphasizing the urgency of our work.”
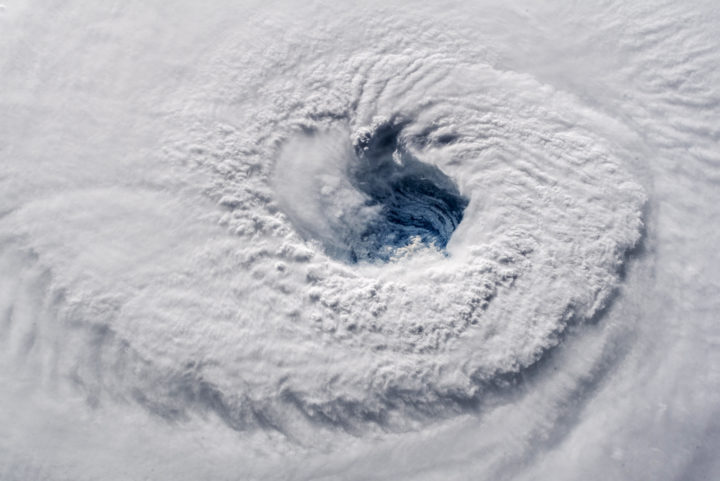
Early on September 12, 2018, astronaut Alex Gerst shot this photograph of Florence’s eye as viewed from the International Space Station. He tweeted: “Ever stared down the gaping eye of a category 4 hurricane? It’s chilling, even from space.” Credit: ISS Photograph by Alex Gerst, European Space Agency/NASA
When Hurricane Florence approached the Carolinas, the NASA Disasters Program began providing a suite of satellite data products to disaster responders, such as the Federal Emergency Management Agency (FEMA) and the National Guard. The goal was to provide the latest information for decision-making on everything from evacuations to supply routes to recovery estimates.
Andrew Molthan is a research meteorologist at NASA’s Marshall Space Flight Center who serves as a “disaster coordinator” for the disasters program. This week, he has been sitting at the FEMA National Response Coordination Center in Washington, D.C., to facilitate coordination of NASA data. We asked him a few questions to better understand the NASA Disaster Program’s role during Hurricane Florence.
What is your role at FEMA this week?
I am here at FEMA to better understand the agency’s geospatial needs during a major disaster, to help improve coordination, and to lend additional remote sensing and/or meteorological expertise where I can.
I am also helping with coordination and data exploitation for the Uninhabited Aerial Vehicle Synthetic Aperture Radar (UAVSAR) instrument aboard NASA’s C-20A aircraft, operated by a pilot. As a team, colleagues from NASA centers all over the country—Marshall, Headquarters, Jet Propulsion Laboratory, Armstrong Flight Research Center, Goddard Space Flight Center, and Langley Research Center—are working collaboratively to help target the UAVSAR instrument for daily radar imaging over the most critical rivers of interest to FEMA, the National Guard, and other partners. Scientists are assisting agencies in the interpretation of the UAVSAR imagery to inform immediate response efforts. They will also further process the data and use it as part of longer-term efforts to improve flood remote sensing and improve streamflow and inundation models.
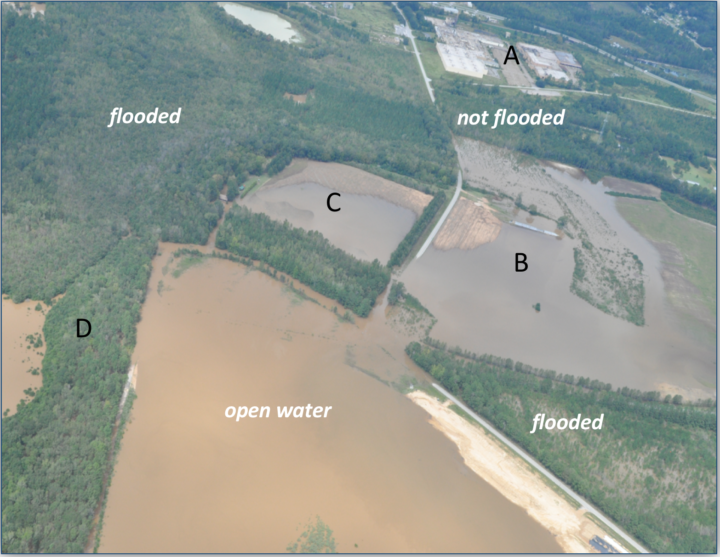
Above: Civil Air Patrol photo taken on September 18, 2018 near Cheraw, SC. Credit: Civil Air Patrol
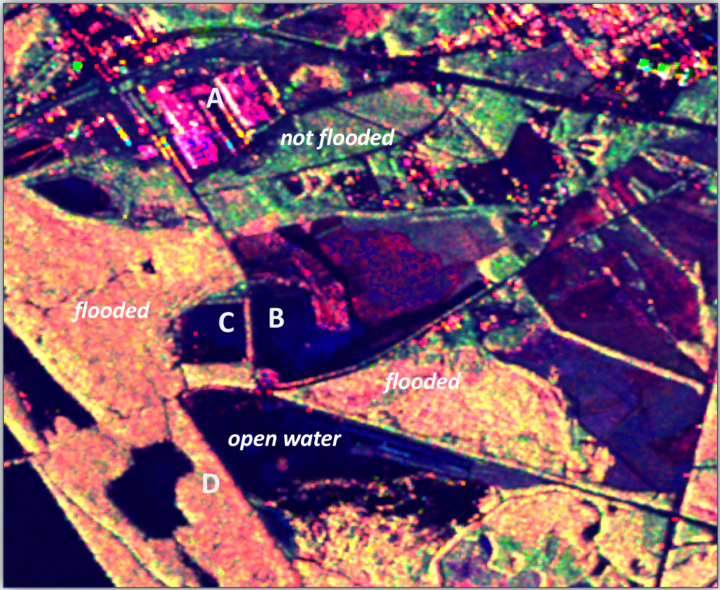
Above: UAVSAR polarimetric decomposition image taken on September 17, 2018 near Cheraw, SC (same area as Civil Air Patrol photo above). Pink denotes urban areas whereas red/orange denotes inundated forests. Dark blue or black are flooded open water; roads can be black even if not flooded. Green, yellow, and light blue color denote areas that are not flooded. Note: Red — Double bounce scattering (flooded forests and urban); Green – Volume scattering (unflooded forests); Blue – specular scatters (dry bare ground, open water). Credit: Yunling Lou/JPL, Bruce Chapman/JPL and Gerald Bawden/HQ
What NASA products are being shared with the National Guard and FEMA?
Most of our activities have focused on helping with the remote sensing of flooded areas following the heavy rains associated with Hurricane Florence. Many river basins in southern Virginia, central and eastern North Carolina, and northeastern South Carolina have experienced widespread river flooding and flash flooding that has affected citizens and need to be monitored for response efforts.
Above: This GPM IMERG visualization shows storm-total accumulated rainfall on the left for 9/12/18 – 9/17/18 vs. a sequence of 3-hour accumulations on the right. Credit: NASA
NASA Marshall team members are producing products and assisting with event coordination including my spot here at FEMA supporting their geospatial team. Scientists with the Jet Propulsion Laboratory (the ARIA team) are routinely generating flood- and damage proxy maps. Goddard researchers are assisting with optical and radar flood detections. The Langley Research Center is assisting with data access and sharing via GIS platforms. NASA Headquarters is supporting overall agency coordination. Johnson Space Center is helping to acquire dramatic footage of the storm and aftermath from astronaut photography.
What instruments are being used?
The extensive cloud cover from the storm has blocked surface views from instruments operating in the visible, near infrared, and thermal wavelengths, so synthetic aperture radar (SAR) information has been critical. SAR has the ability to “see” through clouds, making it an all-weather instrument. These include images from the European Space Agency’s Sentinel-1A/1B platforms, international and commercial partner assets, such as those from the Japan Aerospace Exploration Agency’s ALOS-2, Canadian Space Agency’s Radarsat-2, and the German TerraSARx, which are made available through government partnerships and the International Charter on Space and Major Disasters.
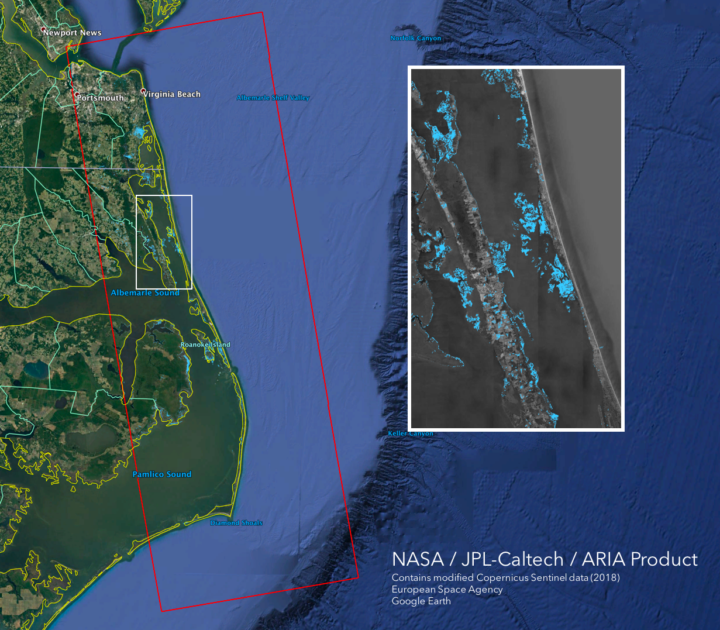
This flood proxy map shows the extent of flooding 36 hours after the hurricane’s landfall (September 15, 2018 18:57 PM local time). The map is derived from Synthetic Aperture Radar (SAR) data from the Copernicus Sentinel-1 satellites, operated by the European Space Agency (ESA).
As skies are now beginning to clear, we’ll also look for opportunities to use other NASA satellite remote sensing assets — including Terra/Aqua MODIS, Suomi-NPP VIIRS, Landsat 8 — and applications to identify water on the surface. We’ll also take a look at nighttime light imaging from Suomi-NPP VIIRS and the day-night band, using the NASA Black Marble and Black Marble HD products generated at Goddard.
Above: The VIIRS instrument on the joint NASA/NOAA Suomi NPP satellite observed Hurricane Florence as it developed in the Atlantic Ocean and made landfall in North Carolina on Sept. 14, 2018. Credits: NASA Worldview
