The American West is in the grip of an exceptional drought. Following one of the planet’s hottest years on record — and with rainfall and snowfall in the western U.S. well below average — water managers, policymakers, government agencies, and scientists are facing strapped water supplies and anticipating potentially devastating wildfires.
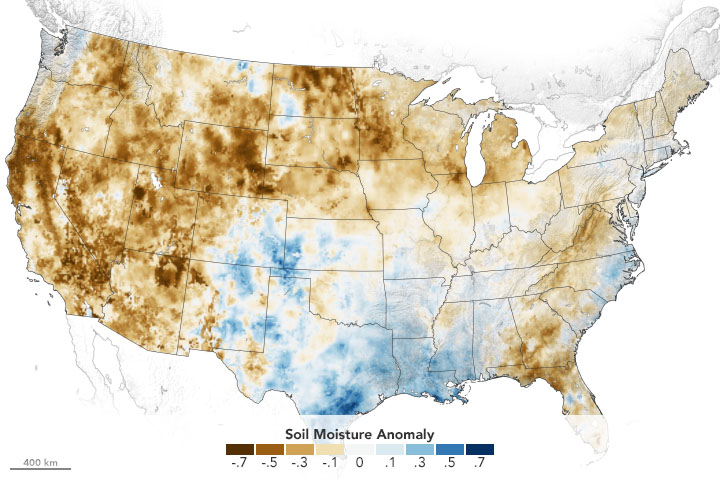
Using its satellites, aircraft, and computer models, NASA is helping water managers respond. NASA’s drought resource page details how the agency is helping farmers, reservoir managers, and decision makers track and monitor the ongoing drought, predict how much water will be available, and help improve how we use the water we have. The site will be updated throughout the year.
Underpinning all of this is NASA’s expertise in water science, our partnerships with water managers across the country, and our leadership in space and remote-sensing technology.
Learn more at the drought resource page.
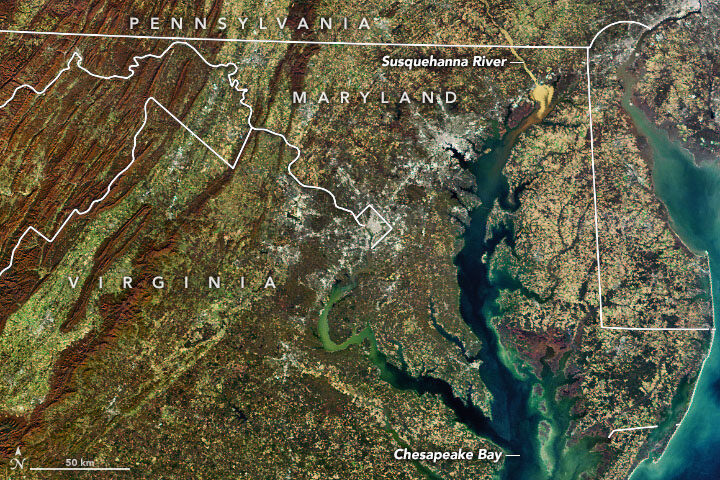
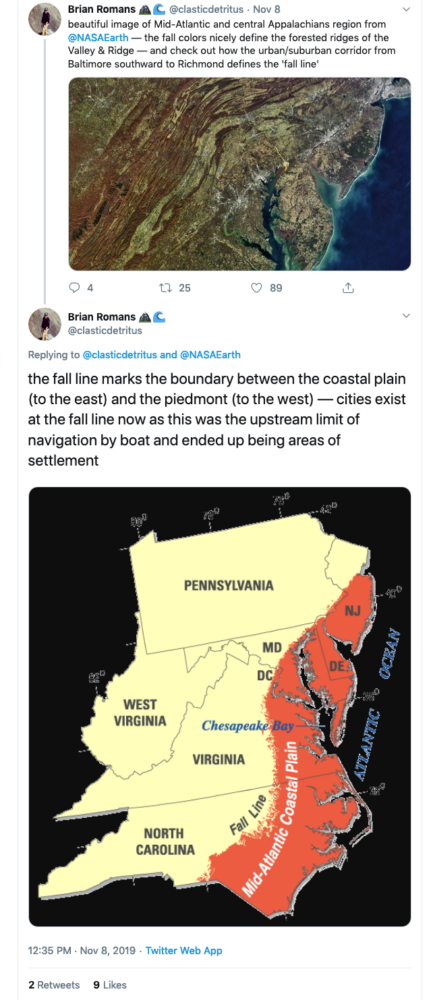
In November 2019, we highlighted this Landsat 8 image showing a glut of sediment flowing down the Susquehanna River into Chesapeake Bay. It was a striking, timely image, but one of the realities of publishing new content every day is that sometimes good information comes in after a deadline has passed.
In this case, Mark Trice, a water quality expert with the Maryland Department of Natural Resources, pointed out a few things about Susquehanna sediment after our story was out that seem worth passing on.
Among them: a link to a recent report that synthesizes and summarizes what scientists have learned about the ecological effects of high sediment flows on the Susquehanna River and the role of the Conowingo Dam. While the dam trapped most sediment and associated nutrient pollution (nitrogen and phosphorus) when it was first built, enough material has piled up behind the dam now that significant amounts of sediment and nutrients now flow past it during storms. A University of Maryland press release summarized the findings this way:
Most sediment and particulate nutrient impacts to the Bay occur during high-flow events, such as during major storms, which occur less than 10 percent of the time. Loads delivered to the upper Chesapeake Bay during low flows have decreased since the late 1970s, while loads during large storm events have increased. Most of these materials are retained within the upper Bay but some can be transported to the mid-Bay during major storm events, where their nutrients could become bioavailable.
The potential impact of reservoir sediments to Bay water quality are limited due to the low reactivity of scoured material, which decreases the impact of total nutrient loading even in extreme storms. Most of this material would deposit in the low salinity waters of the upper Bay, where rates of nitrogen and phosphorus release from sediments into the water are low.
“While storm events can have major short-term impacts, the Bay is actually really resilient, which is remarkable,” said the study’s lead author Cindy Palinkas, associate professor at the University of Maryland Center for Environmental Science. “If we are doing all of the right things, it can handle the occasional big input of sediment.”
Trice’s colleagues at the Maryland Department of Natural Resources (DNR) underscored the Bay’s resiliency to sediment as well when I asked about the recent event. “Although these high flow events routinely occur, the Bay is resilient and continues to show improvement due to the commitment by the Bay watershed partners to have all pollution reduction strategies implemented by 2025 to have a healthy Chesapeake Bay,” said Bruce Michael of Maryland DNR.
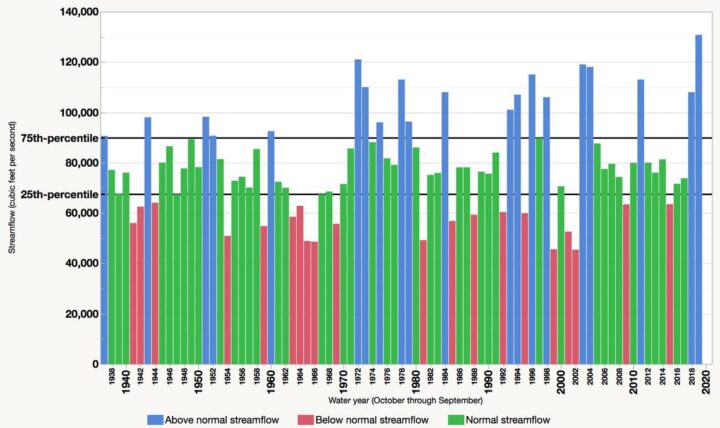
Also worth mentioning: the 2019 water year (October 1, 2018, to September 30, 2019) brought a record-breaking flow of freshwater into the Bay, Trice noted. “The annual average freshwater flow into the Chesapeake Bay during water year 2019 was 130,750 cubic feet per second, which is the highest annual amount since 1937, the first year for which data are available,” the U.S Geological Survey said.
Finally, thank you to Virginia Tech geology professor Brian Romans (@clasticdetritus) for pointing out something about the image that is unrelated to sediment but fascinating: the line of cities and suburbs running from Baltimore, Md., to Richmond, Va., marks the boundary between two key geologic zones: the flat Coastal Plain to the east and the more rugged Piedmont to the west. Interestingly, many cities are located along this “fall line” because rapids prevented boats from traveling any farther upstream when they were first settled.

Fire on Bellandur Lake on January 19, 2018. Photo by pee vee.
In Bengaluru, India, one of the city’s lakes is so polluted with sewage, trash, and industrial chemicals that it has an alarming habit of catching on fire. As recently as January 19, 2018, fire broke out on Bellandur Lake and burned for seven hours.
The same lake is notorious for churning up large amounts of white foam that has, at times, spilled from the lake and enveloped nearby streets, cars, and bridges. The water is so polluted that it can’t be used for drinking or bathing or even irrigation.
Bellandur Lake is not the only lake in Bengaluru with water quality problems. During a recent check, not one of the hundreds of lakes that the city tested was clean enough to be used for drinking or bathing.
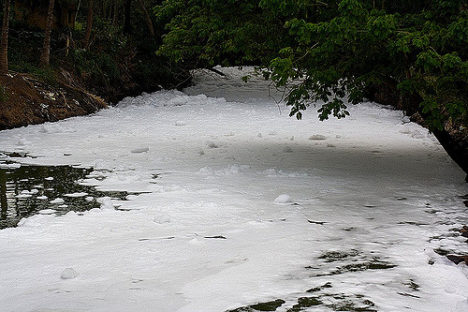
Foamy water flowing into Bellandur Lake. Photo by Kannon B.
I point this out on World Water Day to underscore that Bengaluru’s water woes, though extreme, are not particularly uncommon. According to the United Nations, a quarter of all people on the planet lack access to safely managed drinking water, and 40 percent of people live in areas where water scarcity is a problem. Roughly 80 percent of wastewater flows back into ecosystems untreated. Even in the United States, tens of millions of people may be exposed to unsafe drinking water, according to one recently published study.
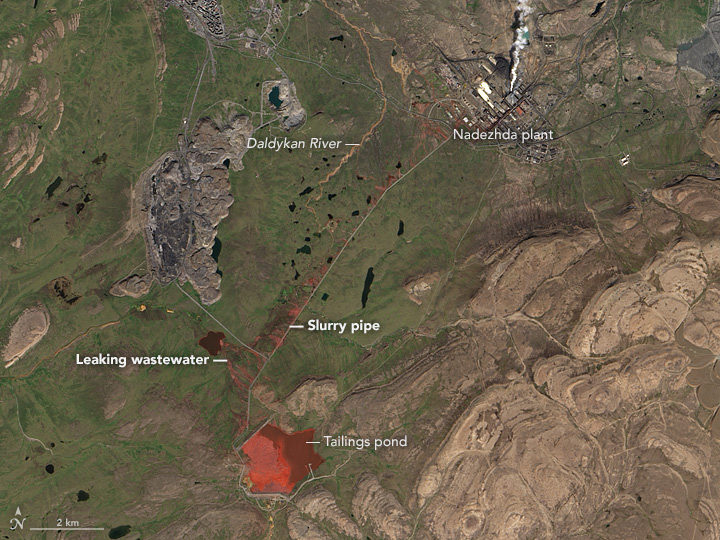
Even in the course of reporting for this website from a satellite perspective, we see signs of trouble. Capetown was on the verge of running out of water in February 2018. Drought pushed São Paulo’s reservoirs to near empty in recent years. The GRACE satellites have observed rapid depletion of groundwater in several critical aquifers. On more than one occasion, we have reported on rainbow-colored escaped mine tailings contaminating waterways.
NASA Earth Observatory image by Jesse Allen, using Landsat data from the U.S. Geological Survey. Learn more about the image here.
To push back against such problems, NASA’s Earth Science Division, and particularly its applied sciences program, is doing what it can to marshal the agency’s resources to make countries aware of what NASA resources are available to monitor and reduce the impact of water-related problems.

Learn more about the Sustainable Development Goals. Image by the United Nations.
As one piece of its water program, NASA scientists and staff are working with the United Nations to highlight key NASA datasets, tools, and satellite-based monitoring capabilities that may help countries meet the 17 sustainable development goals established by the international body. Goal number 6—that countries ensure the availability and sustainable management of water and sanitation for all—has been a particular focus of the NASA teams.
NASA and NOAA satellites collect several types of data that may be useful for water management. Sensors such as the Moderate Resolution Imaging Spectroradiometer (MODIS) and the Visible Infrared Imaging Radiometer Suite (VIIRS) collect daily data and images of water bodies around the planet that can be used to track the number and extent of lakes and reservoirs.
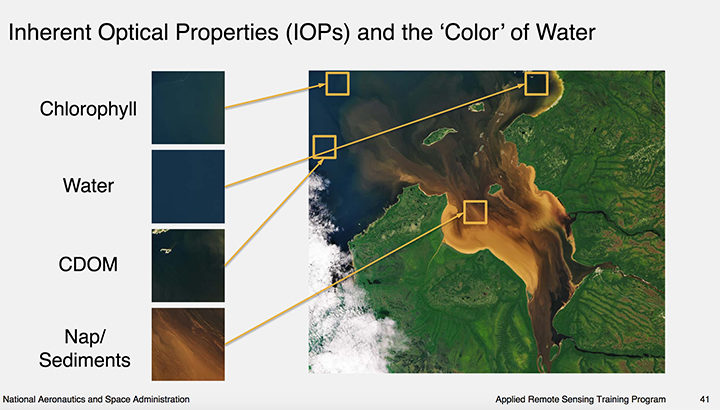
Image courtesy of this NASA ARSET presentation. Learn more about the image here.
The same sensors collect information about water color, which scientists use to detect sediment, chlorophyll-a (a product of phytoplankton and algae blooms), colored dissolved organic matter (CDOM), and other indicators of water quality.
The strength of MODIS and VIIRS is that these sensors collect daily imagery; the downside is that the data is relatively coarse. However, another family of satellites, Landsat, carries sensors that provide more than 10 times as much detail.
The combination of information from multiple satellites collected over time can be powerful. For instance, as we reported previously, a team of scientists based in China used decades of Landsat data to track a 30 percent decrease in the total surface area of lakes in Inner Mongolia between the 1980s and 2010. The scientists attributed the losses to warming temperatures, decreased precipitation, and increased mining and agricultural activity.
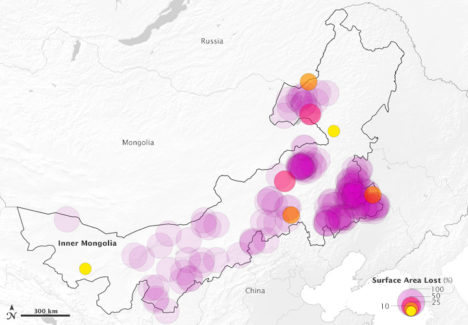
This map above depicts 375 lakes within Inner Mongolia that experienced a loss in water surface area between 1987-2010. The large, purple circles indicate a complete loss of water. Learn more about the map here.
Meanwhile, one of NASA’s scientists, Nima Pahlevan, is in the process of building an early warning system based on Landsat and Sentinel-2 data that will be used to alert water managers in near-real time when satellites detect high levels of chlorophyll-a, an indicator that harmful algal blooms could be present. While some blooms are harmless, outbreaks of certain types of organisms lead to fish kills and dangerous contamination of seafood. His team is working on a prototype system for Lake Mead in Nevada (see below), Indian River Lagoon in Florida, and certain reservoirs in Oregon. Eventually, he hopes to have a tool available that can be used globally.
“The idea is that we can get the information to water managers quickly about where satellites are seeing suspicious blooms, and then folks on the ground will know where to test water to determine if there’s a harmful algae bloom,” said Pahvalen. “We’re not suggesting that satellites can replace on-the-ground sampling, but they can be a great complement and make that work much work more efficient and less costly.”
To learn more about how satellites can be used to aid in the monitoring of water quality, see this workshop report and harmful algal bloom training module from NASA’s ARSET program.
