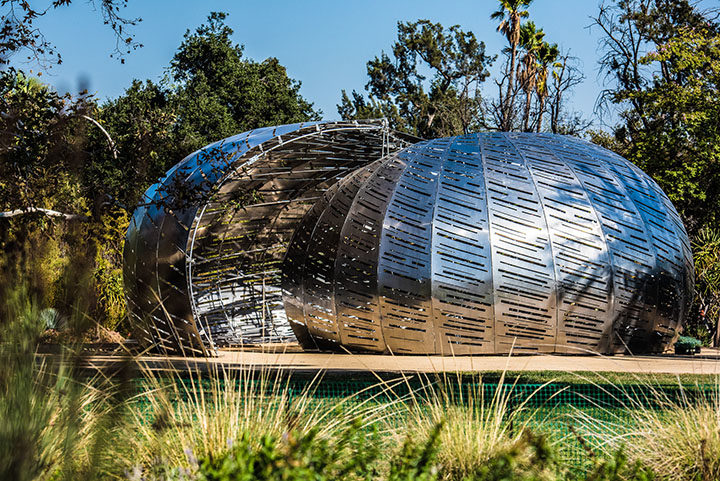
Orbit Pavilion. Image courtesy of NASA/Jet Propulsion Laboratory-Caltech/The Studio/Dan Goods
Sure, space may be silent, or at least absent the sound waves that human ears can hear. But put that aside for a moment, and try to imagine the sound of a satellite orbiting hundreds of miles above Earth’s surface.
Now imagine 19 sounds for 19 Earth-observing satellites — the murmur of ocean waves for a spacecraft that studies the oceans, or the howl of winds for one that studies hurricanes. Then swirl all of those sounds into a shell-shaped silver sculpture that looks like something from a sci-fi film.
Put the shell at the Huntington Library in southern California, walk inside, and you have Orbit Pavilion — an immersive piece of art and science communication designed to envelop people in sounds that represents the orbital movements of NASA’s fleet of Earth-observing satellites.
Dan Goods and David Delgado, artists working at The Studio at NASA Jet Propulsion Laboratory, initially developed the sound concept. They commissioned sound artist Shane Myrbeck to compose the soundscape, and Jason Klimoski and Lesley Chang of StudioKCA to envision and design a form.
Myrbeck describes the pavilion’s soundscape this way:
“The piece is in two parts, each with one sound following the path of a satellite. One section demonstrates the movement of the satellites by compressing a day’s worth of trajectory data into one minute, so listeners are enveloped by a symphony of 19 sounds swirling around them. The other section represents the real-time position of the spacecraft: each satellite currently in our hemisphere will “speak” in sequence, and when a sound is playing, if a listener points to the direction of the sound, they are pointing to the satellite orbiting hundreds of miles above us….These satellites are all part of Earth science missions, studying our atmosphere, oceans, and geology — they are helping us better understand how our planet is changing, and potentially how we can be better stewards of it. In that way I see them as kind of sentinels or protectors.”
The result, as Myrebeck had hoped, is both enveloping and comforting.

Information about the orbits of 17 satellites and two sensors on the International Space Station feed into the Orbit Pavilion. Image Credit: StudioKCA

The current fleet of Earth-observing satellites. Image Credit: NASA/EOSPSO
For a deeper dive into the diversity of the data these satellites collect, try searching a satellite’s name on Visible Earth. Or browse NASA Earth Observatory’s global maps sections and Image of the Day archive.
For instance, the map below helped me understand our planet a little bit better. It depicts more than a decade of cloudiness data as observed by the MODIS sensor. Blue shows areas where clouds were infrequent; white indicates areas where they were common.


Image Credit: NASA Earth Observatory, based on data from MODIS.
Today’s blog is re-posted from NASA.gov in recognition of the agency’s Earth Day activities.
NASA’s Worldview app lets you explore Earth as it looks right now or as it looked almost 20 years ago. See a view you like? Take a snapshot and share your map with a friend or colleague. Want to track the spread of a wildfire? You can even create an animated GIF to see change over time.
Through an easy-to-use map interface, you can watch tropical storms developing over the Pacific Ocean; track the movement of icebergs after they calve from glaciers and ice shelves; and see wildfires spread and grow as they burn vegetation in their path. Pan and zoom to your region of the world to see not only what it looks like today, but to investigate changes over time. Worldview’s nighttime lights layers provide a truly unique perspective of our planet.
What else can you do with Worldview? Add imagery by discipline, natural hazard, or key word to learn more about what’s happening on this dynamic planet. View Earth’s frozen regions with the Arctic and Antarctic views. Take a look at current natural events like tropical storms, volcanic eruptions, wildfires, and icebergs at the touch of a button using the “events” tab.
https://worldview.earthdata.nasa.gov
Worldview is an open-source project at NASA. All data, software, and services are freely available to anyone for any purpose. You can participate in the software development by visiting:
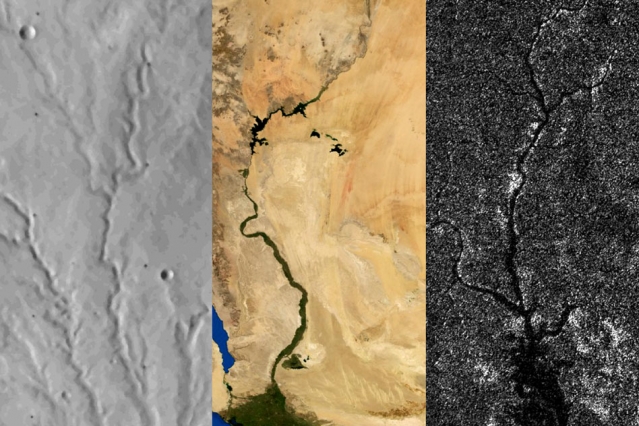
Rivers on three planetary bodies: the dry Parana Valles on Mars (left), the Nile River on Earth (middle), and Vid Flumina on Titan (right). Image by Benjamin Black using NASA data.
One of the more distinctive things about Earth among the planets is that we have plate tectonics. In other words, the hard, outer shell of the planet (called the lithosphere) is divided into several cool, rigid plates that float atop a hotter, more fluid layer of rock (the asthenosphere). These rigid surface plates do not float placidly: their grinding, colliding, shifting, and diving causes earthquakes, fuels volcanoes, builds mountains, tears open oceans, and constantly remodels and resurfaces the planet.
That is a far cry from what is happening on Mars and Titan, according to a recent study published in Science. Researchers came to that conclusion by carefully analyzing the way rivers cut through each of these planetary bodies. On Earth, countless rivers and streams snake their way across the surface. On Mars, rivers dried up long ago, but evidence of their presence remains etched into the arid surface. On Titan, Saturn’s largest moon, rivers of liquid ethane and methane still flow into lakes.
Artist’s cross section illustrating the main types of plate boundaries on Earth. (Cross section by José F. Vigil from This Dynamic Planet—a wall map produced jointly by the U.S. Geological Survey, the Smithsonian Institution, and the U.S. Naval Research Laboratory.)
By comparing imagery and data from all three planetary bodies, researchers noticed distinctive bends in the courses of rivers on Earth; these were formed as rivers were forced to wind around mountain ranges. These bends were absent in river networks on Mars and Titan. In an MIT press release, Benjamin Black, a geologist at the City College of New York, explained:
“Titan might have broad-scale highs and lows, which might have formed some time ago, and the rivers have been eroding into that topography ever since, as opposed to having new mountain ranges popping up all the time, with rivers constantly fighting against them.”
Read more about the study from New Scientist, Space.com, and the American Association for the Advancement of Science. Read the full study in Science. Read this NASA Earth Observatory story to learn more about how scientists are using satellites to study river width on Earth.
In the triptych at the top of the page, the image of Parana Valles on Mars was acquired by the Viking 1 orbiter on September 13, 1976. The image of the Nile was captured by NASA’s Terra satellite on August 10, 2000. NASA’s Cassini spacecraft captured the image of Vid Flumina on Titan on September 26, 2012.

While water does not flow on Titan, rivers of methane and ethane flow into lakes near the moon’s northern pole. Learn more about this image from the NASA Jet Propulsion Laboratory Photojournal.
