According to a new report from the World Meteorological Organization, seasonal weather conditions have not yet played a large role in influencing the spread of the virus that causes COVID-19. Government interventions and human behavior have been much more influential, according to the group of experts in Earth science, medical sciences, and public health.
“We saw waves of infection rise in warm seasons and warm regions in the first year of the pandemic, and there is no evidence that this couldn’t happen again in the coming year,” said Ben Zaitchik, the co-chair of the World Meteorological Organization team and a Johns Hopkins University earth scientist. At the start of the pandemic, there was some speculation that seasonal weather could influence the spread of COVID-19, with the virus spreading more readily in cooler, drier weather and spreading less in warmer, wetter seasons. “At this stage, evidence does not support the use of meteorological and air quality factors as a basis for governments to relax their interventions aimed at reducing transmission.”
Zaitchik also leads a NASA-funded team assessing the same topic. As we reported in August, that team is using weather reanalysis models and various statistical techniques to look for signals in satellite data and other sources of environmental data. Their goal is to detect potential relationships between environmental conditions (such as temperature, humidity, ultraviolet light, and rainfall) and the spread and severity of COVID-19.
Zaitchik recently published an article in Nature Communications that urges the research community to strive for rigor in designing studies on COVID-19 seasonality and for clarity in communicating findings so as to avoid confusing the public and policymakers with conflicting results. We checked in with Ben in March 2021 for an update on his research as COVID-19 cases were dropping in the United States and other countries.
Earth Observatory: The number of COVID-19 cases has been on quite a roller-coaster ride this year. What are the main drivers of the ups and downs in infection rates?
Zaitchik: It is pretty clear that the primary driver is still human behavior. When we stay home and stay socially distant, there is less transmission. That explains the biggest swings we’ve seen in the case curve in the United States and in other countries. As we see vaccines roll out in some countries, along with accumulating infections, we are likely also seeing the beginnings of herd immunity playing a role.

EO: We saw a surge of cases in the United States in the early part of winter and then a drop in February. Is that related to the weather?
Zaitchik: There are direct ways that weather might affect virus survival or our immune systems, but the most important effect now is indirect. If weather conditions make it easy for people to stay outside and to avoid crowding, then it is possible the weather can reduce transmission rates; vice versa if people are crowding indoors. That understanding is based on our experience with other upper respiratory viruses; on studies that show the potency of transmission in crowded indoor environments; and to some extent statistical analyses of patterns we have seen in the first year of COVID-19. But that last line of evidence still requires investigation. While the number of cases can sometimes align with seasonal patterns, that is not always the case. It does appear that weather conditions can reinforce case trends, but the impact of weather is still highly uncertain.
EO: Is it fair to say that how people behave in cooler, drier seasonal conditions is probably more important than how the virus reacts to the environment?
Zaitchik: It does appear that virus sensitivities exist. Coronaviruses are less stable at higher temperatures, when exposed to intense sunlight, and under certain humidity conditions. It is just not clear yet whether those sensitivities have mattered appreciably for transmission of COVID-19 so far. In general, those sensitivities suggest there are better chances for the virus to survive and thrive under wintertime conditions, leading to greater transmission potential. But in the end, the main driver of the spread is human behavior.
EO: How is your NASA-funded research project on COVID-19 seasonality going? Do you have any results yet?
Zaitchik: We have made a lot of progress on data integration and alignment, which has allowed us to release a consistent and quality-controlled database of COVID cases and hydrometeorological variables that is available to the public via GitHub. We think this is really important for studies of weather and COVID-19 since so many studies have suffered from questionable data or have been unrepeatable. We’ve also begun to understand why there were so many conflicting results in early publications on COVID’s weather sensitivity, and how the contribution of human movement to predictability of transmission rate has changed over time.
EO: How has your thinking changed about the potential seasonality of COVID-19 since the beginning of the pandemic?
Zaitchik: It hasn’t really changed much. Going into this, epidemiologists anticipated that we might see something like a cold weather peak in transmission just because so many other upper respiratory viruses do that. But we also knew that our instincts on seasonality come from endemic diseases like influenza, and that there is plenty of evidence from previous epidemics that viruses can spread even when the weather is unfavorable. That we are seeing some evidence of seasonality — but with lots of unexplained variability — is reasonably consistent with what epidemiologists expected.
EO: Americans are most familiar with how the pandemic has progressed in this country, while satellites excel at showing a global perspective. What are you seeing and learning from global data?
Zaitchik: The global perspective is really important. From a weather and COVID-19 perspective, we have seen interesting hemispheric patterns. For instance, there is some evidence that Southern Hemisphere countries experienced a peak in their winter, while Northern Hemisphere cases rose as our winter settled in. But there are also exceptions to that pattern, like the summertime peak in the US or the consistently low case counts in east Asian countries. Looking at the environment across countries and climate zones, we see a complicated, multi-scale set of patterns that we need to decipher. The global perspective is powerful because it has the potential to yield some general insights. It is also powerful because it can correct some too-simple narratives that have emerged from looking at one country at a time.
NASA, the European Space Agency (ESA), and the Japan Aerospace Exploration Agency (JAXA) have joined forces to create the COVID-19 Earth Observation Dashboard. The web platform combines the collective scientific power of the agencies’ Earth-observing satellites to document changes in the environment and society in response to the pandemic.
The dashboard is a user-friendly tool to track changes in air and water quality, climate change, economic activity, and agriculture.
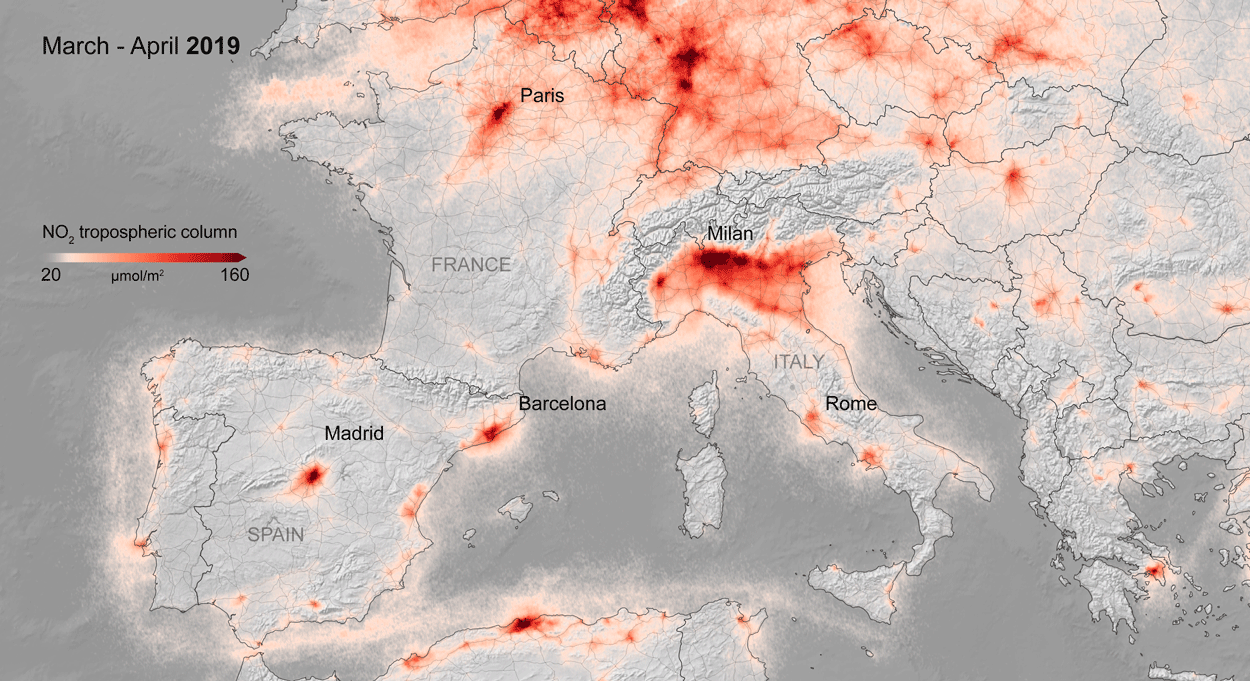
Air quality changes were among the first noticeable impacts of pandemic-related stay-at-home orders, and the resulting reductions in industrial activity, that could be tracked through satellite observations. Reductions in nitrogen dioxide (NO2) levels — primarily related to temporary reductions in the burning of fossil fuels — show up clearly in satellite data.
A preliminary analysis also indicates that planting (farming) activity dropped during the quarantines and lockdowns. For example, the cultivated area of white asparagus in Brandenburg, Germany, has been 20 to 30 percent lower this year, compared to 2019. More information on agricultural productivity changes will be added to the dashboard in the months to come.
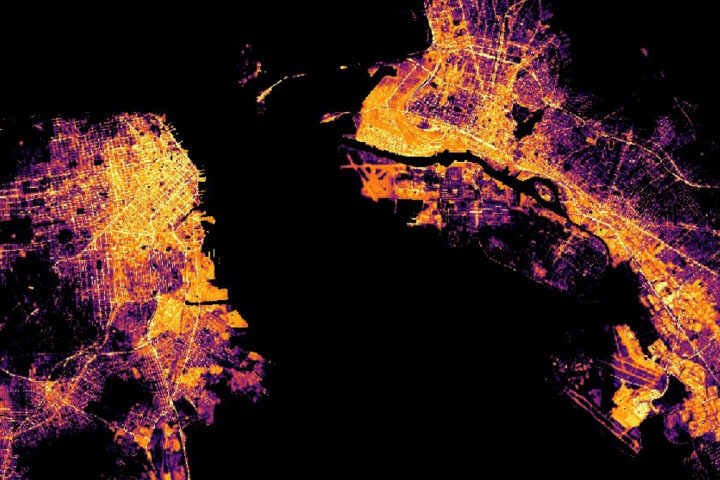
Recent water quality changes have been reported in a few locations that typically have intense industry and tourism — activities that have decreased during the pandemic. Data on ship identification, construction activity, and nighttime lights (above) are featured on the dashboard to keep track of some of the economic ramifications of the virus.
Together, ESA, JAXA, and NASA will continue to add new observations to the dashboard in the coming months to see how these indicators change. Learn more in the NASA press release, the video below, or by exploring the dashboard.
To counter the rapid spread of COVID-19 in the winter and spring of 2020, quarantines and social distancing measures were implemented around the world. Air traffic nearly ceased; non-essential businesses were closed; and the number of vehicles on the road fell well below normal.
Remote sensing scientists have started looking at potential changes in the environment due to these changes in human behavior. They are looking for signs of how environmental factors such as humidity, temperature, and ultraviolet radiation might play a role in the behavior of the virus. Some may also look for data related to access to water resources, which can be critical to the spread or prevention of certain diseases.
NASA’s Earth Science Data Systems program has developed a new web-based tool, the COVID-19 Data Pathfinder, which provides links to datasets that can be used to research changing environmental impacts from modified human behavior patterns, the possibility of seasonal trends in virus transmission, and water availability. The COVID-19 Data Pathfinder is also a resource for participants in NASA’s Space Apps COVID-19 Challenge, providing an intuitive means for new users to find and use NASA data.
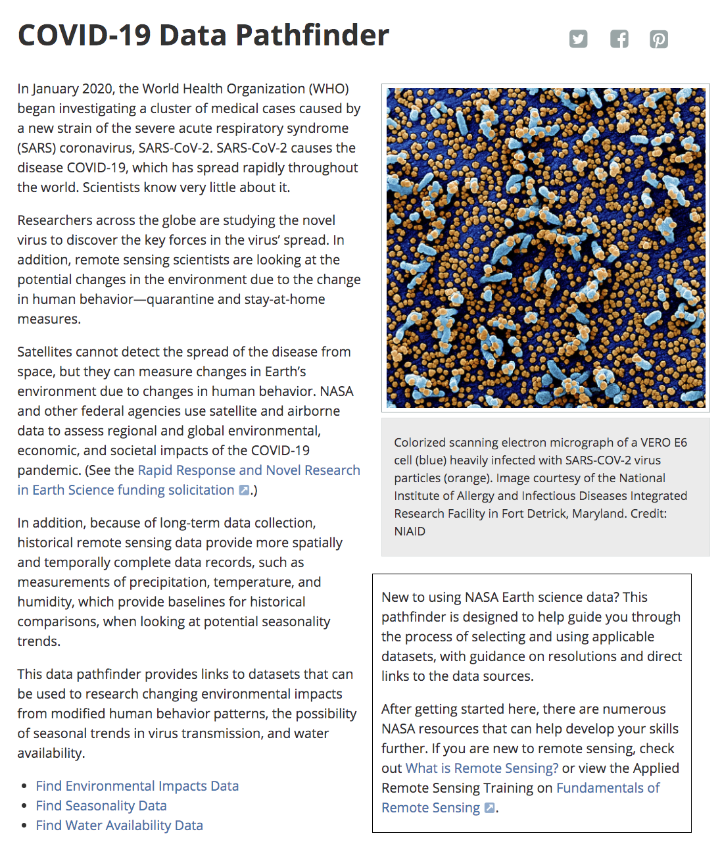
Web view of the COVID-19 Data Pathfinder page
“As you take this constant drumbeat of new information and research in, remember that this virus is new to science and people have only just started studying it. Doing high-quality, definitive science takes time, sometimes a long time. The appetite for answers is understandably intense, but we also have to try to balance that hunger with patience.”
– Benjamin Zaitchik, a Johns Hopkins University researcher working to understand whether environmental factors are affecting the spread of coronavirus.
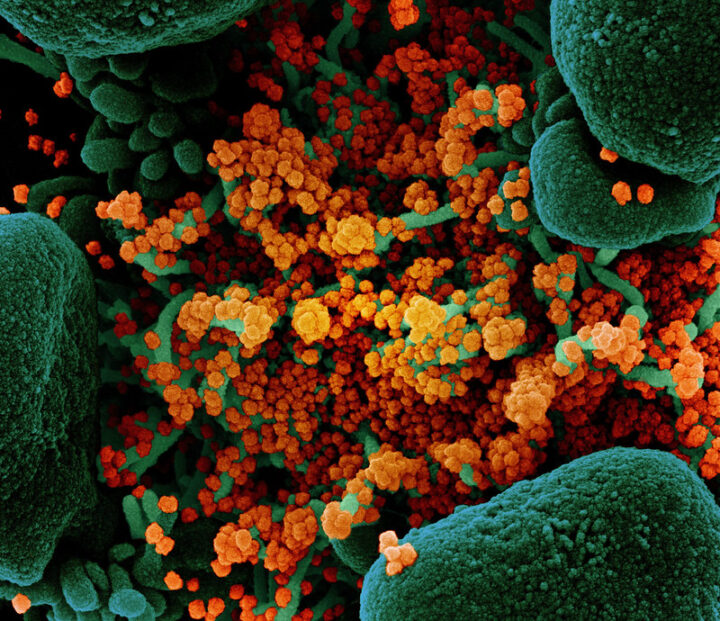
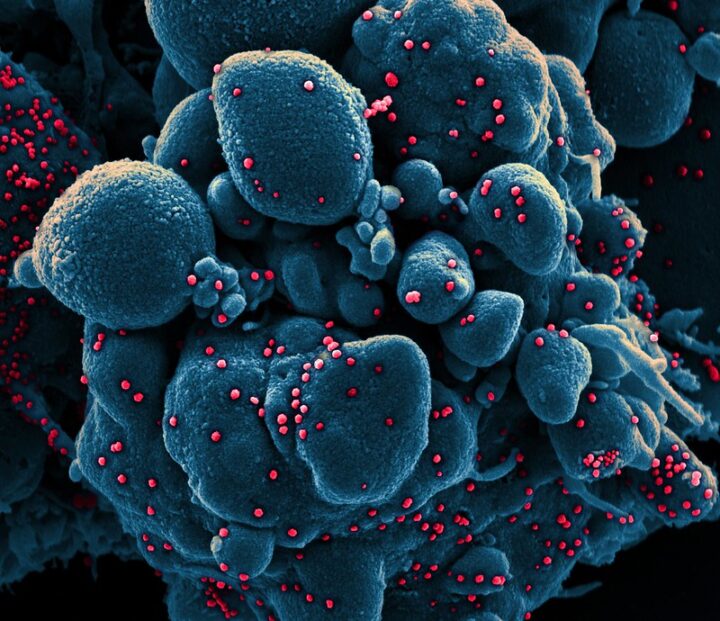
Ever since a new and deadly strain of coronavirus (SARS-CoV-2) emerged in China and then spread around the world, the virus has upended life in many countries. Scientists at NASA and other institutions have hustled to track and make sense of our new reality with every tool and technique at their disposal, including satellite data.
As several comprehensive NASA-funded research projects get started, here is a quick roundup of some of the more interesting satellite-related findings about the science of coronavirus and its effects on the environment.
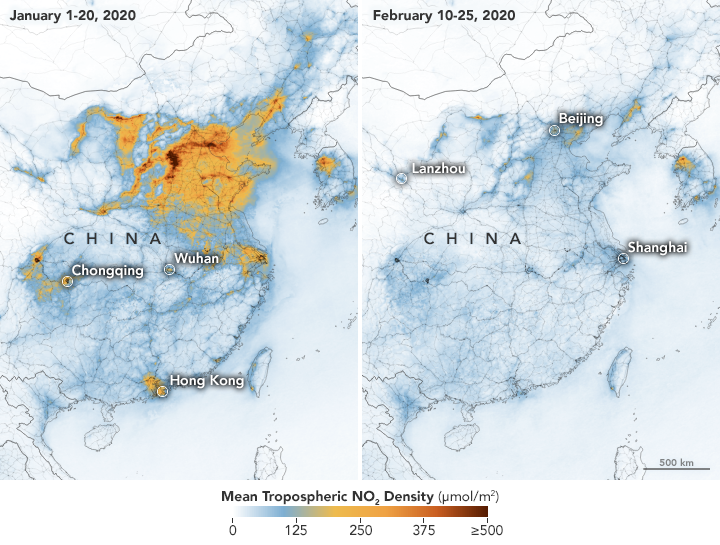
Much of the news about the new coronavirus is grim, but observations of air quality offer a breath of fresh air. Several satellite sensors have detected drops in air pollutants — including nitrogen dioxide, carbon monoxide, and fine particles — following restrictions on travel and economic activity. Teams of scientists have spotted changes in China, Europe, the U.S. Northeast and Southeast, and India.
Look here for some tips on how to find and visualize changes in nitrogen dioxide, one of the gases that most clearly shows the effects of quarantines and economic shutdowns. Also, look here for nitrogen dioxide data for cities all around the world. But beware: As University of Georgia meteorologist Marshall Shepherd has pointed out, clouds and rain can create confusing changes in nitrogen dioxide that have nothing to do coronavirus restrictions.
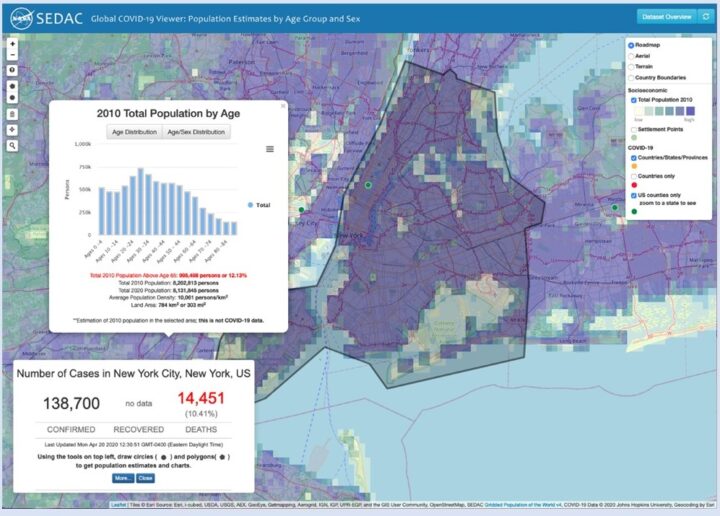
Given how much the virus has changed daily life, many of us find ourselves turning into armchair epidemiologists, trying to make sense of how the virus is spreading and what it means for our local area. If you are interested in taking a close look at new data as it comes in, this simple-to-use mapping tool from NASA’s Socioeconomic Data and Applications Center (SEDAC) might be of interest. It features demographic data, along with regularly updated information on reported global cases of the novel coronavirus (COVID-19). There is a short user guide here.
One of the key unknowns about the new coronavirus is whether environmental conditions — such as temperature, humidity, and exposure to ultraviolet light — have any effect on how the virus spreads or on the severity of the symptoms. NASA-funded researchers are starting to investigate this in several ways, while others are using NASA data in their models and analyses.
Some controlled laboratory research has suggested that exposure to warm air may make it more difficult for the virus to survive and spread. That has led many researchers around the world to start analyzing epidemiological and meteorological data to see if certain environmental factors have a significant impact on the virus in the real world. At this point it is too early to say, declared the National Academy of Sciences in a report on April 7, 2020, but the research continues.
Billions of people are facing something that NASA astronauts have plenty of experience with—living in social isolation for long periods with just a few other people. Here are some tips from astronaut Anne McClain and psychologist Tom Williams.
