Every month on Earth Matters, we offer a puzzling satellite image. The March 2020 puzzler is above. Your challenge is to use the comments section to tell us what we are looking at, where it is, and why it is interesting.
How to answer. You can use a few words or several paragraphs. You might simply tell us the location, or you can dig deeper and explain what satellite and instrument produced the image, what spectral bands were used to create it, or what is compelling about some obscure feature. If you think something is interesting or noteworthy, tell us about it.
The prize. We cannot offer prize money or a trip to Mars, but we can promise you credit and glory. Well, maybe just credit. Roughly one week after a puzzler image appears on this blog, we will post an annotated and captioned version as our Image of the Day. After we post the answer, we will acknowledge the first person to correctly identify the image at the bottom of this blog post. We also may recognize readers who offer the most interesting tidbits of information about the geological, meteorological, or human processes that have shaped the landscape. Please include your preferred name or alias with your comment. If you work for or attend an institution that you would like to recognize, please mention that as well.
Recent winners. If you’ve won the puzzler in the past few months, or if you work in geospatial imaging, please hold your answer for at least a day to give less experienced readers a chance.
Releasing Comments. Savvy readers have solved some puzzlers after a few minutes. To give more people a chance, we may wait 24 to 48 hours before posting comments. Good luck!

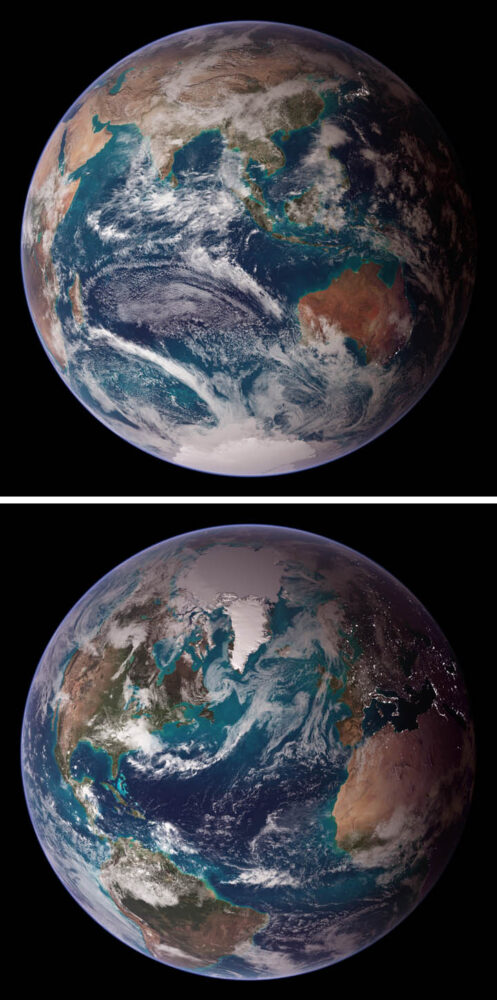
It has been a tough month on Earth. Good news has been scarce. But here’s at least one update ― from one million miles away ― to appreciate.
The Deep Space Climate Observatory (DSCOVR) satellite, which had been out of commission for about nine months due to a technical problem, is fully operational again, according to NOAA. Issues with the satellite’s attitude control system prompted engineers to put the satellite into a “safe hold” in June 2019, but they recently developed a software fix for the problem.
And that means that the satellite’s Earth Polychromatic Imaging Camera (EPIC) is once again taking beautiful full-disk images of our home several times each day. NASA’s EPIC instrument acquired the image of Africa and Europe (above) on March 19, 2020.
Head over to the science team page for EPIC and take a few moments to savor some imagery of our ever-changing planet. If Twitter is more your style, check out @DSCOVRDaily. Look carefully and you’ll see clouds and storm fronts coming and going, plumes of dust or smoke rising and fading, and whole continents greening and browning as the seasons change.
The EPIC view is a potent reminder of something that Frank White, author of The Overview Effect, said recently on a NASA podcast. (The book explores how seeing Earth from space causes many astronauts to dramatically change their outlook on our planet and life itself.)
“[One of the] conclusions they draw is that we are really all in this together,” he said. “Our fate is bound up with people that we may think are really different from [us]. We may have different religions, we may have different politics. But ultimately, we are connected. Totally connected.”
In February, we showed a drop in nitrogen dioxide (NO2) levels over China as a result of the coronavirus quarantine. New data from the European Space Agency (ESA) now show drops in NO2 concentrations over Italy due to that country’s nationwide lockdown. The change is particularly evident in the Pro Valley of northern Italy.
The video above shows NO2 levels across Europe from January 1 to March 11, 2020. These data come from ESA’s Tropospheric Monitoring Instrument (TROPOMI) onboard the Copernicus Sentinel-5P satellite. NO2 is a noxious gas emitted by motor vehicles, power plants, and industrial facilities.
ESA stated: “Although there could be slight variations in the data due to cloud cover and changing weather, we are very confident that the reduction in emissions that we can see coincides with the lockdown in Italy causing less traffic and industrial activities.”
Read more here…
For more information on NASA’s long-term measurements of nitrogen dioxide, please see this page.
The coronavirus (COVID-19) epidemic is first and foremost an issue of human health and safety. But as people have changed their everyday behaviors and patterns to contain or avoid the virus, there have been some subtle effects on the environment. There also has been misinformation. Below are four ways the virus is—and is not—affecting the environment in China.
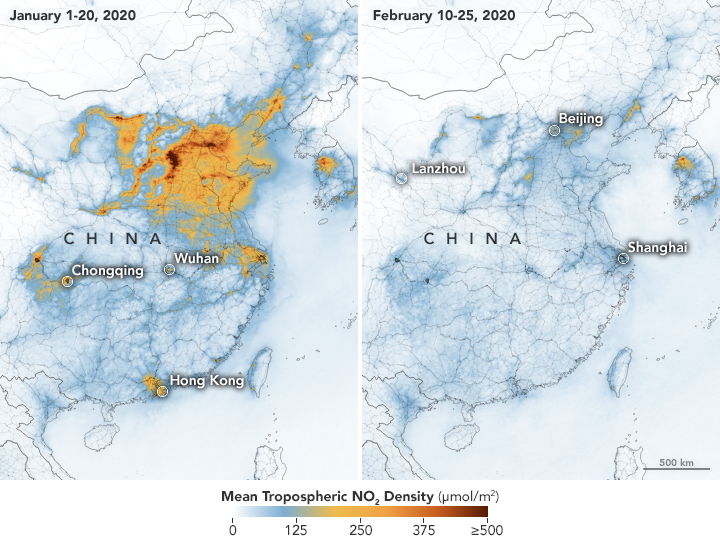
On February 28, we reported how decreases in industrial, transportation, and business activity since the coronavirus outbreak had reduced levels of atmospheric nitrogen dioxide (NO2) over China. But researchers note that a measurable change in one pollutant does not necessarily mean air quality is suddenly healthy across the country.
In February, news outlets reported unhealthy air pollution in Beijing, which was largely affected by airborne particulate pollution known as PM 2.5. As reported in the South China Morning Post, “weak winds, high humidity and a strong thermal inversion had trapped bad air in the city.” NASA satellites also showed a high load of airborne aerosols. Measurements of aerosol optical depth depict how the abundance of natural or manmade particles in the air prevents light from traveling through the atmosphere to the ground.
Beyond aerosol emissions, weather also plays an important role in determining air quality. NASA/USRA researcher Fei Liu notes that wind patterns and the height of the planetary boundary layer — the lowest layer of the troposphere near Earth’s surface — are important meteorological factors. Planetary boundary layer height influences how air pollution mixes vertically in the atmosphere. If the height of the boundary layer is high, then air pollutants can move higher into the atmosphere and concentrations will be lower near the ground (and vice versa). Liu and her colleagues are currently studying how changes in such meteorological factors may have influenced the decrease in NO2 before and during the quarantine.
For more information on NASA’s long-term measurements of nitrogen dioxide, please see this page.

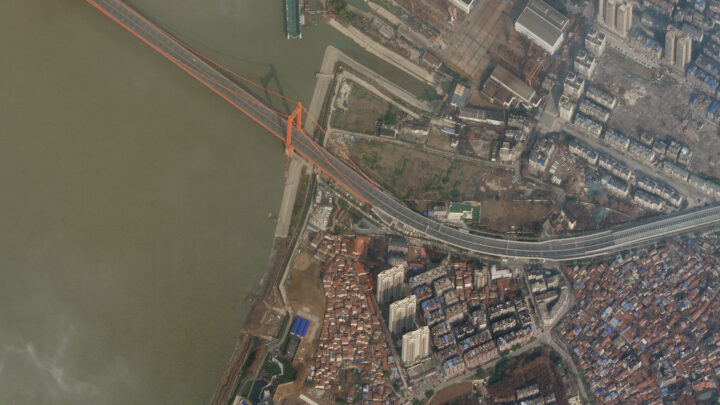
It is no surprise that road traffic in China’s major cities has been lighter, as many people have been forced to stay home and public transportation has been shut down. Satellite imagery from Planet Labs captured scenes of reduced traffic and empty parking lots near the Wuhan train station and airport. Trains stopped running around January 22, when the first quarantines began. And compared to late January 2019, domestic flights within mainland China this year dropped by 60 to 70 percent.
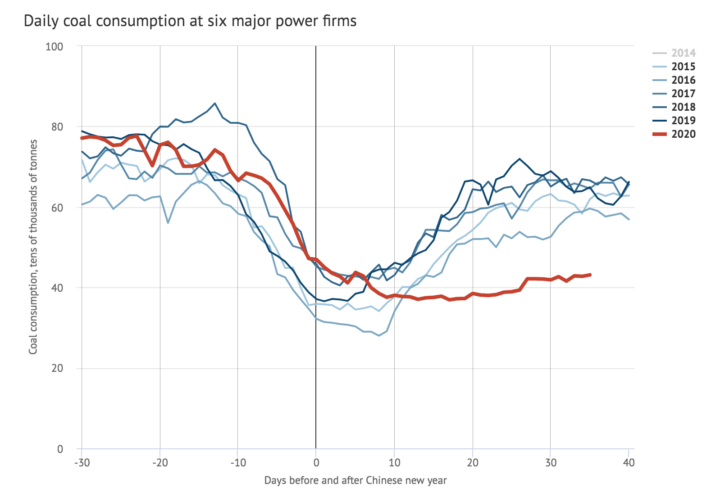
A report in Carbon Brief stated that key industries in China were operating at much lower-than-normal levels during the quarantine. Oil refinery operations in Shandong province, for instance, were at their lowest since 2015. Average coal consumption at power plants also reached a four-year low. As a result, carbon dioxide (CO2) emissions were at least 25 percent lower in the two weeks following the Lunar New Year compared to 2019. However, that decrease in CO2 emissions for two weeks would only reduce annual totals by approximately 1 percent.
In February 2020, a map floating around on social media showed increased sulfur dioxide (SO2) concentrations near Wuhan. Some news outlets prematurely speculated that the elevated levels of SO2 were due to an increase in human cremation.
The data for the map came from NASA’s GEOS earth system model and were not based on real-time observations of SO2. NASA’s Arlindo da Silva explained that while the GEOS model assimilates many ground-based and satellite observations to constrain meteorological conditions such as winds, humidity, and temperature, it currently does not ingest any real-time observations of sulfur dioxide. In the model, the concentrations of SO2 are estimated from historical emissions sources that are transported around the globe by atmospheric circulation. Therefore, da Silva said, GEOS model simulations cannot account for variations in SO2 concentrations arising from a sudden change in human activity (like a quarantine). Essentially, the model output of enhanced SO2 was not completely reflecting reality in this case.
Secondly, as the writers at Snopes pointed out, sulfur dioxide is commonly associated with burning coal — not burning human corpses.
Since its launch on the web in April 1999, NASA Earth Observatory has published more than 15,500 image-driven stories about our planet. In celebration of our 20th anniversary — as well as the 50th anniversary of Earth Day — we want you to help us choose our all-time best image.
For now, we need you to help us brainstorm: what images or stories would you nominate as the best in the Earth Observatory collection? Do you go for the most beautiful and iconic view of our home? the most newsworthy? the most scientifically important? the most inspiring?
Search our site and then post the URLs of your favorite Earth images in the comments section below. Please send your ideas by March 17.

In late March 2020, we will include some of your selections in Tournament Earth, a head-to-head contest to vote for the best of the best from our archives. Each week, readers will pick from pairs of images as we narrow down the field from 32 nominees to one champion.
The all-time best Earth Observatory image will be announced on April 29, 2020, the end of our anniversary year.
If you want some inspiration as you begin your search, take a look at the galleries listed below. Or use our search tool (top left) to find your favorite places, images, and events.
