On April 29, 1999, NASA Earth Observatory (EO) started delivering science stories and imagery to the public through the Internet. So much has changed in those 20 years…
+ In 1999, about 3 to 5 percent of the world had Internet access. About 41 percent of American adults used the World Wide Web, most often to look at the weather. Today an estimated 56 percent of the world’s population (4.3 billion people) are active on the Internet.
+ At the end of the 20th century, all EO readers came to us through a computer, mostly desktops. One third of them were connecting via dial-up modem. Today, about 40 percent of our audience arrives to the web site via mobile phones and tablets on public wifi and cellular networks. Yet even now, 65,000 of our most loyal followers subscribe to our newsletters. Many others subscribe to our RSS feeds.
+ In 1999, “social” media mostly consisted of chatrooms and newsgroups. Even by 2005, only 5 percent of Americans were using social media. Today about 69 percent of adults use social media, and people are just as likely to see Earth Observatory content on social platforms as on our web site. Ten million people follow EO and NASA Earth science on Facebook, with 1.3 million more on Twitter, and 500,000 on Instagram.
+ When EO launched, images from Earth science satellites were generally available about a month after acquisition. Public access to science data and imagery was extremely limited, highly filtered, and sometimes required a fee. Two decades later, many NASA Earth science observations are available freely on the web within hours of acquisition.
+ On our first day online, the site got 400 pageviews–most of them were likely colleagues and relatives. Today we get about 50,000 views per day.
+ In our first year, we published 35 “Images of the Week” and 9 feature stories. By 2001, we started delivering an Image of the Day. Since launch, we have published more than 6,900 Images of the Day, 8,300 natural hazards images, and 450 features and videos. Yes, more than 15,000 image-driven stories, and all of them are still available in our archive.
+ In 1999, two members of our staff were in elementary school and three were in high school. The readers of EO Kids were not born yet.
The technology of science and the Internet has changed in a generation, and our site has evolved and grown with the changes. But our core values have not changed. You find us on more platforms and with some new approaches, but you can still count on us to deliver beautiful, newsworthy, interesting, and scientifically important images and stories. Our editorial team has more than 110 years of experience in science communication and data visualization, and we bring that depth of knowledge to every story, 365 days a year.
None of this would be possible without the many scientists, engineers, communicators, data hounds, patrons, and friends inside and outside of NASA who review our work, tip us off to stories and images, share their scientific insights, and inspire and challenge us. Thank you.
As we celebrate our 20th year, we are going to share some looks back and some looks ahead. In the next twelve months, look for…
If you have been with us for many (or all) of our 20 years, thank you. We have some of the most engaged, challenging, and thoughtful readers on the planet, and we work hard to live up to your trust and interest. If you are new to the site, bring a friend. We have 15,000 stories about Earth to share, with more being added every day.
Related Links and References
Earth Observatory 10th Anniversary
Pew Research Center (2018) World Wide Web Timeline
Internet World Stats (2019) Internet Growth Statistics
Wikipedia (2019) Global Internet Usage
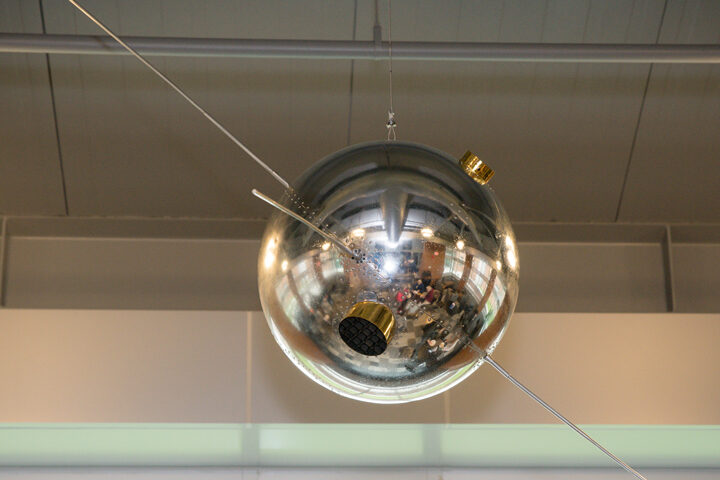
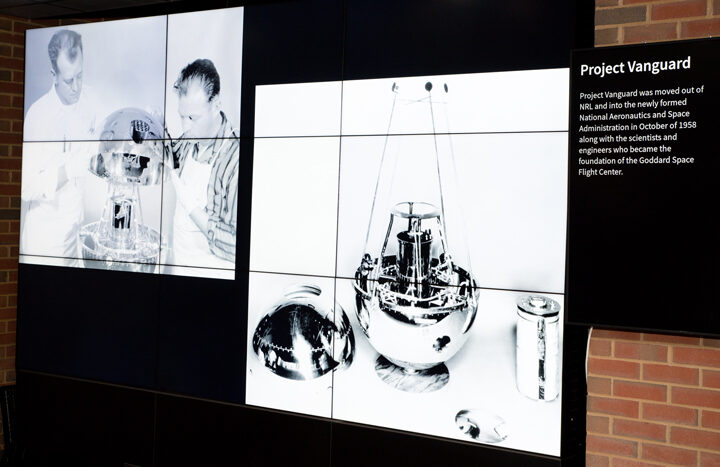
The shiny metallic orb hanging in the Earth sciences building at NASA’s Goddard Space Flight Center looks a lot like a fixture you might find at a modern home décor store. But this mid-century marvel is not for sale. It is a restored flight backup of Vanguard II, Earth’s first weather satellite.
The satellite model was hung this week as a reminder of the people who helped build the foundation for making space-based observations of Earth. Paul Newman, chief scientist for Earth science at NASA Goddard, described the satellite:
“Vanguard II was the world’s first meteorological satellite. Developed at the U.S. Naval Research Laboratory (NRL), it was successfully launched by newly formed NASA on February 17, 1959. Vanguard carried two photocells that could scan cloud cover as the satellite rotated in its orbit around the Earth. Unfortunately, the 3rd stage SLV-4 launch vehicle burn caused a precession in the satellite that made the data unusable.”
“While the now silent Vanguard II continues to orbit the Earth, its back-up brother has been restored and mounted in the Goddard Space Flight Center’s Earth Sciences building’s atrium—a fitting resting place amongst the scientists and meteorologists who monitor and study our Earth.”
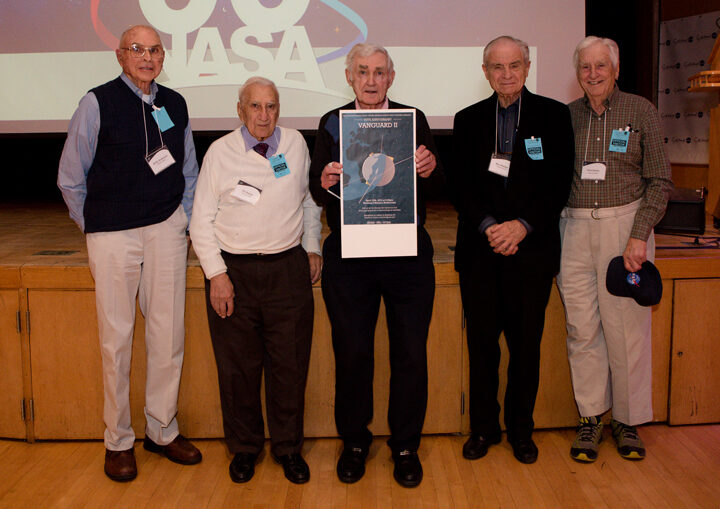
Some of those scientists, and five retirees from the original NRL Vanguard II team, gathered on April 15, 2019, at NASA Goddard to celebrate the satellite’s 60th anniversary. Angelina Callahan, historian at the U.S. Naval Research Laboratory, reflected on the historical importance of the Vanguard era. From building satellites and their launching vehicles, to putting satellites in orbit and tracking them, the achievements of the program helped pave the way for satellite missions that followed.
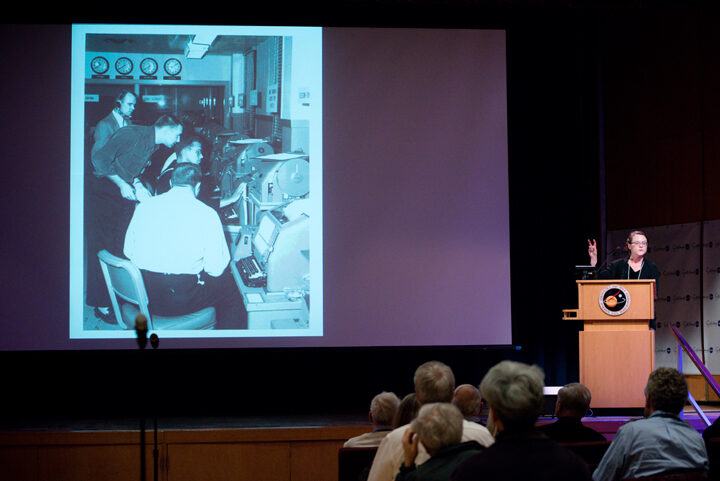

The reflection was also a study on how much has changed. Ron Gelaro, an atmospheric scientist at NASA Goddard, discussed weather prediction in the modern satellite era. Vanguard II carried two photocells and weighed just 21 pounds. The Aqua satellite—launched in 2002 to collect information on Earth’s water systems—carries six instruments and weighs more than 6,000 pounds. Gelero noted, however, that satellites are starting to trend back toward smaller vehicles, such as constellations of microsatellites.
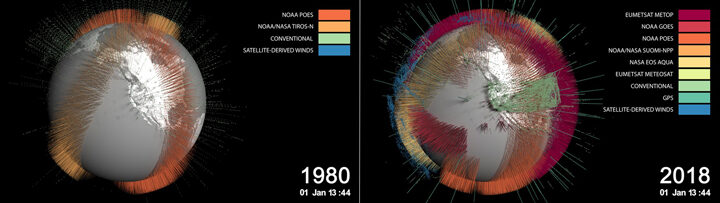
The amount of observations available for understanding weather and climate have also skyrocketed over the decades. For example, MERRA-2 is a reanalysis project at NASA Goddard that combines satellite measurements of temperature, moisture, and winds in the GEOS model. In 1980, MERRA assimilated 175,000 observations for every six-hour period. That number in 2018 neared 5 million observations.
According to NRL: “The scientific experiments flown on the Vanguard satellites increased scientific knowledge of space and opened the way for more sophisticated experiments. Vanguard was the prototype for much of what became the U.S. space program.”
In fact, about 200 scientists and engineers from the Vanguard program moved from NRL to the newly formed NASA in 1958—forming the core of NASA Goddard. You can read more about Vanguard here.
For Earth Day 2019, NASA invites you to celebrate the planet we call home with our #PictureEarth social media event.
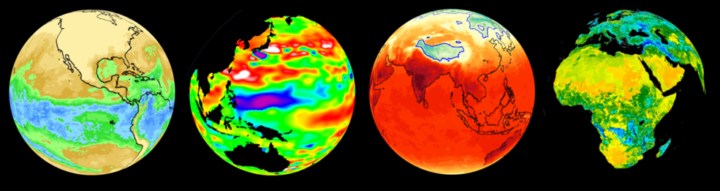
NASA studies Earth as part of its mission. Our satellites and instruments #PictureEarth daily. Some take visible light photos, much like your camera. Others peer into the infrared, microwave, ultraviolet, or radio spectrums, which human eyes cannot see. Each satellite image or data set reveals a small detail of the land, water, atmosphere, and life on Earth.
How do you #PictureEarth?
Show NASA how you see your planet by posting photos on social media. Focus on the details around you with close-up images.
What makes your location special?
What are the textures, colors, or patterns in your surroundings?
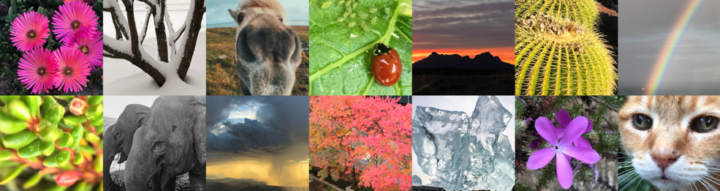
Look for Earth’s dynamism, motion, and beauty: blooming flowers, crashing waves, sturdy trees, furry and feathered animals, molten lava, puffy clouds, smooth ice, and warm sunlight.
Share your best Earth photo!
On Earth Day — April 22, 2019 — share your best photos of Earth on social media with the hashtag #PictureEarth. Be sure to tell us where your photo was taken. We love to read posts from around the world because NASA Earth data is available to everyone – we all live on this planet together.
We’ll be watching on Instagram, Twitter, and our Facebook event page for your images and messages. As with our previous Earth Day events, we’ll select some of the publicly-shared photos to showcase in videos and composite images featuring your beautiful imagery.
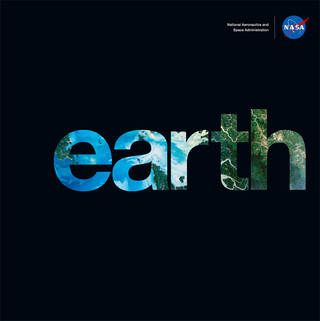
Then download the NASA Earth photo book
To see how we #PictureEarth from space, download the new Earth photo book or read it online: https://earthobservatory.nasa.gov/features/earth-book-2019
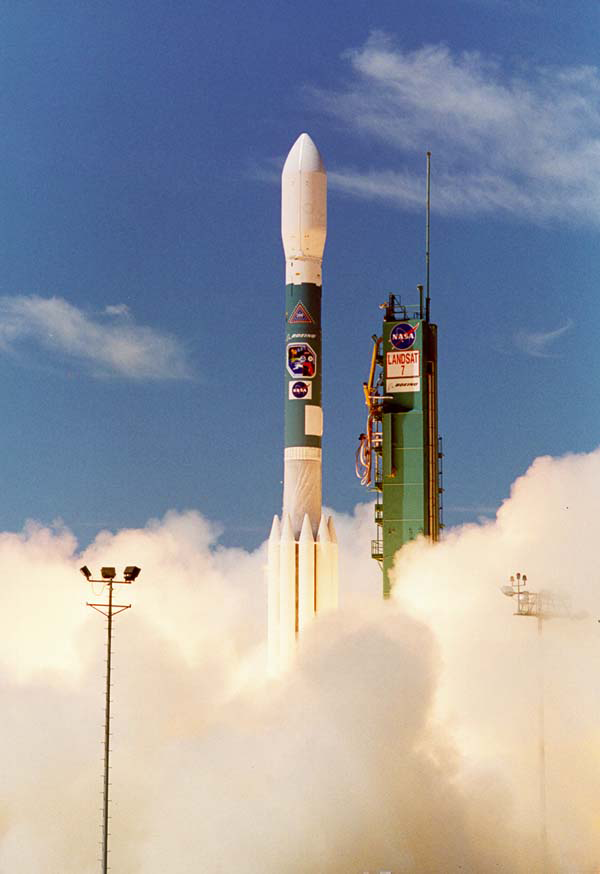
On April 15, 1999, Landsat 7 first made its way into space. 106,380 orbits later, the 2.6 million images acquired by Landsat 7 have given us a fuller and more nuanced understanding of Earth.
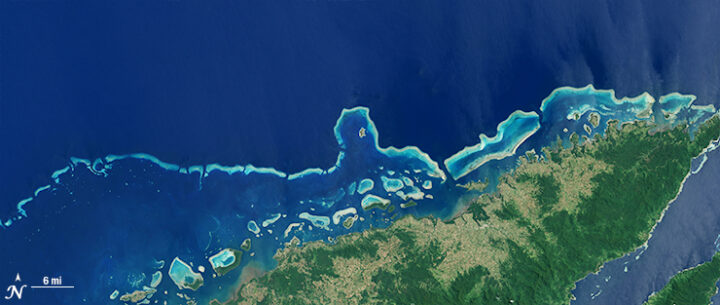
Take for example the Millennium Coral Reef Mapping Project. In 2006, Landsat 7 data were used to create a first-of-its kind global survey of coral reefs. The research lead on this project, Frank Muller-Karger, commented in 2015: “Until we made the map of coral reefs with Landsat 7, global maps of reefs had not improved a lot since the amazing maps that Darwin drafted.”
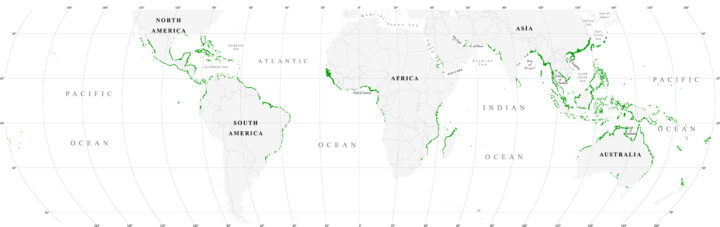
Landsat 7 data, together with data from its predecessor Landsat 5, provided the most comprehensive assessment ever of Earth’s mangroves in 2010.
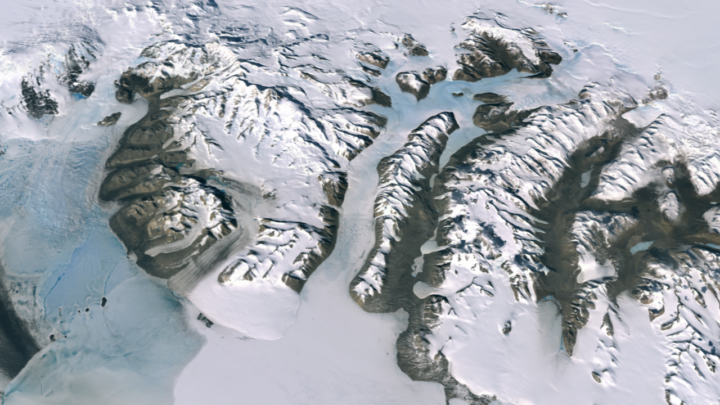
And for the International Polar Year (2007-2008), data from more than 1,000 Landsat 7 images were used to create the Landsat Image Mosaic of Antarctica (LIMA)—what was then the most detailed satellite mosaic of Antarctica.
If we travel two decades back in time and rewind the 4,733,375,587.686 kilometers that Landsat 7 has flown since April 1999, we arrive at a very different moment in spaced-based Earth observation.
The commercially-owned Landsat 6 satellite had failed to reach orbit six years earlier. Landsat 5 was 12 years past its design life and operated by a for-profit entity that charged upwards of $4000 per image and collected international data only when there was an immediate customer. Both situations curtailed the systematic global coverage of Earth that had been envisioned by the Landsat Program’s founders.
A building consensus about the critical role of Earth observation data for global change research had led the National Space Council to recommend that Landsat 7 be built. It should be operated by the U.S. government to ensure a continuous global archive of medium-resolution data for the long-term monitoring of Earth’s land surface. This was codified with the 1992 U.S. Land Remote Sensing Policy Act.
When Landsat 7 launched on April 15, 1999, the Enhanced Thematic Mapper Plus (ETM+) instrument onboard was the most sophisticated Landsat sensor yet. ETM+ carried a new 15-meter panchromatic band and had a thermal band with a spatial resolution refined to 60 meters (compared to 120 meters for Landsat 4 and 5). It also carried a new solid-state data recorder—one of the first to fly on a civilian mission. For the first time in Landsat program history, Landsat 7 was equipped with hardware that could reliably store large amounts of imaged data onboard for later download when a ground station was in range.
Landsat 7’s state-of-the-art recorder, together with a strategic global image acquisition plan, enabled the best global coverage the program had ever known. The LIMA project lead, Robert Bindschadler, penned in a 2001 journal article that “The revolutionary concept of systematic collection of Landsat 7 data timed to optimize anticipated scientific applications will make possible a global monitoring of the cryosphere with a data set heretofore only available in limited regions.”
During its ascent into orbit in 1999, Landsat 7 collected data as it flew under Landsat 5. This enabled the cross-calibration of Landsats 5 and 7. (In 2013, Landsat 8 underflew Landsat 7 for the same reason). Additionally, a team of calibration scientists oversaw in-the-field calibration efforts, making certain that satellite measurements agree with physical ground measurements. Such careful data calibration ensures that the Landsat data record can show meaningful trends of land use and land cover change—even when the changes are subtle.
In May 2003, an image scanning mechanism on Landsat 7 (the Scan Line Corrector) failed, leaving wedge-shaped gaps in the imagery—a net loss of 22 percent of each image. As devastating as this failure was, the remaining data are, as USGS describes, “some of the most geometrically and radiometrically accurate of all civilian satellite data in the world.”
The landmark 2008 USGS decision to make all Landsat data free and open, and the subsequent trend towards best-pixel composite-based data analysis, has made these data gaps even less problematic.
All in all, Landsat 7 has made remarkable contributions to global studies for two decades now, and according to fuel-based predictions, it should be able to continue doing so until the launch of Landsat 9.
In the second it took you to read this line, Landsat 7 traveled about 7.499 kilometers.
The launch of Landsat 7 was the second image ever posted on NASA Earth Observatory.
The Landsat 7 Mission Operations Control Center is staffed by 14 engineers, seven days a week, 8 hours a day. Someone is always on call and ready to respond if a ground or spacecraft anomaly occurs.
References:
Goward, S.N. et al. (2017) Landsat’s Enduring Legacy: Pioneering Global Land Observations from Space. Bethesda, MD: American Society for Photogrammetry and Remote Sensing.
Wulder, M.A. et al. (2019) “Current status of Landsat program, science, and applications.” Remote Sensing of Environment 225:127-147.
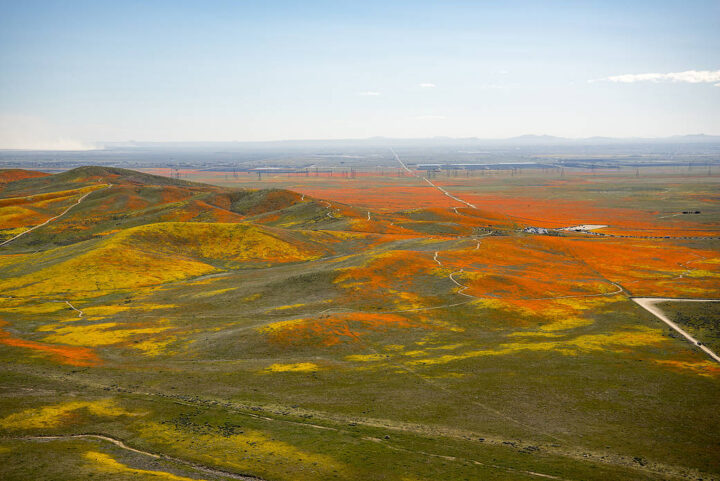
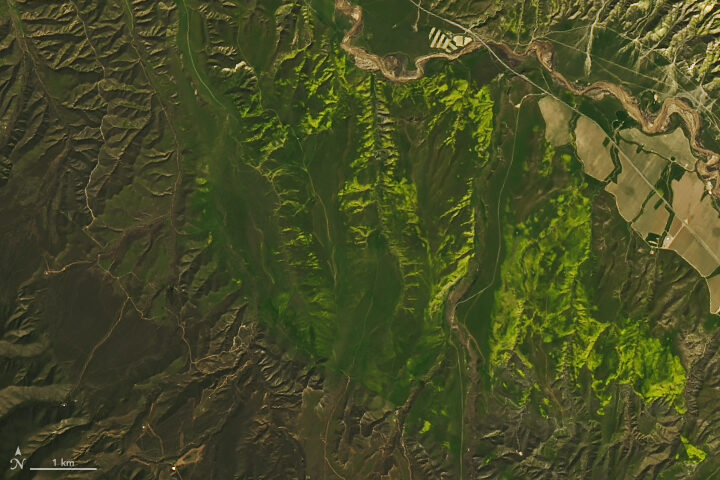
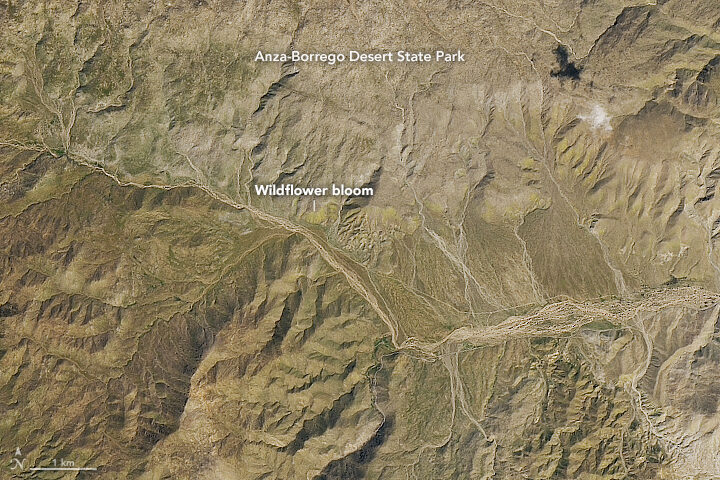
When we published a few Landsat images of wildflower super blooms in California in March 2019, you may have had to squint a little to find the flowers. From 705 kilometers (438 miles) above Earth’s surface, at the 15-meter-per-pixel resolution of the Operational Land Imager on Landsat 8, the flowers tend to blend with the hues of the desert.
Not so with this colorful photograph of poppies and other wildflowers in Antelope Valley that was taken from a T-34 airplane. The picture was shot by NASA Armstrong aerial photographer Jim Ross, who may have one of the coolest jobs at NASA. Watch the video below to find out how he got it.
Meanwhile, remote sensing scientist Iban Ameztoy was inspired enough by the aerial photos to pull Sentinel-2 satellite imagery of the same bloom and share them on Twitter.
Want more satellite imagery and aerial photography of the super bloom in California? NASA Earth Observatory and NASA Armstrong have you covered.
Join a mosquito mapping blitz for Citizen Science Day through GLOBE Observer.
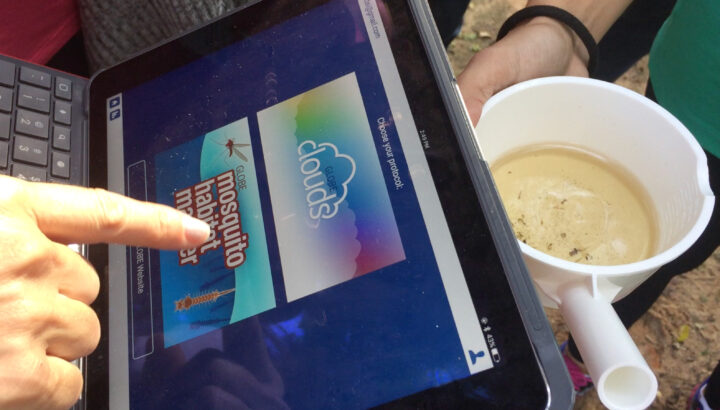
Earth observations take place on many spatial scales. Some observations originate from sensors in space; others can happen with a mobile phone in the palm of your hand. GLOBE Observer is a free mobile app that connects an international network of citizen scientists with the broader scientific community in an effort to document and analyze changes taking place in Earth’s air, land, water, and life. The app is the centerpiece of a citizen science blitz now underway.
Both globalization and a changing climate have caused countless living creatures to adjust their range and distribution. For human health, one of the most concerning impacts of a changing climate is the range expansion of mosquitoes. These flying vectors of disease are responsible for illness in millions of people; they also cause more than 700,000 deaths each year.
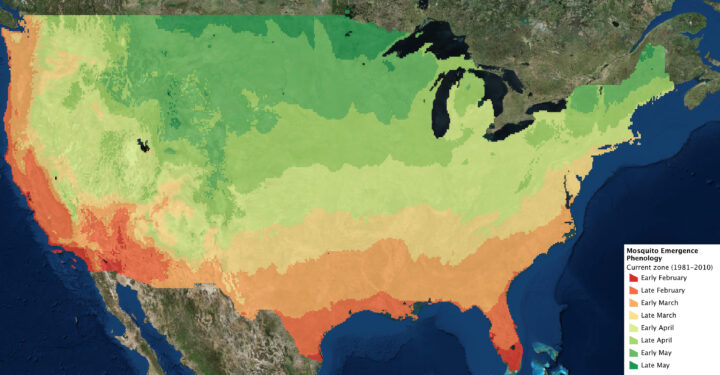
The northern hemisphere is now greening up in response to changes in sunlight and temperatures, and mosquito season is either just beginning or underway in much of the contiguous United States. The map above indicates when the first appearance of mosquitoes can be expected based on past weather data. The actual time of first appearance in a region can vary by several weeks, depending on the weather and other variables.
The GLOBE Observer app has a new tool known as the Mosquito Habitat Mapper, which makes it possible for citizen scientists to observe, record, and share data about mosquito breeding sites using a mobile phone. The data are important to scientists trying to predict disease outbreaks and epidemics. Observations provided by citizen scientists, combined with satellite observations and models, can make it possible to track the range and spread of invasive mosquitoes.
With the Mosquito Habitat Mapper, citizen scientists can report active and potential breeding sites in their communities. And using a built-in taxonomic key, GLOBE Observers can help determine whether the mosquito larvae have the potential to transmit disease pathogens to humans.
GLOBE Observers also can have an immediate impact on health in their community. In the last step of Mosquito Habitat Mapper, users report whether they were able to remove a breeding site. This can be accomplished in most cases by simply tipping and tossing standing water that is found in containers, or by covering stored water with a net or a lid. For larger water bodies such as ponds, irrigation ditches, or swamps, the reports about breeding sites can be used by mosquito surveillance agencies.
In this way, GLOBE Observers are not only engaged scientifically, they can become agents of change in their community. The World Health Organization (WHO) identifies source reduction–the elimination of mosquito breeding sites–as the most effective way to protect human populations and reduce the threat of mosquito vector-borne disease.
The GLOBE Observer Mosquito Blitz kicked off on April 7, 2019, and ends on Citizen Science Day (April 13). Join in this effort by downloading the app. Follow GLOBE Observer on social media during Mosquito Blitz week on Facebook or Twitter. Check out the Mosquito Blitz website and GLOBE Mission Mosquito for more mosquito resources.
