The retreat of Humboldt Glacier—Venezuela’s last patch of perennial ice—means that the country could soon be glacier-free. We featured the glacier in August 2018 as an Image of the Day showing how it changed between 1988 and 2015.
Satellite images can tell you a lot about a glacier, but direct measurements by people on the ground provide a unique, important perspective, especially for glaciers as small as Humboldt. Carsten Braun, a scientist at Westfield State University, last surveyed the glacier in 2015. He talked about what it was like to stand on Venezuela’s last glacier.
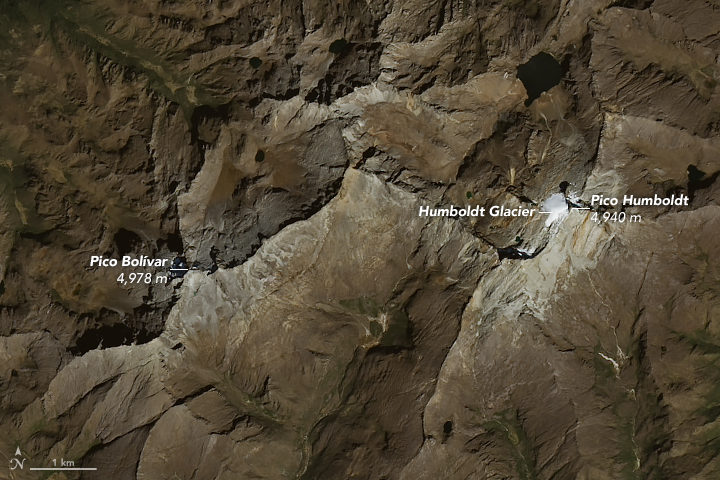
The Operational Land Imager (OLI) on Landsat 8 acquired this natural-color image of the glacier on January 6, 2015.
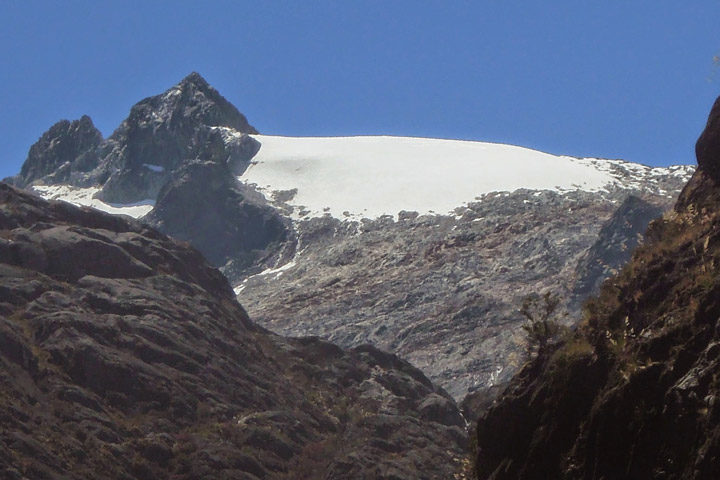
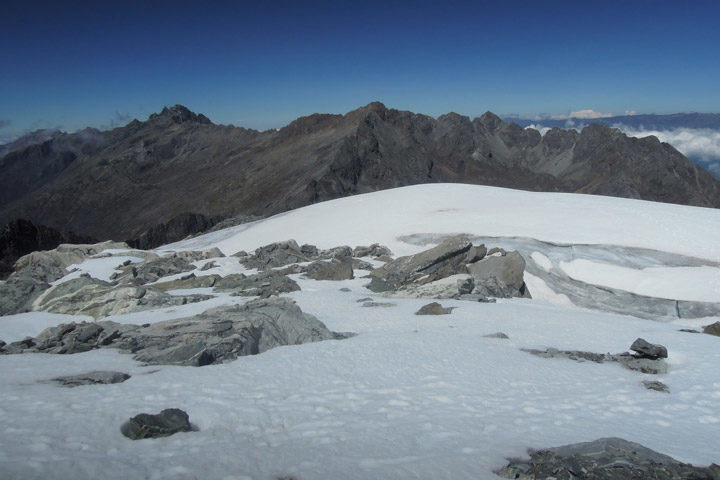
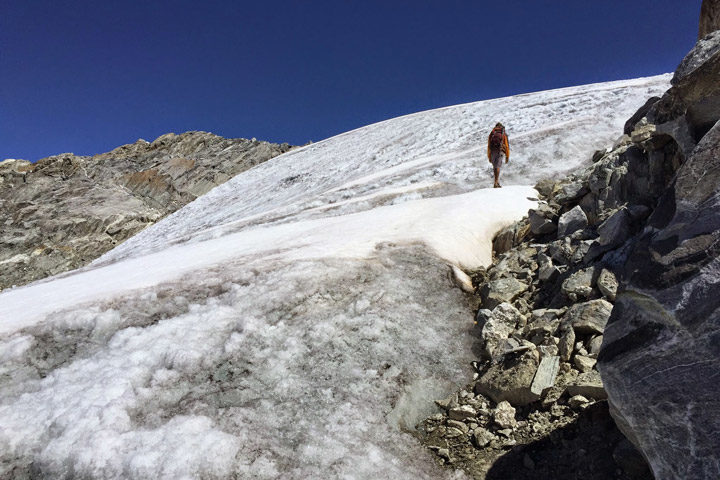
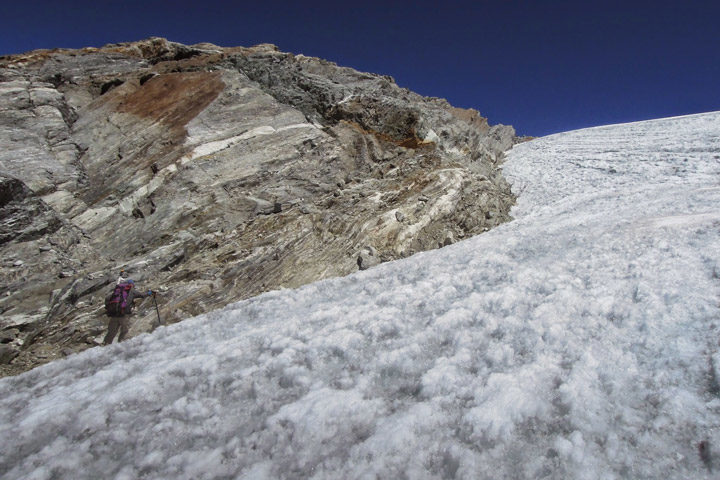
These photographs show the ground-based view of Humboldt Glacier in 2015. Photos by Carsten Braun.
What things were you measuring during the 2015 survey?
This was a very ‘low-tech’ trip: just me and a guide. The approach to the glacier takes two days of very rough hiking with big packs. That gets you to base camp at Laguna Verde below the glacier.
To get to the glacier takes another three hours on rough terrain. This is definitely popular with climbers. They cross the Humboldt Glacier and then summit Pico Humboldt.
I did the same thing in 2009 and 2011: I walked around the glacier right on the margin with a simple GPS receiver to make a map of it. That sounds a lot easier than it is. Walking right on the edge of a glacier can be difficult and dangerous. This was definitely both!
What was the ice like? Parts of it look like snow or slush.
This glacier is little different than what you may have experienced. It is tiny and does not have an accumulation area. The surface is 100 percent ice everywhere, just covered in some parts in wet seasonal snow that will melt away. Basically that means that the Humboldt Glacier has no means to ‘add’ mass (‘eat’) and continuously loses mass everywhere (‘fasting’). Obviously, that’s not sustainable.
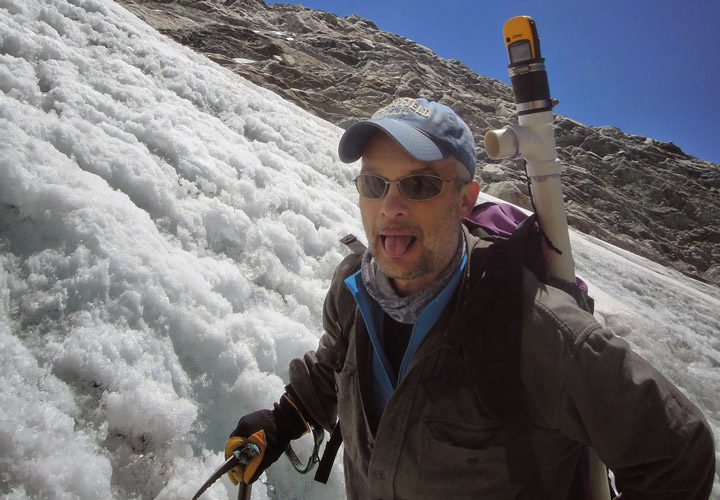
Photos by Carsten Braun.
Do you remember what you were thinking while hiking on the country’s last glacier?
I was definitely considering the impacts of losing this glacier. It has little ‘practical use’ today, as it is so small and pretty much irrelevant for water supply. Its disappearance would not impact water resources much, if at all. That’s much in contrast with countries like Peru and Bolivia, where glacier recession already creates huge problems for water resources, hydro-power, etc.
The impact in Venezuela is more at a spiritual level. The mountain chain is was named Sierra Nevada de Mérida (snowy mountain range of Mérida) because of its glacier cover. Now it will be gone soon and may never come back again. (Well, that’s up to us humans to decide.) And with that, the reality of these mountains will change. The lack of glaciers will be the ‘new normal.’ It’s a little bit like losing a species: once it’s gone, you never realize that it is missing.

Every month on Earth Matters, we offer a puzzling satellite image. The September 2018 puzzler is above. Your challenge is to use the comments section to tell us what we are looking at and why this place is interesting.
How to answer. You can use a few words or several paragraphs. You might simply tell us the location. Or you can dig deeper and explain what satellite and instrument produced the image, what spectral bands were used to create it, or what is compelling about some obscure feature in the image. If you think something is interesting or noteworthy, tell us about it.
The prize. We can’t offer prize money or a trip to Mars, but we can promise you credit and glory. Well, maybe just credit. Roughly one week after a puzzler image appears on this blog, we will post an annotated and captioned version as our Image of the Day. After we post the answer, we will acknowledge the first person to correctly identify the image at the bottom of this blog post. We also may recognize readers who offer the most interesting tidbits of information about the geological, meteorological, or human processes that have shaped the landscape. Please include your preferred name or alias with your comment. If you work for or attend an institution that you would like to recognize, please mention that as well.
Recent winners. If you’ve won the puzzler in the past few months or if you work in geospatial imaging, please hold your answer for at least a day to give less experienced readers a chance to play.
Releasing Comments. Savvy readers have solved some puzzlers after a few minutes. To give more people a chance to play, we may wait between 24 to 48 hours before posting comments.
Good luck!
Answer: The image shows a detailed view of the Albanov Ice Cap on October Revolution Island. The island is part of the Severnaya Zemlya archipelago in the Russian high Arctic. Many of the area’s ice caps, including Albanov, contain snow and ice that has melted and refroze, visible as the blue areas ringing the ice caps. Congratulations to Bananaft for correctly identifying the location, and to Maria Bolton and Aureliano for mentioning ice melt. Read more about the image in our October 1, 2018, Image of the Day.
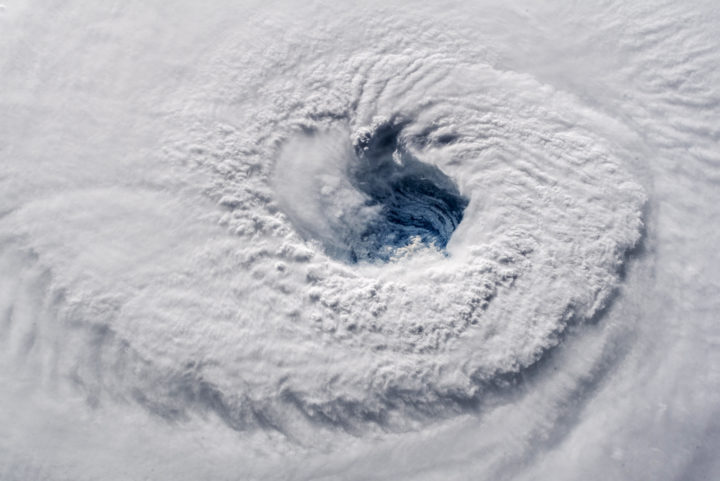
Early on September 12, 2018, astronaut Alex Gerst shot this photograph of Florence’s eye as viewed from the International Space Station. He tweeted: “Ever stared down the gaping eye of a category 4 hurricane? It’s chilling, even from space.” Credit: ISS Photograph by Alex Gerst, European Space Agency/NASA
When Hurricane Florence approached the Carolinas, the NASA Disasters Program began providing a suite of satellite data products to disaster responders, such as the Federal Emergency Management Agency (FEMA) and the National Guard. The goal was to provide the latest information for decision-making on everything from evacuations to supply routes to recovery estimates.
Andrew Molthan is a research meteorologist at NASA’s Marshall Space Flight Center who serves as a “disaster coordinator” for the disasters program. This week, he has been sitting at the FEMA National Response Coordination Center in Washington, D.C., to facilitate coordination of NASA data. We asked him a few questions to better understand the NASA Disaster Program’s role during Hurricane Florence.
What is your role at FEMA this week?
I am here at FEMA to better understand the agency’s geospatial needs during a major disaster, to help improve coordination, and to lend additional remote sensing and/or meteorological expertise where I can.
I am also helping with coordination and data exploitation for the Uninhabited Aerial Vehicle Synthetic Aperture Radar (UAVSAR) instrument aboard NASA’s C-20A aircraft, operated by a pilot. As a team, colleagues from NASA centers all over the country—Marshall, Headquarters, Jet Propulsion Laboratory, Armstrong Flight Research Center, Goddard Space Flight Center, and Langley Research Center—are working collaboratively to help target the UAVSAR instrument for daily radar imaging over the most critical rivers of interest to FEMA, the National Guard, and other partners. Scientists are assisting agencies in the interpretation of the UAVSAR imagery to inform immediate response efforts. They will also further process the data and use it as part of longer-term efforts to improve flood remote sensing and improve streamflow and inundation models.
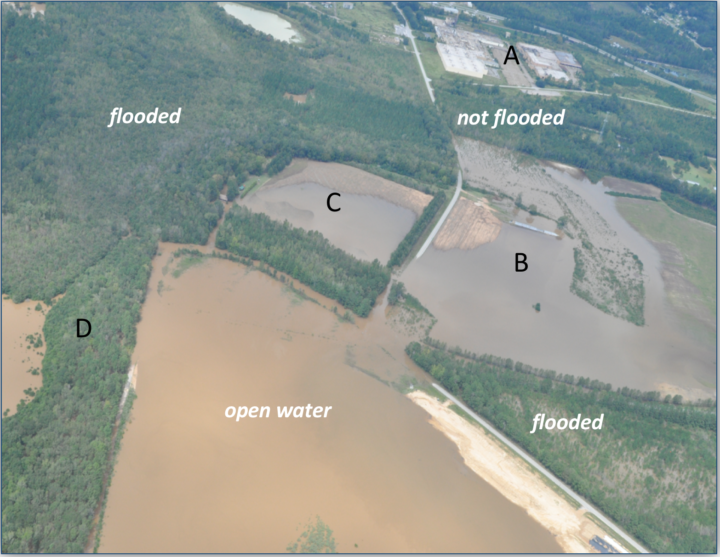
Above: Civil Air Patrol photo taken on September 18, 2018 near Cheraw, SC. Credit: Civil Air Patrol
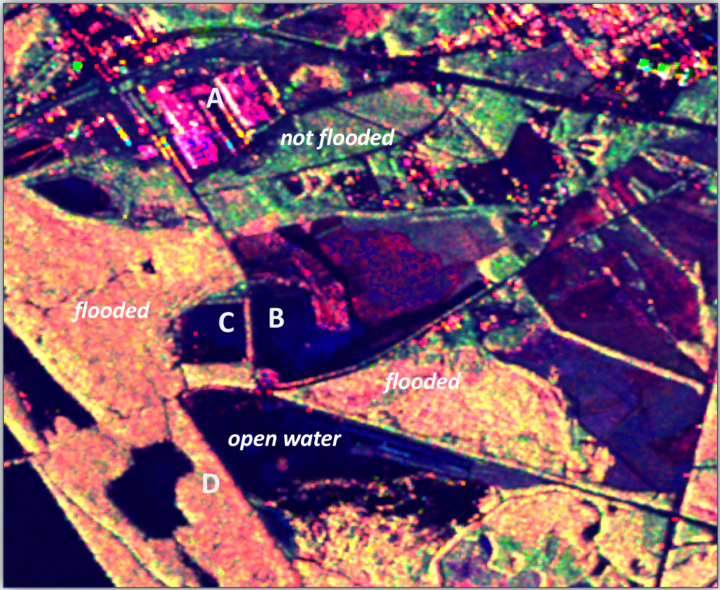
Above: UAVSAR polarimetric decomposition image taken on September 17, 2018 near Cheraw, SC (same area as Civil Air Patrol photo above). Pink denotes urban areas whereas red/orange denotes inundated forests. Dark blue or black are flooded open water; roads can be black even if not flooded. Green, yellow, and light blue color denote areas that are not flooded. Note: Red — Double bounce scattering (flooded forests and urban); Green – Volume scattering (unflooded forests); Blue – specular scatters (dry bare ground, open water). Credit: Yunling Lou/JPL, Bruce Chapman/JPL and Gerald Bawden/HQ
What NASA products are being shared with the National Guard and FEMA?
Most of our activities have focused on helping with the remote sensing of flooded areas following the heavy rains associated with Hurricane Florence. Many river basins in southern Virginia, central and eastern North Carolina, and northeastern South Carolina have experienced widespread river flooding and flash flooding that has affected citizens and need to be monitored for response efforts.
Above: This GPM IMERG visualization shows storm-total accumulated rainfall on the left for 9/12/18 – 9/17/18 vs. a sequence of 3-hour accumulations on the right. Credit: NASA
NASA Marshall team members are producing products and assisting with event coordination including my spot here at FEMA supporting their geospatial team. Scientists with the Jet Propulsion Laboratory (the ARIA team) are routinely generating flood- and damage proxy maps. Goddard researchers are assisting with optical and radar flood detections. The Langley Research Center is assisting with data access and sharing via GIS platforms. NASA Headquarters is supporting overall agency coordination. Johnson Space Center is helping to acquire dramatic footage of the storm and aftermath from astronaut photography.
What instruments are being used?
The extensive cloud cover from the storm has blocked surface views from instruments operating in the visible, near infrared, and thermal wavelengths, so synthetic aperture radar (SAR) information has been critical. SAR has the ability to “see” through clouds, making it an all-weather instrument. These include images from the European Space Agency’s Sentinel-1A/1B platforms, international and commercial partner assets, such as those from the Japan Aerospace Exploration Agency’s ALOS-2, Canadian Space Agency’s Radarsat-2, and the German TerraSARx, which are made available through government partnerships and the International Charter on Space and Major Disasters.
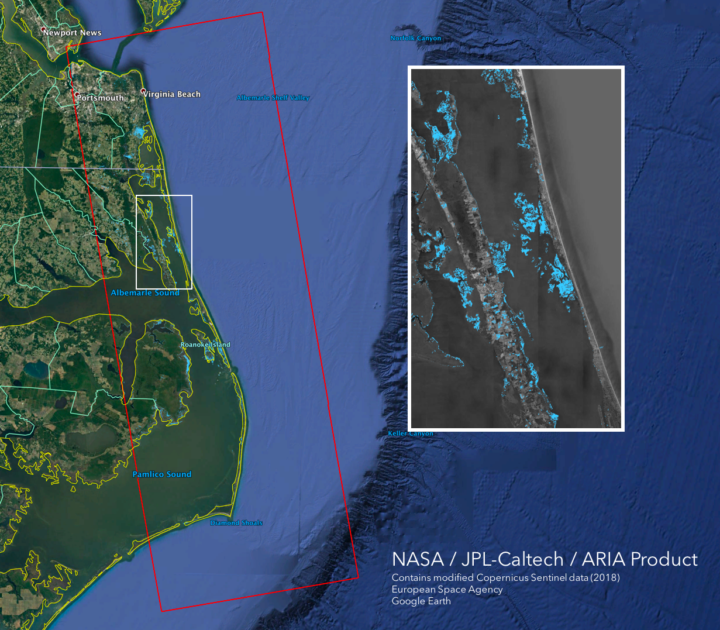
This flood proxy map shows the extent of flooding 36 hours after the hurricane’s landfall (September 15, 2018 18:57 PM local time). The map is derived from Synthetic Aperture Radar (SAR) data from the Copernicus Sentinel-1 satellites, operated by the European Space Agency (ESA).
As skies are now beginning to clear, we’ll also look for opportunities to use other NASA satellite remote sensing assets — including Terra/Aqua MODIS, Suomi-NPP VIIRS, Landsat 8 — and applications to identify water on the surface. We’ll also take a look at nighttime light imaging from Suomi-NPP VIIRS and the day-night band, using the NASA Black Marble and Black Marble HD products generated at Goddard.
Above: The VIIRS instrument on the joint NASA/NOAA Suomi NPP satellite observed Hurricane Florence as it developed in the Atlantic Ocean and made landfall in North Carolina on Sept. 14, 2018. Credits: NASA Worldview
Starting this month, you can be part of a project to create more detailed satellite-based global maps of land cover by sharing photos of the world around you in a new NASA citizen science project.
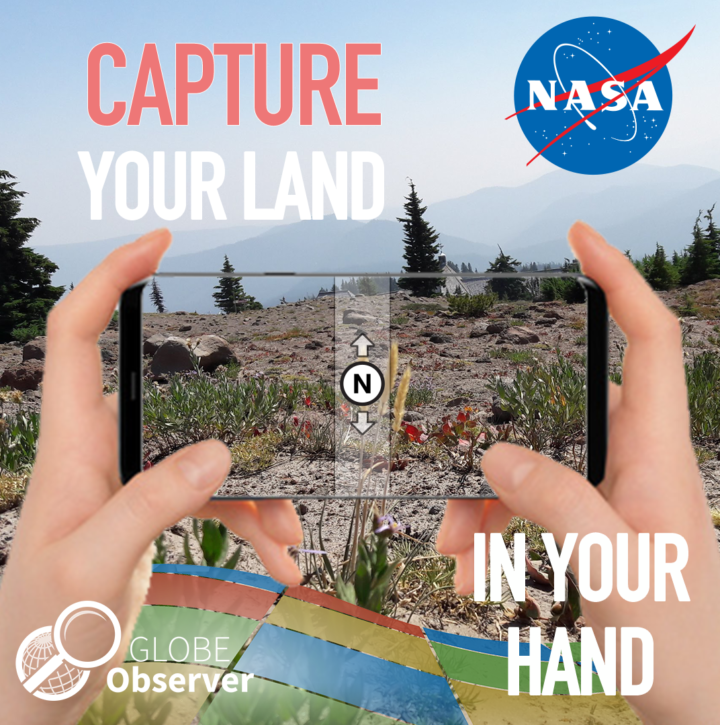
The project is a part of GLOBE Observer, a citizen science program that lets you contribute meaningful data to NASA and the science community. The GLOBE Observer app, introduced in 2016, includes a new “Land Cover: Adopt a Pixel” module that enables citizen scientists to photograph with their smartphones the landscape, identify the kinds of land cover they see (trees, grass, etc.), and then match their observations to satellite data. Users can also share their knowledge of the land and how it has changed.
“Adopt a Pixel” is designed to fill in details of the landscape that are too small for global land-mapping satellites to see.
“Even though land cover is familiar to everyone on the planet, the most detailed satellite-based maps of global land cover are still on the order of hundreds of meters per pixel. That means that a park in a city may be too small to show up on the global map,” says Peder Nelson, a land cover scientist at Oregon State University.
Holli Kohl, coordinator for the project says: “Citizen scientists will be contributing photographs focused on a 50-meter area in each direction, adding observations of an area up to about the size of a soccer field. This information is important because land cover is critical to many different processes on Earth and contributes to a community’s vulnerability to disasters like fire, floods or landslides.”
To kickstart the data collection, GLOBE Observer is challenging citizen scientists to map as much land as possible between Sept. 22, Public Lands Day, and Oct. 1, NASA’s 60th anniversary. The 10 citizen scientists who map the most land in this period will be recognized on social media and will receive a certificate of appreciation from GLOBE Observer.
The free GLOBE Observer app is available from Google Play or the App Store. Once you download the app, register, and open the Land Cover module, an interactive tutorial will teach you how to make land cover observations.
“We created GLOBE Observer Land Cover to be easy to use,” says Kohl. “You can simply take photos with your smartphone, submit them, and be done, if you like. But if you want to take it a step further, you can also classify the landscape in your photo and match it to satellite data.”
Scientists like Nelson anticipate using the photographs and associated information to contribute to more detailed land cover maps of Earth.
“Some parts of the world do have high spatial resolution maps of land cover, but these maps do not exist for every place, and the maps are not always comparable. Efforts like GLOBE Observer Land Cover can fill in local gaps, and contribute to consistent global maps,” says Allison Leidner, GLOBE program manager at NASA Headquarters in Washington.
Changes in land cover matter because land cover can alter temperatures and rainfall patterns. Land cover influences the way water flows or is absorbed, potentially leading to floods or landslides. Some types of land cover absorb carbon from the atmosphere, and when subject to changes, such as a forest burned in a wildfire, result in more carbon entering the atmosphere. Improved land cover maps will provide a better baseline to study all of these factors at both global and local scales, particularly as scientists integrate improved land cover maps into global models.
The data aren’t just for scientists. “Everyone will have access to this data to understand local change,” says Nelson. Citizen scientists who participate will be creating their own local land cover map. The data will be available to anyone through the GLOBE web site.
To learn more, follow GLOBE Observer on Facebook @nasa.globeobserver or Twitter @NASAGO or visit the GLOBE Observer web site. Read the full story here.
