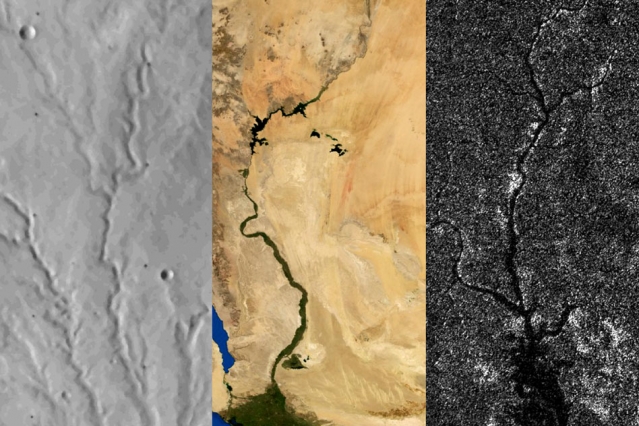
Rivers on three planetary bodies: the dry Parana Valles on Mars (left), the Nile River on Earth (middle), and Vid Flumina on Titan (right). Image by Benjamin Black using NASA data.
One of the more distinctive things about Earth among the planets is that we have plate tectonics. In other words, the hard, outer shell of the planet (called the lithosphere) is divided into several cool, rigid plates that float atop a hotter, more fluid layer of rock (the asthenosphere). These rigid surface plates do not float placidly: their grinding, colliding, shifting, and diving causes earthquakes, fuels volcanoes, builds mountains, tears open oceans, and constantly remodels and resurfaces the planet.
That is a far cry from what is happening on Mars and Titan, according to a recent study published in Science. Researchers came to that conclusion by carefully analyzing the way rivers cut through each of these planetary bodies. On Earth, countless rivers and streams snake their way across the surface. On Mars, rivers dried up long ago, but evidence of their presence remains etched into the arid surface. On Titan, Saturn’s largest moon, rivers of liquid ethane and methane still flow into lakes.
Artist’s cross section illustrating the main types of plate boundaries on Earth. (Cross section by José F. Vigil from This Dynamic Planet—a wall map produced jointly by the U.S. Geological Survey, the Smithsonian Institution, and the U.S. Naval Research Laboratory.)
By comparing imagery and data from all three planetary bodies, researchers noticed distinctive bends in the courses of rivers on Earth; these were formed as rivers were forced to wind around mountain ranges. These bends were absent in river networks on Mars and Titan. In an MIT press release, Benjamin Black, a geologist at the City College of New York, explained:
“Titan might have broad-scale highs and lows, which might have formed some time ago, and the rivers have been eroding into that topography ever since, as opposed to having new mountain ranges popping up all the time, with rivers constantly fighting against them.”
Read more about the study from New Scientist, Space.com, and the American Association for the Advancement of Science. Read the full study in Science. Read this NASA Earth Observatory story to learn more about how scientists are using satellites to study river width on Earth.
In the triptych at the top of the page, the image of Parana Valles on Mars was acquired by the Viking 1 orbiter on September 13, 1976. The image of the Nile was captured by NASA’s Terra satellite on August 10, 2000. NASA’s Cassini spacecraft captured the image of Vid Flumina on Titan on September 26, 2012.

While water does not flow on Titan, rivers of methane and ethane flow into lakes near the moon’s northern pole. Learn more about this image from the NASA Jet Propulsion Laboratory Photojournal.
In May 2017, NASA’s Operation IceBridge concluded its annual survey of Arctic ice. After 10 weeks, 39 research flights, and hundreds of terabytes of data collected, scientists have more information than ever to help them understand changes to the region’s sea- and land ice.
Notable this year were measurements of a crack growing across the ice shelf of Petermann Glacier. Also, the mission flew for the first time over the Eurasian half of the Arctic Basin.
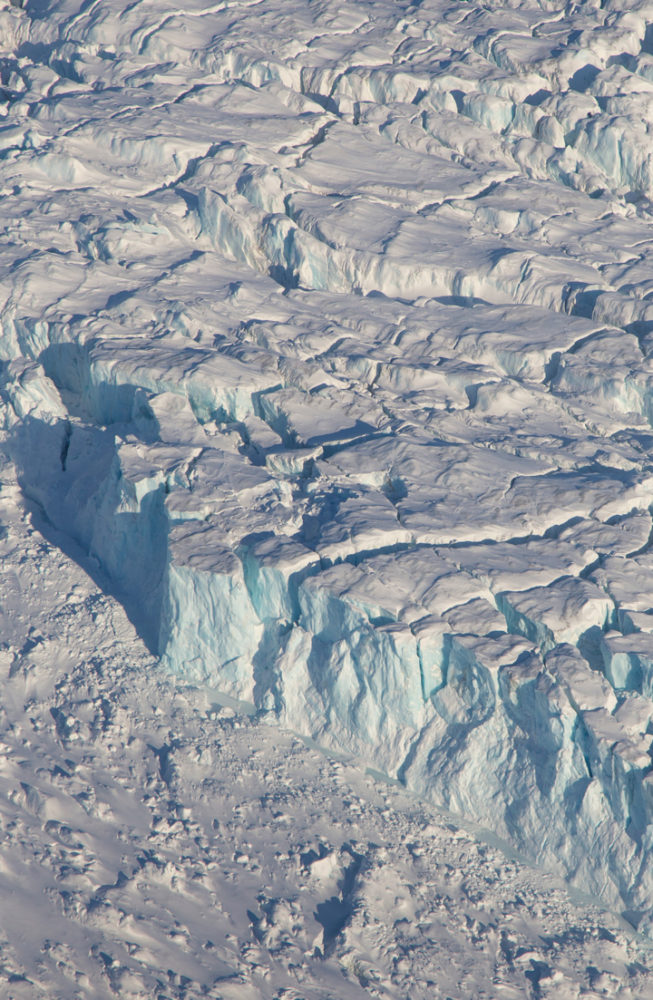
The research flight on April 3 explored glaciers in Greenland, before transiting to Longyearbyen, Norway, which would become the base of operations for the week. These images, snapped by NASA’s Jeremy Harbeck, show some of the highlights from that flight, featuring plenty of interesting glaciers, landforms, and even some wildlife.
An iceberg near the calving front of Zachariah Glacier. Photo by Jeremy Harbeck.
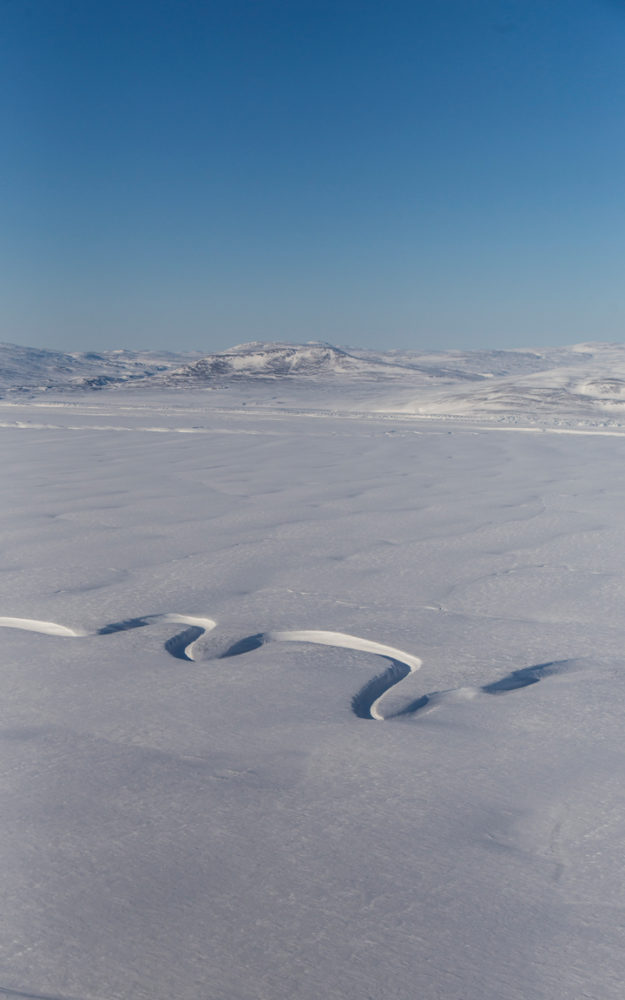
A sinuous meltwater channel on 79 North Glacier. Photo by Jeremy Harbeck.

A snowy, frozen landscape just north of 79 N Glacier. Photo by Jeremy Harbeck.
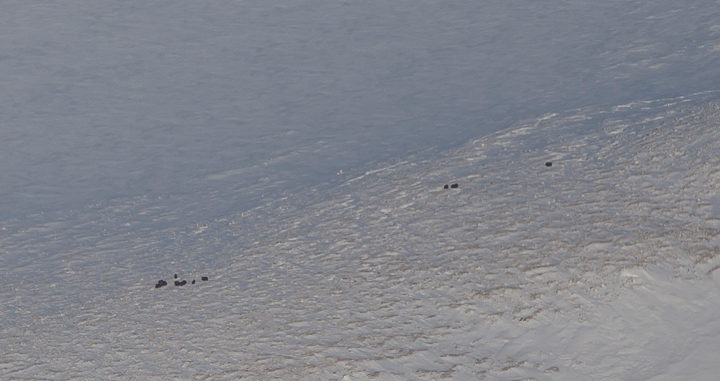
Musk ox from the P-3, between Zachariae and 79 N glaciers. Photo by Jeremy Harbeck.
On April 6, researchers flew from Svalbard and surveyed sea ice atop the eastern Arctic Ocean. Below are a few of Harbeck’s favorite photographs from that flight, highlighting the variability of sea ice.
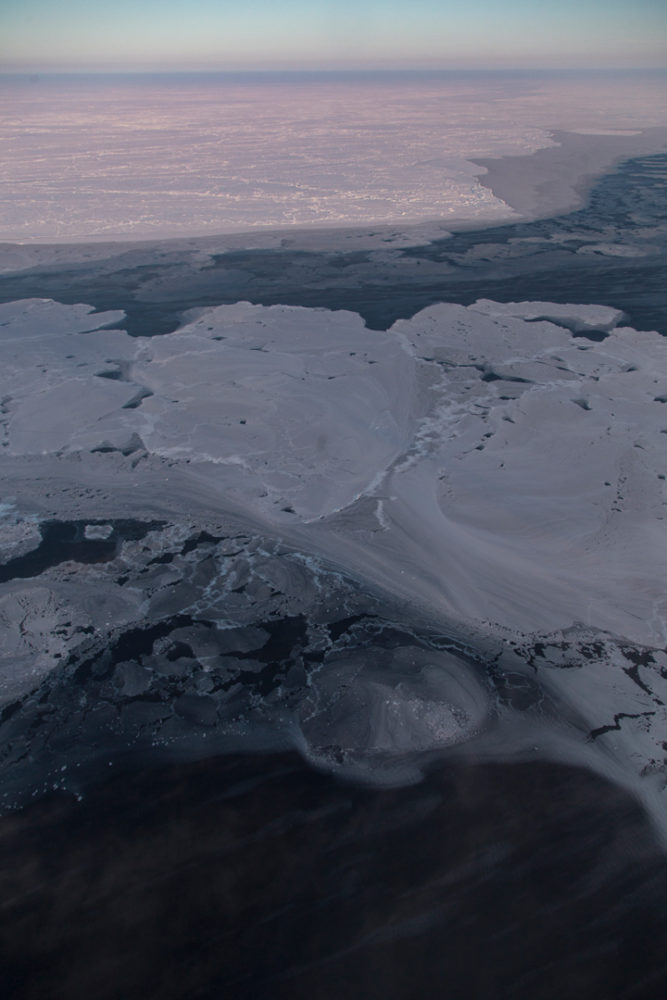
Some very interesting nilas and grease ice patterns. Photo by Jeremy Harbeck.
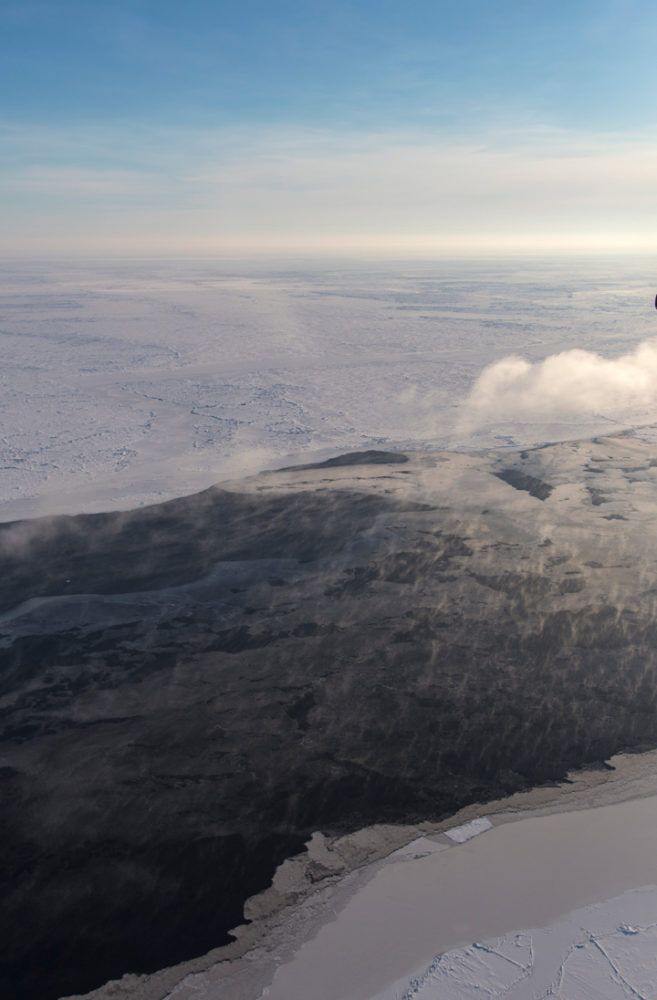
The low sun angle highlights the moisture going into the atmosphere from this lead. Photo by Jeremy Harbeck.
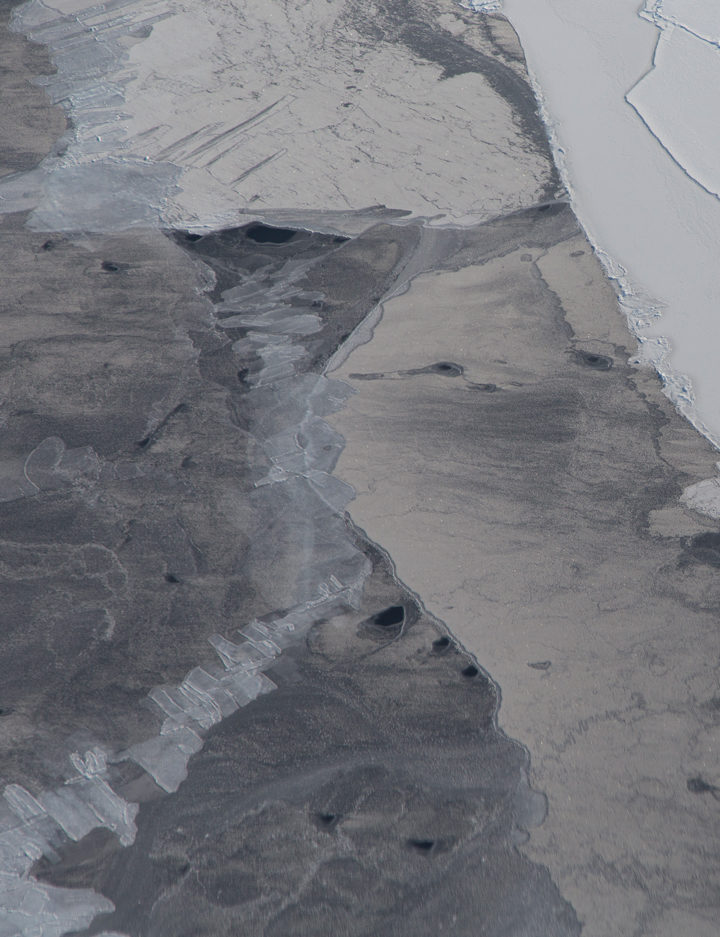
Some finger-rafted nilas along with some thicker snow-covered ice. Photo by Jeremy Harbeck.
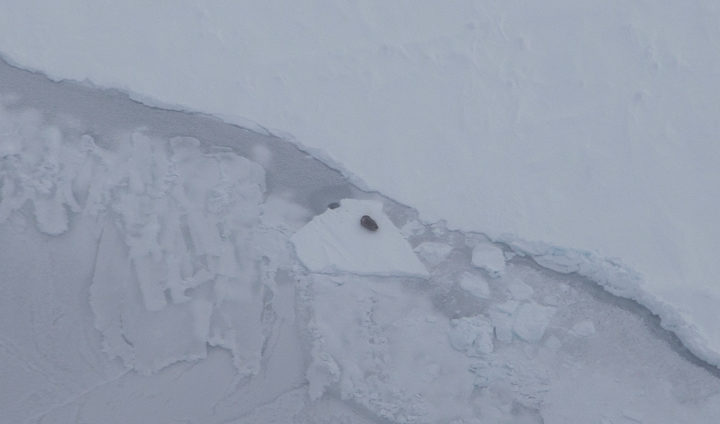
A seal on the sea ice, just northeast of Svalbard. Photo by Jeremy Harbeck.
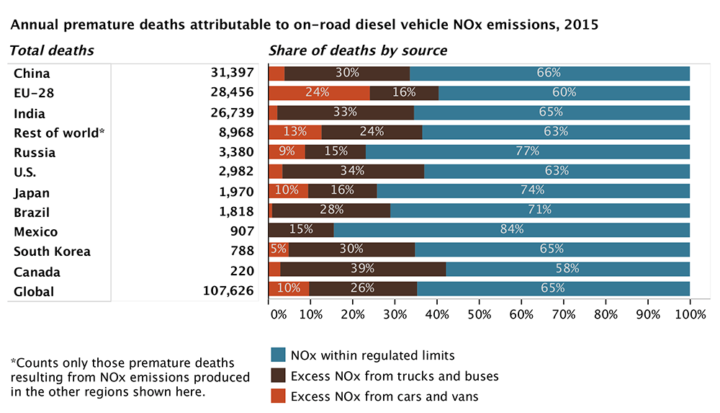
Figure by the ICCT based on data from Anenberg et al. 2017.
It is no secret that many diesel cars and trucks emit more pollution under real-world driving conditions than during laboratory certification testing. Many lab tests, for instance, are run with perfectly maintained vehicles on flat surfaces in ideal conditions. In the real world, drivers chug up hills or sit in traffic in bad weather in vehicles well past their prime.
Until this month, nobody had tallied the health effects of all the excess diesel air pollution entering the atmosphere through real-world driving conditions. According to a new study published in Nature, vehicles in eleven major markets (Australia, Brazil, Canada, China, Europe, India, Japan, Mexico, Russia, South Korea, and the United States) emitted about 4.6 million more tons of nitrogen oxides (NOx) in 2015 than official laboratory tests suggested they would. NOx contributes to the accumulation of both ground-level ozone (O3) and fine particulate matter (PM2.5) in the atmosphere.
According to the research team, nearly one-third of heavy-duty diesel vehicle emissions and over half of light-duty diesel vehicle emissions are above the certification limits. On average, light-duty diesel vehicles produce 2.3 times more NOx than the limit; heavy-duty diesel vehicles emit more than 1.45 times the limit.
The authors of the study calculated the health effects for current and future levels of this excess diesel NOx by running a global atmospheric chemistry model that simulates the distribution of PM2.5 and O3. The bottom line: excess NOx caused 38,000 premature deaths in 2015. It could cause as many as 183,600 premature deaths by 2040 as the use of diesel increases.
“We estimate that excess diesel NOx emissions from on-road trucks, buses, and cars leads to upwards of 1,100 premature deaths per year in the U.S.,” said Daven Henze, a professor of mechanical engineering at the University of Colorado and member of NASA’s Health and Air Quality Applied Sciences Team.
Other key findings from the study:
For more information, read a press release and fact sheet from the International Council on Clean Transportation, a press release from the University of Colorado, and a press release from the University of York. To find out more about global air pollution trends, read A Clearer View of Hazy Skies from NASA Earth Observatory.
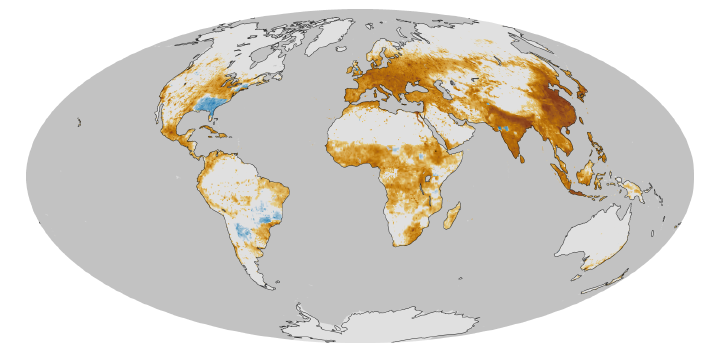

This map, based on previous research, shows a model estimate of the average number of deaths per 1,000 square kilometers (386 square miles) per year due to fine particulate matter (PM2.5), a type of outdoor air pollution. Pollution from diesel exhaust is one contributer to PM2.5. Earth Observatory image by Robert Simmon based on data provided by Jason West. Learn more about this map here.
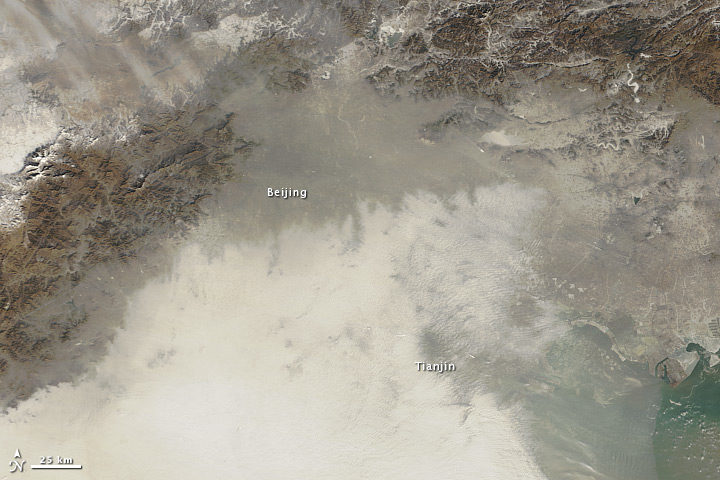
Haze over northeastern China on January 14, 2013. Image by NASA Earth Observatory, using data Terra MODIS data from LANCE MODIS Rapid Response.
In the winter of 2013, thick haze enveloped northern China for several weeks. On January 12, 2013, the peak of that bad-air episode, the air quality index (AQI) rose to a staggering 775—off the U.S. Environmental Protection Agency scale—according to a U.S. air quality sensor in Beijing.
Extra pollution from cars, homes, and factories in the winter often sets the stage for outbreaks of air pollution in China. But a March 2017 study in Science Advances suggests that a loss of Arctic sea ice in 2012 and increased Eurasian snowfall the winter before may have helped fuel the extreme event.
Snow and ice cover can affect weather patterns because both affect albedo, a measure of how much solar radiation the surface reflects in comparison to how much incoming solar radiation it receives. In September 2012, sea ice covered less area than at any other time since 1979. Meanwhile, Eurasia had unusually high snow cover in December 2012, the second most on a record that dates back to 1967.
Normally, winds blow air pollution away from eastern China, which is home to Beijing and several other large cities. But in January 2013, winds died down to a whisper and air pollution piled up. By analyzing decades of data collected by ground-based weather stations, 15 years of satellite data on aerosols, and computer simulations of the atmosphere, the researchers concluded that unusual sea ice and snow conditions triggered a shift in China’s winter monsoon, stilling the winds that normally ventilate Beijing.
A press release from Georgia Tech explained the connection in more detail:
“The reductions in sea ice and increases in snowfall have the effect of damping the climatological pressure ridge structure over China,” explained Yuhang Wang. “That flattens the temperature and pressure gradients and moves the East Asian Winter Monsoon to the east, decreasing wind speeds and creating an atmospheric circulation that makes the air in China more stagnant.”
If correct, this might explain why efforts to reduce air pollution in recent years have not stopped extreme haze events from happening. “Emissions in China have been decreasing over the last four years, but the severe winter haze is not getting better,” said Wang. “Mostly, that’s because of a very rapid change in the high polar regions.”
This is not the first study that connects changes in the Arctic to severe haze in China. Research published in August 2015 in Atmospheric Oceanic Science Letters argued that a decline in Arctic sea ice intensifies haze in eastern China. And a study published in Nature Climate Change in April 2017 came to a similar conclusion. The latter study projected a 50 percent increase in the frequency of extreme haze events and an 80 percent increase in their persistence in the near future.
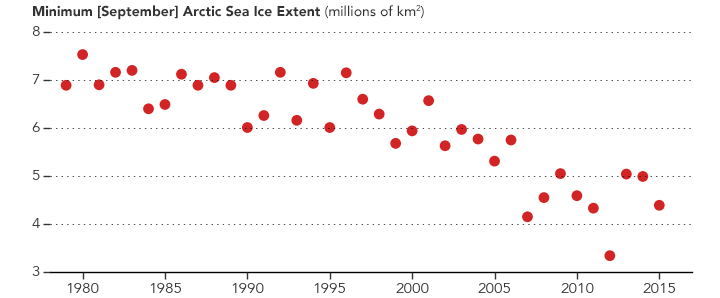
In 2012, Arctic sea ice extent was unusually low in September. New research suggests that may have contributed to a bad haze outbreak in eastern China the next winter. (NASA Earth Observatory graph by Joshua Stevens, based on data from the National Snow and Ice Data Center.)
Watch out, master gardeners: There’s competition up above.
Scientists have made marked developments in growing vegetables in space this spring. Researchers based at Kennedy Space Center have been working with a team from the University of Arizona to create a prototype lunar/Mars greenhouse. The cylindrical, inflatable chamber measures 18 feet long and 8 feet in diameter. It recycles waste and water from astronauts, and uses carbon dioxide they exhale.
Growing edible plants in space will allow humans to venture farther beyond our home planet, said Ray Wheeler, lead scientist for Kennedy Advanced Life Support Research. “The greenhouses provide a more autonomous approach to long-term exploration on the Moon, Mars and beyond,” he said.

Image by University of Arizona.
In other space veggie tales…
Last month, perhaps the most-watched cabbage in the world—technically speaking, in Earth orbit—sprouted. Two tiny shoots of the Tokyo Bekana Chinese cabbage poked out of their specially-designed plant pillow. The pillow acts like a miniature plant bed, providing nutrients without the mess of dirt careening through space.
The cabbage is but the most recent crop on the ISS. The crew’s first harvest of space veggies from the Veg-01 experiment took place in 2015. However, flower-raising efforts have encountered a few more obstacles, including the formation of mold.

Scott Kelly with romaine lettuce. Image by NASA.
To learn more, check out this video, aptly titled “Lettuce Look at Veggie”:
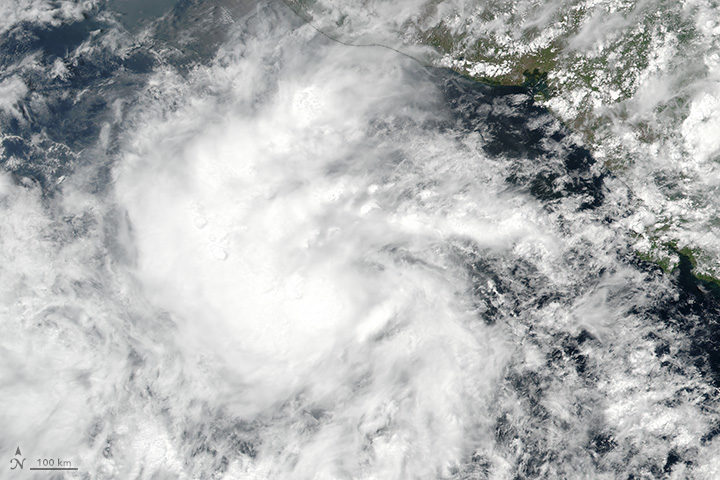
On May 9, 2017, the Visible Infrared Imaging Radiometer Suite (VIIRS) on the Suomi NPP satellite captured this image of a tropical depression off Central America. Later that day, the storm became Tropical Storm Adrian. The storm was not very well organized, as evidenced by its amorphous appearance. Despite warmer-than-average ocean surface temperatures, wind shear would keep the storm from strengthening into a hurricane.
But it wasn’t the storm’s strength that was worth noting; it was its timing. Adrian earned the title of “earliest tropical storm to form in the East Pacific” since reliable records began in 1970. It takes the top spot from Tropical Storm Alma, which formed on May 12, 1990. Read more about Adrian on the Weather Underground Category 6 blog here and here.
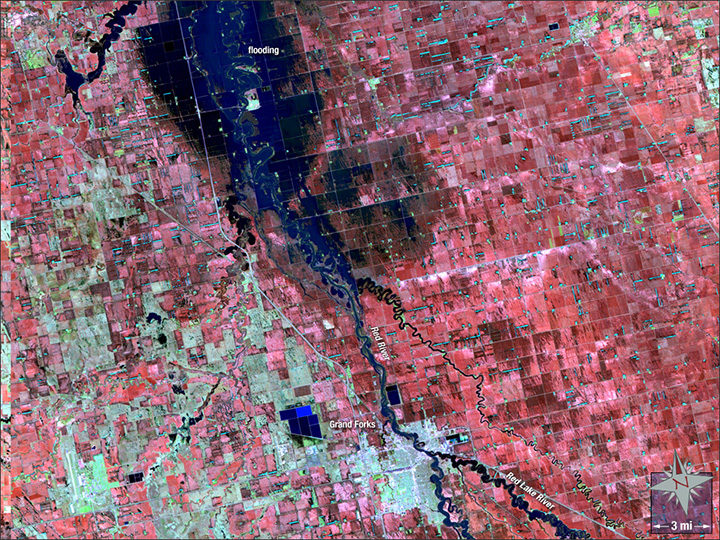
Image by the NASA GSFC Landsat/LDCM EPO Team using Landsat 5 data from the U.S. Geological Survey.
Twenty years ago this month, a hundred-year flood inundated cities along the Red River. The waters rose through April and May 1997, inundating 2,200 square miles (5,700 square kilometers) of North Dakota and Minnesota—a footprint twice as big as Rhode Island. The river spilled over its banks in Winnipeg, Canada, as well.
The false-color Landsat 5 image above shows Grand Forks, North Dakota, as it appeared on May 4, 1997. At that point, flood waters had mostly retreated, but the river still appeared swollen, with water lingering in floodplains just north of the city. Water appears dark blue, while structures are off-white.
There have been a several other notable floods since 1997. The river also overflowed its banks in 2006, 2009, and 2011.
In early May 2017, the river’s levels are average, and its water output holds steady, according to ground-based measurements taken at Grand Forks. Yet, the country as a whole just experienced its second-wettest April on record, with severe floods along the Mississippi River.
The U.S. Geological Survey has additional satellite imagery and a gallery of ground photographs of the flood. The Star Tribune has a good story that looks at how Grand Forks has fared since 1997.
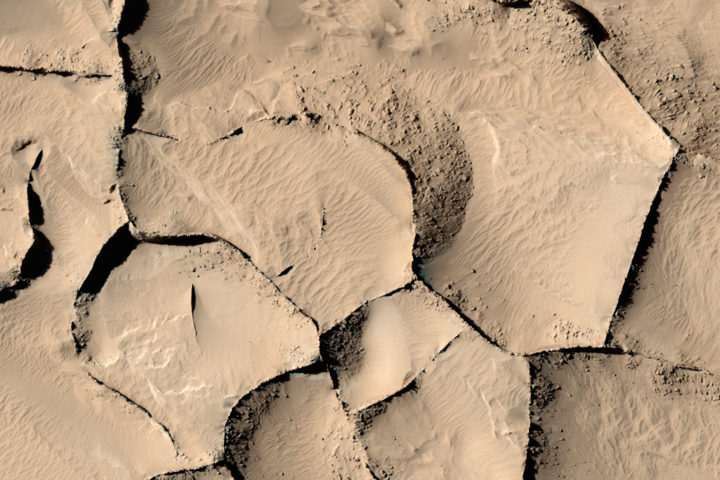
Every month on Earth Matters, we offer a puzzling satellite image. The May 2017 puzzler is above. Your challenge is to use the comments section to tell us what we are looking at, when the image was acquired, and why the scene is interesting.
How to answer. Your answer can be a few words or several paragraphs. (Try to keep it shorter than 200 words). You might simply tell us what part of the world an image shows. Or you can dig deeper and explain what satellite and instrument produced the image, what spectral bands were used to create it, or what is compelling about some obscure speck in the far corner of an image. If you think something is interesting or noteworthy, tell us about it.
The prize. We can’t offer prize money or a trip to Mars, but we can promise you credit and glory. Well, maybe just credit. Roughly one week after a puzzler image appears on this blog, we will post an annotated and captioned version as our Image of the Day. After we post the answer, we will acknowledge the person who was first to correctly ID the image at the bottom of this blog post. We may also recognize certain readers who offer the most interesting tidbits of information about the geological, meteorological, or human processes that have played a role in molding the landscape. Please include your preferred name or alias with your comment. If you work for or attend an institution that you want us to recognize, please mention that as well.
Recent winners. If you’ve won the puzzler in the last few months or work in geospatial imaging, please sit on your hands for at least a day to give others a chance to play.
Releasing Comments. Savvy readers have solved some of our puzzlers after only a few minutes or hours. To give more people a chance to play, we may wait between 24-48 hours before posting the answers we receive in the comment thread.
Good luck!
Editor’s Note: Congratulations to Maxim Nofal for being the first reader to solve the puzzler on the Earth Observatory site, and to Victor Tarazzi for answering first on Facebook. See a labeled version of the May puzzler here.
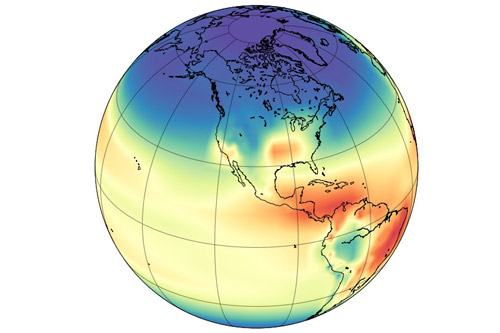
Model simulation of the hydroxyl radical concentration in the atmosphere. Image by Angharad Stell, University of Bristol.
A mystery about global methane trends just got more muddled. Two studies published in April 2017 suggest that recent increases in atmospheric concentrations of methane may not be caused by increasing emissions. Instead, the culprit may be the reduced availability of highly reactive “detergent” molecules called hydroxyl radicals (OH) that break methane down.
Understanding how globally-averaged methane concentrations have fluctuated in the past few decades—and particularly why they have increased significantly since 2007—has proven puzzling to researchers. As we reported last year:
“If you focus on just the past five decades—when modern scientific tools have been available to detect atmospheric methane—there have been fluctuations in methane levels that are harder to explain. Since 2007, methane has been on the rise, and no one is quite sure why. Some scientists think tropical wetlands have gotten a bit wetter and are releasing more gas. Others point to the natural gas fracking boom in North America and its sometimes leaky infrastructure. Others wonder if changes in agriculture may be playing a role.”
The new studies suggest that such theories may be off the mark. Both of them find that OH levels may have decreased by 7 to 8 percent since the early 2000s. That is enough to make methane concentrations increase by simply leaving the gas to linger in the atmosphere longer than before.
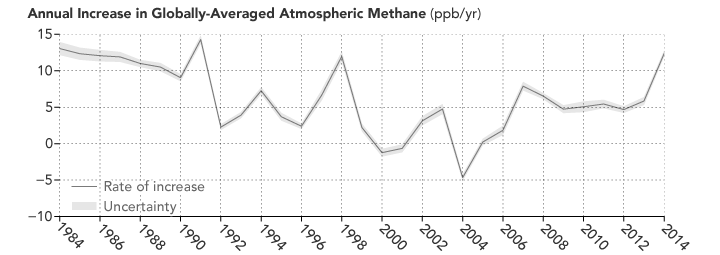
Atmospheric methane has continued to increase, though the rate of the increase has varied considerably over time and puzzled experts. (NASA Earth Observatory image by Joshua Stevens, using data from NOAA. Learn more about the image.)
As a press release from the Jet Propulsion Laboratory (JPL) noted: “Think of the atmosphere like a kitchen sink with the faucet running,” said Christian Frankenberg, an associate professor of environmental science and engineering at Caltech and a JPL researcher. “When the water level inside the sink rises, that can mean that you’ve opened up the faucet more. Or it can mean that the drain is blocking up. You have to look at both.”
Unfortunately, neither of the new studies is definitive. The authors of both papers caution that high degrees of uncertainty remain, and future work is required to reduce those uncertainties. “Basically these studies are opening a new can of worms, and there was no shortage of worms,” Stefan Schwietzke, a NOAA atmospheric scientist, told Science News.
You can find the full studies here and here. The University of Bristol has also published a press release.
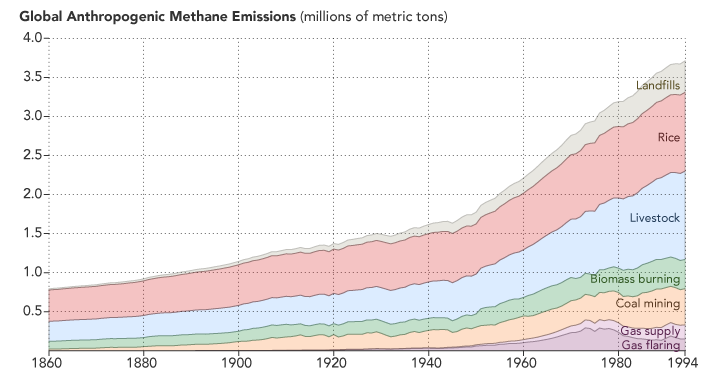
Methane emissions related to human activity are on the rise. (NASA Earth Observatory image by Joshua Stevens, using data from CDIAC. Learn more.)
Here’s a roundup of some of the latest Earth science news from NASA.
ANATOMY OF A TSUNAMI
When it comes to generating a tsunami, it’s not just the vertical movement of the seafloor that matters. Research performed in a giant tank showed that horizontal movement also contributes to the formation and strength of these potentially destructive waves. See the wave tank in the video below, and read more about the research here.
SPRING IS FOR FIELDWORK
Spring in the northern hemisphere can be a good time to hit the field for some ground- and air-based research. Among the myriad projects, NASA scientists are collecting atmospheric data atop a volcano in Hawaii and over the Mid-Atlantic area, and continuing airborne surveys of snow and ice over Earth’s arctic regions.
THE SKINNY ON GREENLAND’S THINNING GLACIERS
NASA data contributed to a study led by University of Texas researchers, which shows that the amount of ice lost by glaciers in Greenland depends on their shape. They found that the thick, wide parts of glaciers lose ice more easily than the thin, steep portions. Read more here.
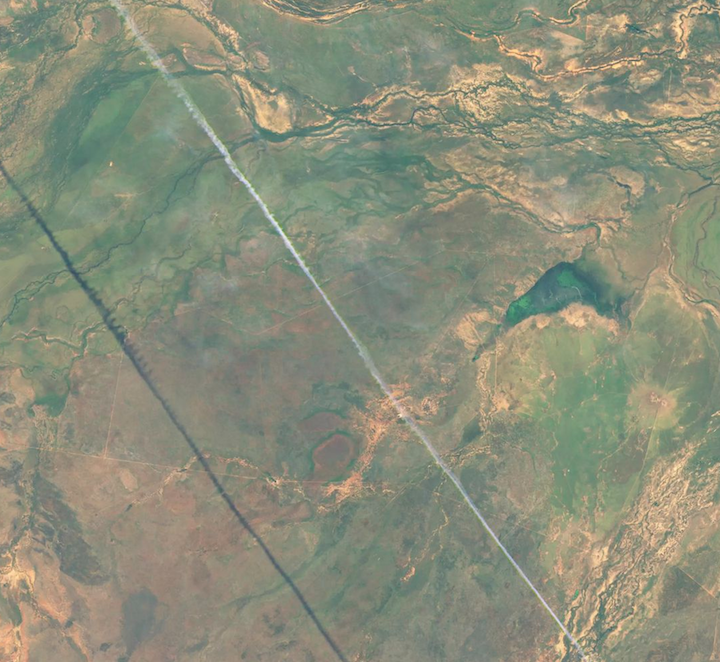
SATELLITE SEES A SOLITARY CONTRAIL
And last but not least, check out this image from Landsat 8 posted to Twitter by @andrewmiskelly. The scene shows a “solitary contrail” over western Queensland, Australia.
