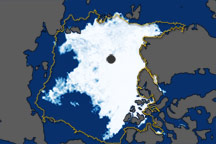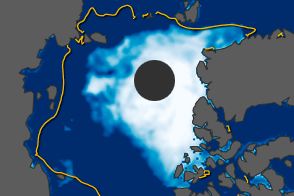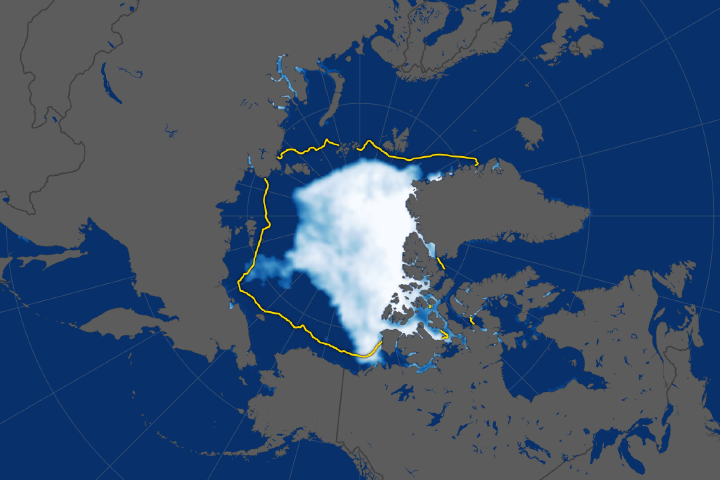

In August and September 2012, sea ice covered less of the Arctic Ocean than at any other time since at least 1979, when the first reliable satellite measurements began. The National Snow and Ice Data Center (NSIDC) and NASA announced in mid-September that the extent of Arctic sea ice had dropped to 3.41 million square kilometers (1.32 million square miles)—well below the previous record of 4.17 million square kilometers (1.61 million square miles) set in 2007.
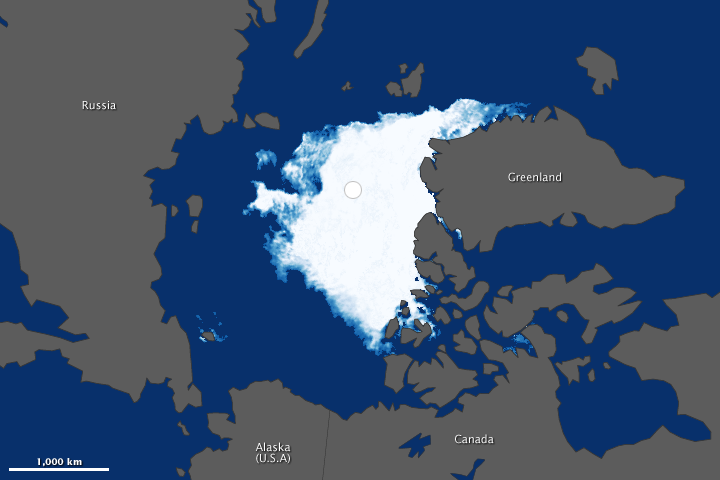
The maps above compare the Arctic ice minimum extents from 2012 (top) and 1984 (bottom). According to NSIDC, the average minimum extent for 1979–2000 was 6.70 million square kilometers (2.59 million square miles). The 1984 minimum was roughly that amount, so a comparison between 2012 and 1984 gives an idea of how much conditions this year strayed from the long-term average. The minimum ice extent in 2012 was about half the average. (Turn on the image-comparison tool to see the difference.)
Arctic sea ice grows through the winter each year and melts through the summer, typically reaching its minimum extent sometime in September. The extent can vary considerably from year to year, sometimes above the long-term average and sometimes below. Extent is defined as the total area in which the ice concentration is at least 15 percent.
The 2012 map was compiled from observations by the Advanced Microwave Scanning Radiometer 2 (AMSR-2) sensor on the Global Change Observation Mission 1st–Water (“Shizuku”) satellite, which is operated by the Japan Aerospace Exploration Agency (JAXA). As of September, AMSR-2 data were still preliminary, as the mission was launched in May 2012 and instruments are still being fully calibrated and validated. But the data agreed with observations from the Special Sensor Microwave Imager/Sounder (SSMIS) from the U.S. Defense Meteorological Satellite Program.
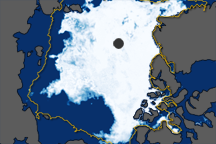
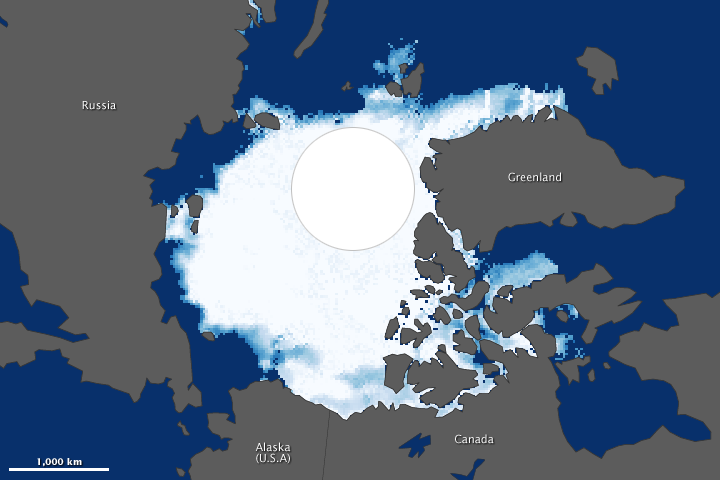
The 1984 image was made from observations by the Scanning Multichannel Microwave Radiometer (SMMR) on the Nimbus-7 satellite. Sea ice in the 1984 image has a blockier appearance because that sensor had coarser resolution. The white circle over the pole in each image is a data gap resulting from satellites flying close to—but not directly over—the poles. The wider orbital coverage by AMSR-2 (and other satellite instruments) has shrunk the size of this gap. The area around the North Pole is ice-covered—an assumption confirmed by many airborne and ice-surface expeditions—but researchers use an average of the concentration just outside the gap to estimate the extent within.
The summer of 2012 witnessed periods of extremely rapid sea ice melt. “In June, sea ice lost about 170,000 to 175,000 square kilometers per day, but only for a few days,” NSIDC scientist Walt Meier explained. “Sea ice melt usually slows down in August to about 60,000 to 70,000 square kilometers a day. But this year, we saw melt rates upwards of 100,000 to 150,000 square kilometers a day, and those high melt rates persisted through the first half of the month.”
Once sea ice begins to melt, it becomes a self-reinforcing process. Because there is less ice to reflect sunlight back into space, more energy is absorbed by the darker ocean water. As sea ice extents drop, less ice survives from year to year. Ice that has formed since the last melt season—“known as first-year ice”—is thinner and more prone to melting than thicker multi-year ice. In the past decade, first-year ice has come to dominate the Arctic Ocean.
According to Comiso, the rapid loss of sea ice through June 2012 was likely associated with the loss of this first-year ice, which was unusually extensive in March 2012. The rapid decline in August 2012, he noted, was caused in part by a strong storm that stirred up the region, breaking ice apart and moving more of it to lower latitudes.
“Climate models have predicted a retreat of the Arctic sea ice; but the actual retreat has proven to be much more rapid than the predictions,” said Claire Parkinson, a climate researcher at NASA Goddard. “There continues to be considerable inter-annual variability in the sea ice cover, but the long-term retreat is quite apparent.”
AMSR-2 is a follow-on to the successful AMSR-E instrument, a JAXA instrument that flew on NASA’s Aqua satellite. AMSR-2 detects microwave radiation in order to measure sea surface temperatures and wind speeds, sea ice concentrations, snow depth, soil moisture, water vapor, cloud liquid water, and precipitation. The AMSR-2 image is provided as a visual assessment of the state of sea ice through a special data access agreement with JAXA and with the principal investigator for sea ice, Josefino Comiso of NASA’s Goddard Space Flight Center.
NASA Earth Observatory image by Jesse Allen, using data from the Advanced Microwave Scanning Radiometer 2 AMSR-2 sensor on the Global Change Observation Mission 1st-Water (GCOM-W1) satellite. Caption by Michon Scott and Mike Carlowicz.