
As category 4 Super Typhoon Usagi churned toward Taiwan on September 19, 2013, a satellite orbiting hundreds of miles above used a radar instrument to map the storm’s inner structure. The instrument on the Tropical Rainfall Measuring Mission (TRMM) observed two tall complexes of rain clouds called hot towers in the inner eyewall, a sign that Usagi was a well-organized storm and strengthening.
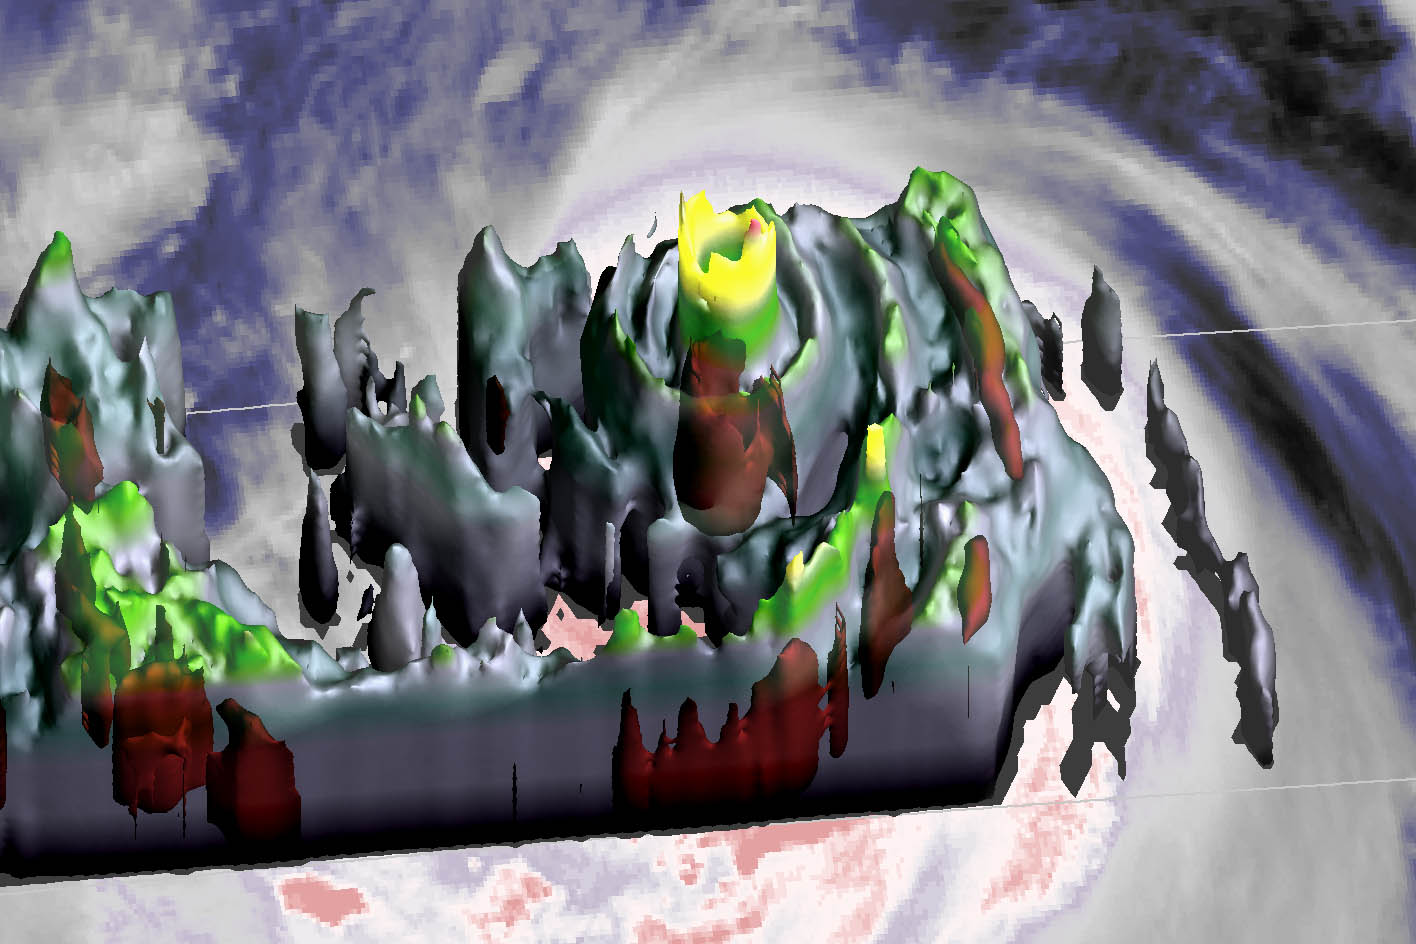
Tropical cyclone “heat engines” extract heat from the ocean’s surface through evaporation and convert a portion of that energy into destructive winds that circle under the eyewall of the storm. All tropical cyclones have heat engines, but several features detected by TRMM suggested that Usagi’s was running particularly efficiently. Radars almost always see eyewalls in strong tropical cyclones, for instance, but they are rarely as symmetrical as Usagi’s is in the visualization shown above. NASA Goddard Space Flight Center researcher Owen Kelley produced the visualization based on TRMM data from the Precipitation Measurement Missions science team at NASA and from the Japan Aerospace Exploration Agency (JAXA).
In the 3D portion of the image, heavy precipitation is shown in dark red. Light precipitation is gray, green, yellow or light red, with the color reflecting how high the storm has lofted the rain production (higher than 8.5 kilometers is green; above 11.5 kilometers is yellow; and higher than 14 kilometers is red). Note that the underlying image, which shows the temperature of cloud tops, uses a different color scale. In it, cool cloud tops are pink and white, medium temperature cloud tops are gray and blue, and warm cloud tops are dark gray and black.
Even the heavy precipitation at the base of the eyewall is fairly symmetric, which is somewhat unusual according to Kelley. Tropical cyclone eyewalls that are this symmetric are called “annular,” and they have a tendency to maintain their intensity for longer periods than tropical cyclones with more lopsided eyewalls. At two locations in the inner eyewall, updrafts were strong enough to produce hot towers—features that are associated with strengthening cyclones. A few hours after TRMM collected the data visualized here, Usagi intensified briefly into a category 5 storm, the highest category on the scale.
Read this Earth Observatory feature and blog post to learn more about how the late Joanne Simpson pioneered the study of hot towers. The video below, produced by NASA Goddard’s Scientific Visualization Studio, offers another view of how hot towers work.
[youtube kUG4-TEqPYc]
Very nice presentation and explanation. One area, with hurricane/typhoon(s) that is not as immediately accessible but I believe has a large effect is the tidal level. This often seems to determine whether it lifts onto the land or gets heavily dampened. Perhaps from the satellite it might be able to better determine this.
Good evening all!
spendid idea Melvin Adams, I’m supporting your thesis about the tidal dynamics after a tropical storm… actually, i’m thinking that such an event can also amplify post eartquakes, even a unloading of gravital mass…
Best wishes from Potsdam,
PC