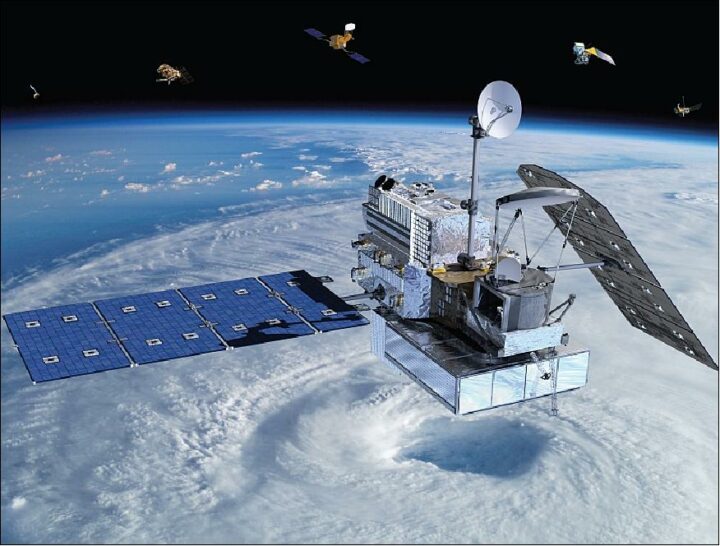
On February 27, 2014, a Japanese rocket launched NASA’s latest satellite to advance how scientists study raindrops from space. The satellite, the Global Precipitation Measurement (GPM) Core Observatory, paints a picture of global precipitation every 30 minutes, with help from its other international satellite partners. It has provided innumerable insights into Earth’s precipitation patterns, severe storms, and into the rain and snow particles within clouds. It has also helped farmers trying to increase crop yields, and aided researchers predicting the spread of fires.
In honor of GPM’s fifth anniversary, we’re highlighting some of our favorite and most unique Earth Observatory stories, as made possible by measurements taken by GPM.
The Second Wettest October in Texas Ever
In Fall 2018, storm after storm rolled through and dumped record rainfall in parts of Texas. When Hurricane Willa hit Texas around October 24, the ground was already soaked. One particularly potent cold front in mid-October dropped more than a foot of rain in areas. By the end of the month, October 2018 was the second wettest month in Texas on record.
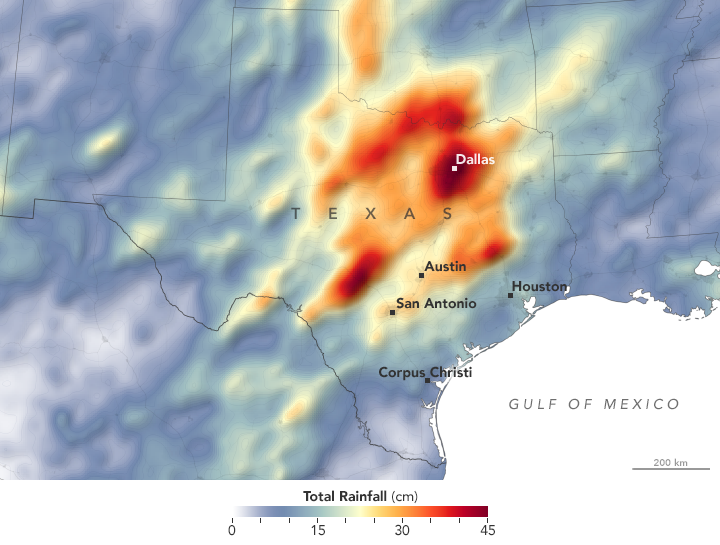
GPM measured the total amount of rainfall over the region from October 1 to October 31, 2018. The brightest areas reflect the highest rainfall amounts, with many places receiving 25 to 45 centimeters (10 to 17 inches) or more during this period. The satellite imagery can also be seen from natural-color satellite imagery.
Observing Rivers in the Air
With the GPM mission’s global vantage point, we can more clearly see how weather systems form and connect with one another. In this visualization from October 11-22, 2017, note the long, narrow bands of moisture in the air, known as “atmospheric rivers.” These streams are fairly common in the Pacific Northwest and frequently bring much of the region’s heavy rains and snow in the fall and winter. But this atmospheric river was unusual for its length—extending roughly 8,000 kilometers (5,000 miles) from Japan to Washington. That’s about two to three times the typical length of an atmospheric river.

Since atmospheric rivers often bring strong winds, they can force moisture up and over mountain ranges and drop a lot of precipitation in the process. In this case, more than four inches of rain fell on the western slopes of the Olympic Mountains and the Cascade Range, while areas to the east of the mountains (in the rain shadow) generally saw less than one inch.
Increasing Crop Yield for Farmers in Pakistan
Knowing how much precipitation is falling or has fallen is useful for people around the world. Farmers, in particular, are interested in knowing precipitation amounts so they can prevent overwatering or underwatering their crops.
The Sustainability, Satellites, Water, and Environment (SASWE) research group at the University of Washington has been working with the Pakistan Council of Research in Water Resources (PCRWR) to bring this kind of valuable information directly to the cell phones of farmers. A survey by the PCRWR found that farmers who used the text message alerts reported a 40 percent savings in water. Anecdotally, many farmers say their income has doubled because they got more crops by applying the correct amount of water.
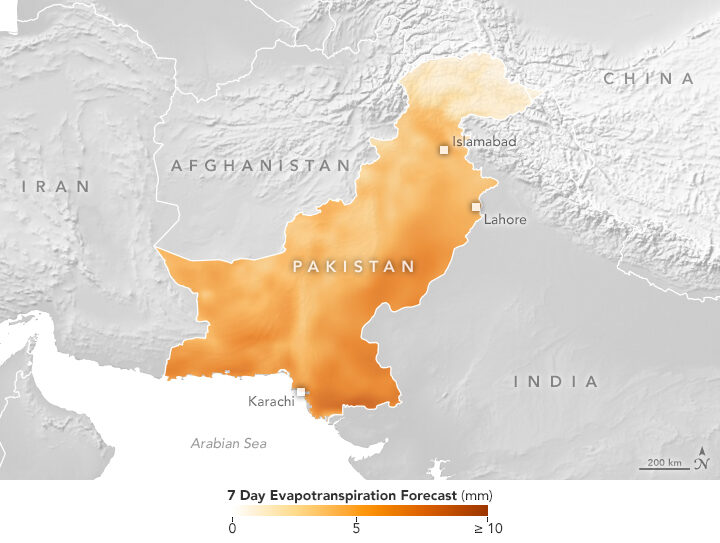
The map above shows the forecast for evapotranspiration for October 16-22, 2018. Evapotranspiration is an indication of the amount of water vapor being removed by sunlight and wind from the soil and from plant leaves. It is calculated from data on temperature, humidity, wind speed, and solar radiation, as well as a global numerical weather model that assimilates NASA satellite data. The team also looks at maps of precipitation, temperature and wind speed to help determine crop conditions. Precipitation data comes from GPM that is combined with ground-based measurements from the Pakistan Meteorological Department.
Forecasting Fire
Precipitation can drastically affect the spread of a fire. For instance, if a region has not received normal precipitation for weeks or months, the vegetation might be drier and more prone to catching fire.
NASA researchers recently created a model that analyzes various weather factors that lead to the formation and spread of fires. The Global Fire Weather Database (GFWED) accounts for local winds, temperatures, and humidity, while also being the first fire prediction model to include satellite–based precipitation measurements.
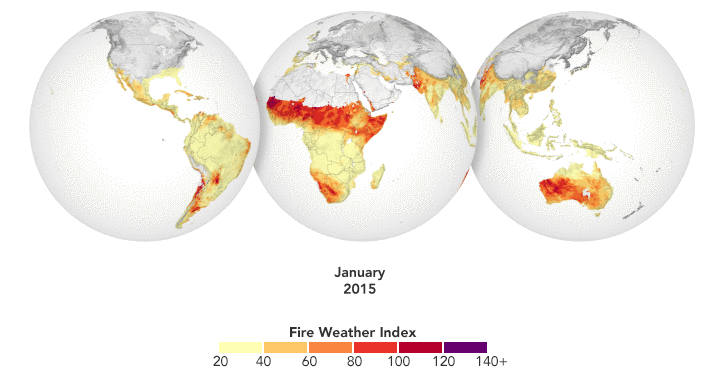
The animation above shows GFWED’s calculated fire danger around the world from 2015 to 2017. The model compiles and analyzes various data sets and produces a rating that indicates how likely and intense fire might become in a particular area. It is the same type of rating that many firefighting agencies use in their day–to–day operations. Historical data are available to understand the weather conditions under which fires have occurred in the past, and near–real–time data are available to gauge current fire danger.
Automatically Detecting Landslides
In this mountainous country of Nepal, 60 to 80 percent of the annual precipitation falls during the monsoon (roughly June to August). That’s also when roughly 90 percent of Nepal’s landslide fatalities occur. NASA researchers have designed an automated system to identify potential landslides that might otherwise go undetected and unreported. This information could significantly improve landslide inventories, leading to better risk management.
The computer program works by scanning satellite imagery for signs that a landslide may have occurred recently, looking at topographical features such as hill slopes.
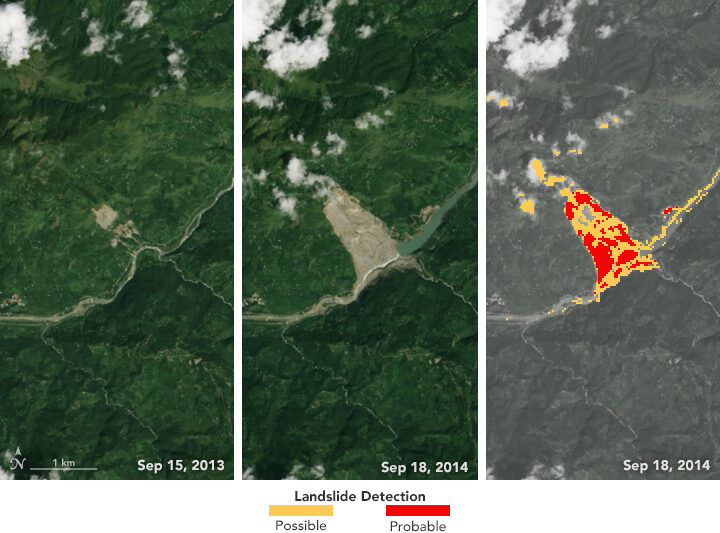
The left and middle images above were acquired by the Landsat 8 satellite on September 15, 2013, and September 18, 2014—before and after the Jure landslide in Nepal on August 2, 2014. The image on the right shows that 2014 Landsat image processed with computer program. The red areas show most of the traits of a landslide, while yellow areas exhibit a few of the proxy traits.
The program also uses data from GPM to help pin when each landslide occurred. The GPM core satellite measures rain and snow several times daily, allowing researchers to create maps of rain accumulation over 24-, 48-, and 72-hour periods for given areas of interest—a product they call Detecting Real-time Increased Precipitation, or DRIP. When a certain amount of rain has fallen in a region, an email can be sent to emergency responders and other interested parties.
The GPM Core Observatory is a joint satellite project by NASA and the Japan Aerospace Exploration Agency. The satellite is part of the larger GPM mission, which consists of about a dozen international satellite partners to provide global observations of rain and snow.
To learn more about GPM’s accomplishments over the past five years, visit: https://pmm.nasa.gov/resources/featured-articles-archive
To learn more about the GPM mission, visit: https://www.nasa.gov/mission_pages/GPM/main/index.html
NASA was mostly shut down for January 2019, but Earth wasn’t. In case you missed it, here are some of the big stories we didn’t cover during the impasse.
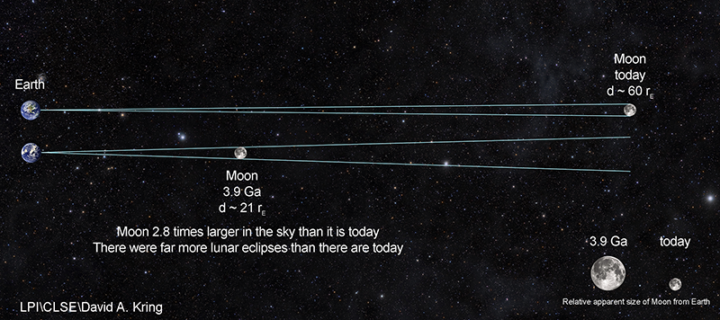
Scientists Find Evidence of An Ancient Earth Rock on the Moon
Four billion years ago, the Moon was about three times closer to Earth than it is now. So if a large asteroid or comet slammed into Earth and jettisoned material into space, it was more likely that rock fragments might end up landing on the Moon. That’s how an international team of scientists working with the Center for Lunar Science and Exploration (CLSE) think that a small fragment composed of quartz, feldspar, and zircon—a combination of minerals commonly found on Earth—ended up embedded within a larger Moon rock collected by Apollo astronauts. The team recently revealed evidence from the ancient rock fragment, suggesting that it is one of the oldest Earth rocks ever found.
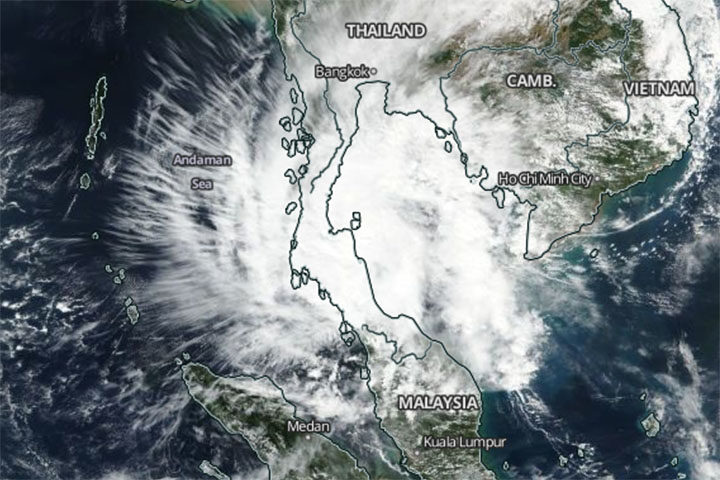
A Rare Typhoon Hits Thailand
It is rare for powerful tropical storms to strike Thailand. Before January 2019, the last time it happened was 1962. So meteorologists took notice when Tropical Storm Pabuk slammed into southern Thailand on January 4, 2019, packing sustained winds of 95 kilometers per hour (60 mph) and delivering torrential rains to some of Thailand’s most popular tourist destinations. The Moderate Resolution Imaging Spectroradiometer (MODIS) on NASA’s Aqua satellite captured this image of the storm on January 4, 2019.
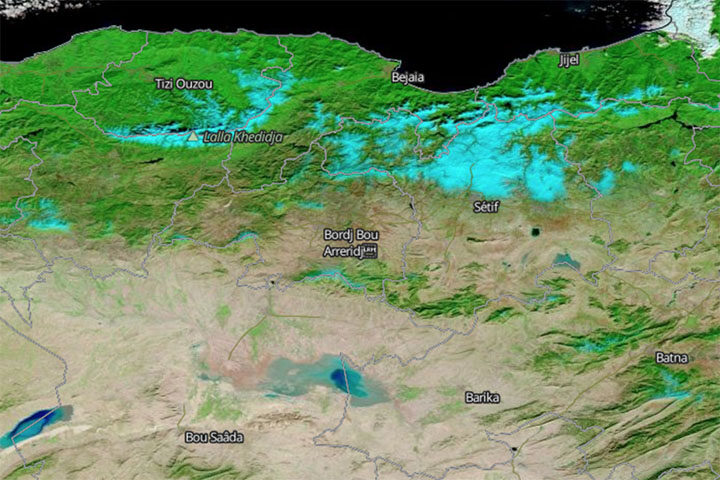
Snow Falls in Algeria (Yes, the Sahara)
In another unusual weather event, fresh snow created surreal scenery in Algeria when it coated Saharan desert dunes in mid-January. This is just the third time snow has fallen in Ain Sefra, the gateway to the Sahara Desert, in the past 37 years. (The last time was 2018.) The Moderate Resolution Imaging Spectroradiometer (MODIS) on NASA’s Terra satellite captured an image of the snow on January 14, 2019. It is composed with false color, using a combination of infraed and visible light (MODIS bands 7-2-1). Snow appears blue with this band combination.
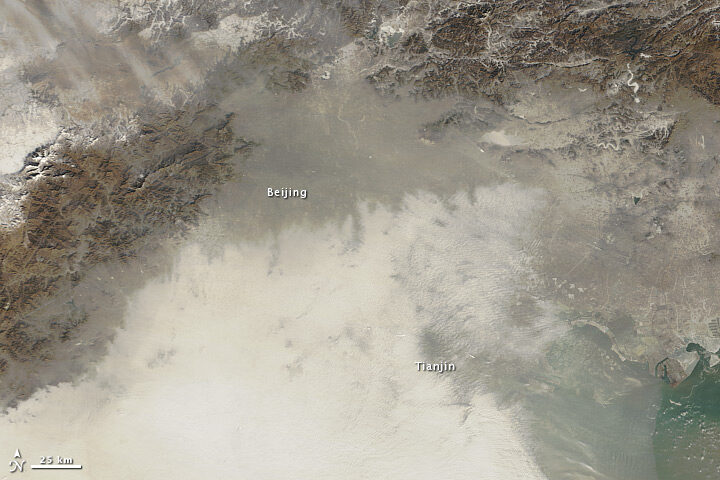
China’s War on Particulates May Be Making Ozone Pollution Worse
For the past few years, China has advanced an ambitious plan to reduce emissions of fine particulate (PM2.5), a harmful type of air pollution. Authorities have restricted the number of vehicles on the roads, capped how much coal industries can burn, and shuttered many polluting factories and power plants. The result has been impressive: over five years, concentrations of PM2.5 in eastern China have fallen nearly 40 percent. But, there is another wrinkle. Particulates also sponge up substances that make it harder for ground-level ozone to form. So even as concentrations of PM2.5 decline, ozone concentrations are rising, new research shows.
Can Satellites Sense Poverty?
Increasingly, yes, at least in rural areas. By analyzing observations of villages in Kenya, one team of researchers recently showed that land use and land cover data from satellites contains some useful clues for identifying the poorest households in rural areas. Key indicators included: the size of buildings within a homestead, the amount of bare agricultural land adjacent to a homestead, and the length of the growing season. The researchers think this type of information could make it easier to monitor the progress of efforts designed to reduce poverty in rural areas, such as the U.N. Sustainable Development Goals.
Today’s post is a reprint of recent story by Carol Rasmussen of NASA’s Earth Science News Team.
NASA has produced the first three-dimensional numerical model of melting snowflakes in the atmosphere. Developed by scientist Jussi Leinonen of NASA’s Jet Propulsion Laboratory, the model provides a better understanding of how snow melts. This can help scientists recognize the signature (in radar signals) of heavier, wetter snow — the kind that snaps power lines and tree limbs — and could be a step toward improving predictions of this hazard.
Leinonen’s model reproduces key features of melting snowflakes that have been observed in nature. First, meltwater gathers in any concave regions of the snowflake’s surface. These liquid-water regions then merge to form a shell of liquid around an ice core, and finally develop into a water drop. The modeled snowflake shown in the video is less than half an inch (one centimeter) long and composed of many individual ice crystals whose arms became entangled when they collided in midair.
Leinonen said he got interested in modeling melting snow because of the way it affects observations with remote sensing instruments. A radar “profile” of the atmosphere from top to bottom shows a very bright, prominent layer at the altitude where falling snow and hail melt — much brighter than atmospheric layers above and below it. “The reasons for this layer are still not particularly clear, and there has been a bit of debate in the community,” Leinonen said. Simpler models can reproduce the bright melt layer, but a more detailed model like this one can help scientists to understand it better, particularly how the layer is related to both the type of melting snow and the radar wavelengths used to observe it.
A paper on the numerical model, titled “Snowflake melting simulation using smoothed particle hydrodynamics,” recently appeared in the Journal of Geophysical Research – Atmospheres.
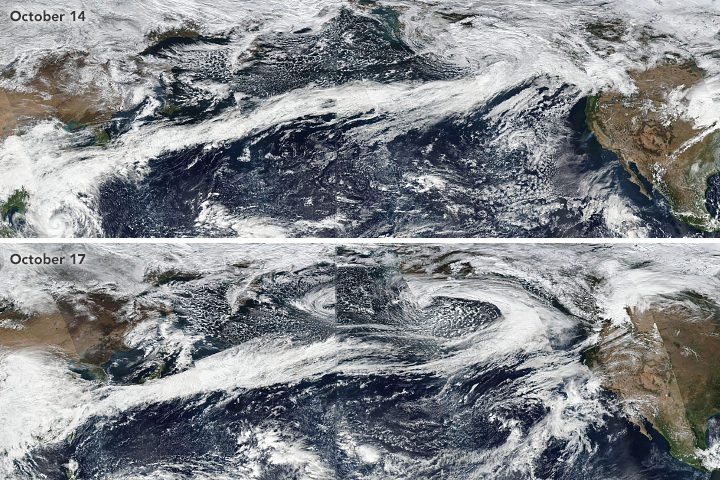
Atmospheric rivers stretched from Asia to North America in October 2017. Learn more.
If you live on the West Coast of North America, you have probably heard meteorologists talk about “atmospheric rivers” — the narrow, low-level plumes of moisture that often accompany extratropical storms and transport large volumes of water vapor across long distances. When atmospheric rivers encounter land, they can drop tremendous amounts of rain and snow. That can be good for replenishing reservoirs and for quenching droughts, but these remarkable meteorological features can also trigger destructive floods, landslides, and wind storms.
During the past decade, atmospheric rivers have fueled a flood of another type: scientific research papers. Prior to 2004, fewer than 10 studies mentioned atmospheric rivers in any given year; in 2015, about 200 studies were published on the matter. The availability of increasingly sophisticated satellite and aircraft data has fueled the trend, according to a recent article in the Bulletin of the American Meteorological Society. Here’s a sampling of what scientists have learned about these rivers in the sky.
They Can Bring Rains, Winds, And Lots of Damage
In a study led by Duane Waliser of NASA’s Jet Propulsion Laboratory and published in Nature Geoscience, researchers showed that atmospheric rivers are among the most damaging storm types in the middle latitudes. Of the wettest and windiest storms (those ranked in the top 2 percent), atmospheric rivers were associated with nearly half of them. Waliser and colleagues found that atmospheric rivers were associated with a doubling of wind speed compared to all storm conditions.
They Shift With The Seasons
During the winter, atmospheric rivers in the Pacific generally shift northward and westward, Bryan Mundhenk of Colorado State University and colleagues concluded in a study. They also found that the El Niño/Southern Oscillation (ENSO) cycle can affect the frequency of atmospheric river events and shift where they occur. The research was based on data processed by MERRA, a NASA reanalysis of meteorological data from satellites.
They Aren’t Just a West Coast Thing
Atmospheric rivers are a global phenomenon and responsible for about 22 percent of all water runoff. One recent study from a University of Georgia team underscored that the U.S. Southeast sees a steady stream of atmospheric rivers. “They are more common than we thought in the Southeast, and it is important to properly understand their contributions to rainfall given our dependence on agriculture and the hazards excessive rainfall can pose,” said Marshall Shepherd of the University of Georgia. Other studies note that atmospheric rivers have contributed to anomalous snow accumulation in East Antarctica and extreme rainfall in the Bay of Bengal.
Climate Change Could Alter Them
A recent study led by Christine Shields of the National Center for Atmospheric Research suggests that climate change could push atmospheric rivers in the Pacific toward the equator and bring more intense rains to southern California. The modeling calls for smaller increases in rain rates in the Pacific Northwest. Another ensemble of models shows a in the number of days with landfalling atmospheric rivers in western North America.
Satellites Are Key to Studying Their Precipitation
While there are few ground-based weather stations in the open ocean to tally how much rain falls, satellites such as those included in the Global Precipitation Measurement (GPM) mission can estimate precipitation rates from above. “Satellites have proven valuable over both the ocean and land, though uncertainties are often larger over land because of complicating factors like the terrain and the presence of snow on the surface,” said Ali Behrangi, the author of a study that assessed the skill of different satellite-derived measurements of precipitation rates.
A June snowstorm just topped off the already thick layer of white stuff atop the Sierra Nevadas. California’s snow water equivalent rose to a heaping 170 percent of normal. But not so long ago, the state was in the midst of a deep drought; its mountains were bare and brown, and water levels plummeted in reservoirs.
Throughout, satellites were watching. Check out the California drought and its aftermath in a video from NASA Earth Observatory:
Editor’s note: Here’s a roundup of the latest eye-catching earth science videos from NASA and beyond. In March, snow emerged as a theme.
Where there is snow, there is water. Scientists trudged through thick white powder in Grand Mesa and the Senator Beck Basin to measure the depth of snow — and its water content — for the SnowEx campaign.
SIX SIDES AND A WHOLE LOT O’ COOL
A scientist with the Global Precipitation Measurement (GPM) mission explains why snowflakes look the way they do.
SIX THINGS YOU DON’T KNOW ABOUT SNOW
Did you know that 60 million Americans rely on snowmelt as their main source of water?
And if you’re not completely buried in white stuff, check out a National Geographic short documentary on a Colorado man who has been taking daily snow measurements for decades.
JUMPING TO LIGHT SPEED IN THE PURSUIT OF SNOW
“Photon Jump” tells the story of an exuberant photon. Follow this miniature light particle as s/he is spat out of a satellite sensor in Earth’s orbit. A team of students at Georgia’s Savannah College of Art and Design (SCAD) created the film for the upcoming ICESat-2 mission, which will measure snow and ice on Earth.
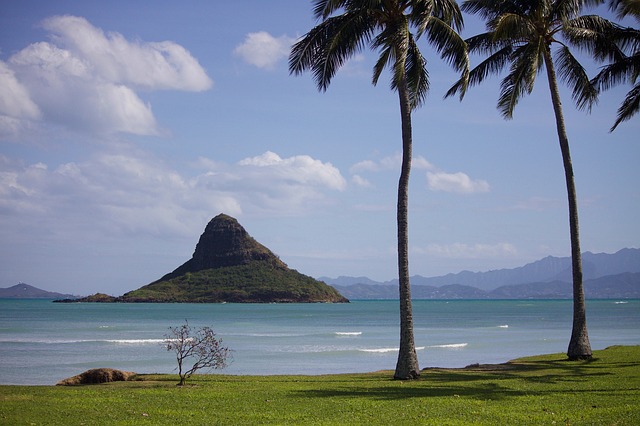
In Hawaii, land of palm trees, pineapples, and year-round surfing, a full-blown blizzard hit last week. The early March storm brought more than 8 inches (20 centimeters) to the top of Mauna Kea volcano, leading authorities to shut the road to the peak.
The snow was all the more surprising given how little has fallen in more traditionally snowy locales. Hawaii received more snow that day than Denver has accumulated over the past seven weeks. The Colorado city got 1.6 inches (4 centimeters) in the past 51 days, according to local news.
The island archipelago also got more white stuff than Chicago. That city, famed for its bitter winters, is currently in the midst of a snow drought, with a mere 0.6 inches (1.5 centimeters) falling in 2017. That’s the least on record since the late 1800s. To put that into perspective: Chicago averages 37 inches (94 cm) of yearly snowfall. By contrast, Hawaii gets a yearly average of 3.7 inches (9 cm).
Thanks to their height, the peaks of Mauna Kea and Mauna Loa volcanoes do receive a dusting now and again. But that snow rarely sticks around for more than a few days, according to Ken Rubin, an assistant professor of geology and geophysics at the University of Hawaii.

Mauna Kea in December 2016. Image: NASA Earth Observatory/Jesse Allen, using Landsat data from the U.S. Geological Survey.

Credit: NASA Earth Observatory/VIIRS/Jesse Allen. More details about the image here.
In the past two months, weather reports in California, Oregon, and Washington have been filled with news of “atmospheric rivers” bringing copious amounts of rain and snow to the western United States. Atmospheric rivers are long, thin fingers of moisture that develop in the tropics and flow into higher latitudes. If one of them makes landfall, huge of amounts of rain and snow can fall in a short period.
Much of this moisture, of course, eventually finds its way back to the sea through rivers. When waterways are swollen and flowing rapidly, they also become rivers of suspended sediment, full of clay, mud, sand, and other debris. Though the flooding from atmospheric river events can be devastating, the enormous amount of sediment they send rushing into the sea can also be surprisingly beautiful.
For instance, on February 11, 2017, the Visible Infrared Imaging Radiometer Suite (VIIRS) on Suomi NPP acquired this remarkable view of rivers and streams spewing sediment into the Pacific Ocean. Close to the outlets of streams and rivers, sediment-rich waters appear brown. As the sediment dissipates and mixes into the ocean, the water appears teal.
Duane Waliser, a scientist at NASA’s Jet Propulsion Laboratory, recently tallied just how damaging atmospheric rivers can be for coastal areas. In a study published in Nature Geoscience, Waliser and a colleague showed that atmospheric rivers are among the most damaging storm types in the middle latitudes. Of the very wettest and windiest storms (those ranked in the top 2 percent), atmospheric rivers were associated with nearly half of them. Waliser and colleagues also found that atmospheric rivers were associated with a doubling of the typical wind speed compared to all storm conditions.

Image originally published by NOAA.
Eighty five years ago today, Wilson Alwyn Bentley died of pneumonia. It was December 23, 1931, and outside his home in Jericho, Vermont, the sky was ripe for snow. His final diary entry read: “Cold north wind afternoon. Snow Flying.” It was the sort of weather he had lived for.
Bentley began to observe snow at 15 years old, when his mother bought him a microscope. It consumed his days, he later recalled:
When the other boys of my age were playing with popguns and sling-shots, I was absorbed in studying things under this microscope: drops of water, tiny fragments of stone, a feather dropped from a bird’s wing, a delicately veined petal from some flower. But always, from the very beginning, it was snowflakes that fascinated me most. The farm folks, up in this north country, dread the winter; but I was supremely happy.
Over the subsequent decades, Bentley photographed more than 5,000 snowflakes, and created the first photomicrograph of an ice crystal, combining a microscope and an accordion-shaped bellows camera. A professor of natural history who became known as “the snowflake man,” he demonstrated what is now a common adage: no two snowflakes are alike.

Photos: Snowflakes circa 1902 by Wilson Bentley. Courtesy of Wikimedia Commons.
The snow Bentley observed at a microscopic scale, satellites now see at the size of whole continents. The subject matter that fascinated him still provides fodder for heaps of scientific papers today.
December 2016 has brought a flurry of Bentley-esuqe weather to the U.S. East Coast, including snow and biting winds. But long before winter kicked into full gear in cities like Washington and New York, it painted landscapes around the world white. From Japan to Kazakhstan, NASA satellites observed snow from space. So if you’re dreaming of a white Christmas or waiting for the gingerbread cookies to bake, here are several images—some we previously published, and others that are quite fresh.

Image: NASA Earth Observatory/Joshua Stevens, using Landsat data from the U.S. Geological Survey.
December 19: ‘Gateway to the Desert’ Gets First Snow in 37 Years
Snow fell in the town of Ain Sefra for the first time in nearly four decades this December. Satellites show a thin, white veil covering the orange sand dunes of the northern Sahara. The Enhanced Thematic Mapper Plus (ETM+) on the Landsat 7 satellite captured this natural-color image of snow on December 19, 2016. On the ground, Photographer Karim Bouchetata captured the snow before it melted.

Image: NASA Earth Observatory/Joshua Stevens using VIIRS day-night band data from the Suomi National Polar-orbiting Partnership.
December 14: The Great Lakes Don a White Cloak
An Arctic air mass brought more snow to communities around the Great Lakes on December 14, 2016. The lake-effect snow comes on the heels of an earlier accumulation that piled up to several feet of snow in some areas, according to reports. Officials issued weather warnings and advisories from northeast Ohio to upstate New York.

Image: NASA Earth Observatory/Jeff Schmaltz, using MODIS data from LANCE/EOSDIS Rapid Response.
December 2: Snow and ash above Katmai
A plume of volcanic ash hangs over the Gulf of Alaska in this natural-color image. The plume is not the product of an active volcano; it contains re-suspended ash from the 1912 eruption of Novarupta, according to the Alaska Volcano Observatory.

Photograph: Astronaut photography from the Expedition 48 crew.
November 27: Snow 2.0
The white hills sprawling in every direction look like mounds built by snow plows, or massive hills of sugar. In fact, they’re the world’s largest gypsum dune field: the White Sands National Monument, located in southern New Mexico.
During the last Ice Age, melting snow and ice from the San Andres Mountains (west of the dunes) and the Sacramento Mountains (to the east) eroded minerals from the hillsides and carried them downhill to the basin below. As the climate warmed and the water evaporated, the basin remained full of selenite (the crystalline form of gypsum) and created the Alkali Flats. Over time, winds broke the crystals into sand grains, which built up into the dunes.

Image: NASA Earth Observatory/Joshua Stevens, using MODIS data from LANCE/EOSDIS Rapid Response.
November 25: Rare November snow in Tokyo
On November 24, 2016, Tokyo received its first November snowfall in more than half a century. The snow fell in and around the Japanese capital, coating the metropolitan area.
The Moderate Resolution Imaging Spectroradiometer (MODIS) on NASA’s Terra satellite captured this natural-color image the same day. Central Tokyo is gray-brown in color, suggesting less accumulation or faster melting. Urban centers tend to shed snow faster than surrounding countryside because they are often hotter, a result of the urban heat island effect.

Image: NASA Earth Observatory/Pola Lem, using MODIS data from LANCE/EOSDIS Rapid Response.
November 20: White hills appear amid green in England
Snow arrived in parts of northern England before a satellite took this image on November 20. According to reports, the same storm brought high winds and lashing rain farther south, in Kent and Sussex.

Image: NASA Earth Observatory/Pola Lem, using MODIS data from LANCE/EOSDIS Rapid Response.
November 17: White Kazakhstan
Broad swaths of Kazakhstan turned white before this Visible Infrared Imaging Radiometer Suite (VIIRS) image was taken on November 17, 2016. Parts of the country saw temperatures dipping well below freezing, with extreme wind chills. That’s not a surprise for locals; the country’s capital, Astana, often experiences frigid days in winter months.

Image: NASA Earth Observatory/Jesse Allen, using EO-1 ALI data provided courtesy of the NASA EO-1 team.
November 5: Snow meets lava in Iceland
More than a year after the latest eruption at Iceland’s Holuhraun lava field, the newly-formed lava may still be toasty underneath. Although the basaltic rock formed a hard crust, according to volcanologists, the flow is probably still hot enough to prevent snow from building up atop it.
“You’re not going to freeze the lava flow,” said Erik Klemetti, a volcanologist at Denison University and author of the Eruptions blog at Wired magazine. “You need to wait for the soil to freeze to get snow to accumulate in temperate latitudes.”

Image: NASA/Jeff Schmaltz.
October 7: Early snow blankets Nebraska
Snow dusted parts of Nebraska on October 6, 2016. This natural-color image, acquired by the Moderate Resolution Imaging Spectroradiometer (MODIS) on NASA’s Terra satellite, shows a white blanket covering about 40 square miles (more than 100 square kilometers). Photos taken by highway cameras showed snow falling along parts of U.S. Route 83 on the afternoon of October 6.
It’s been a really active time for the Earth Observatory and volcanoes. In the past three weeks, we’ve posted images of a night-time eruption of Shiveluch, ongoing activity at Puyehue–Cordón Caulle, daytime activity at the Kizimen Volcano, and my own favorite, a brand new island in the Red Sea. And those are just the images we published!
In recent weeks, we had a good shot of activity at Kilauea, but we skipped it since it only had Halema’uma’u activity — which is much like previous images and not the new ocean entry point, which we’ve yet to glimpse in cloud-free satellite imagery. We received an excellent ALI scene of the submarine El Hierro volcano (which we published) and then the next day we received an image of the same volcano from Landsat 7 (which effectively got scooped by ALI).
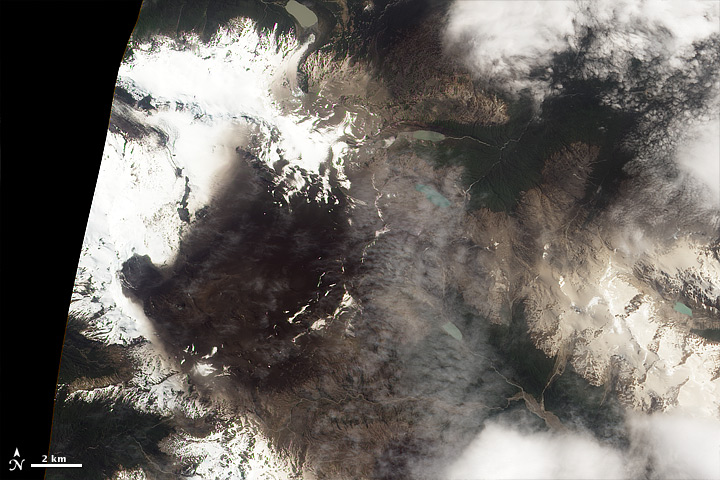
Another of the moderately recent and interesting images of volcanoes we didn’t use is a very nice ALI shot of the Cerro Hudson volcano in Chile.
We do have a good reason for not using the image. Notice the volcanic activity? Yeah, we didn’t see anything either. What makes this image interesting (to me anyway) is that just two weeks earlier, it looked like this:
We did publish that one. There’s actually not much in the way of activity in that one either, but in the published image, you can see a lot of ash that’s fallen on the ground from activity in October at the volcano.
Just two weeks later, with no new activity, almost all the ashfall seems to have “disappeared.” Fresh snow fell and covered much of it. Also, we got a much better shot with ALI of the volcano, getting a very nice view of the entire caldera, the glacier draining it out of the northeast, and forests in the alpine valleys. The ashfall was nowhere near as extensive and damaging as the Puyehue eruption, which at one point spewed out ash that circled the globe.
