

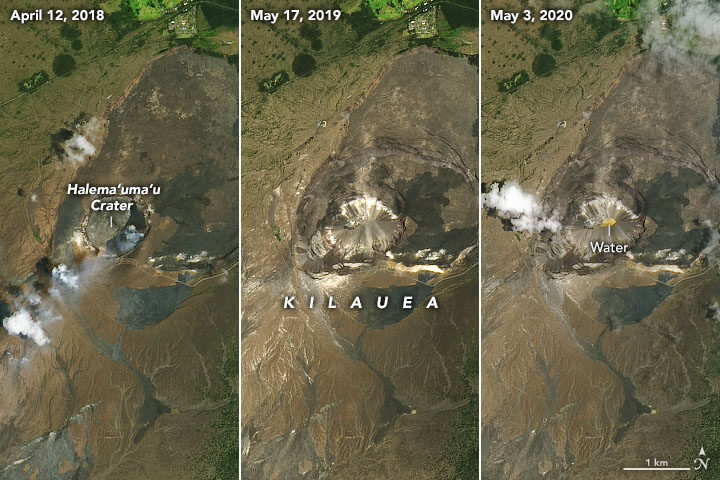
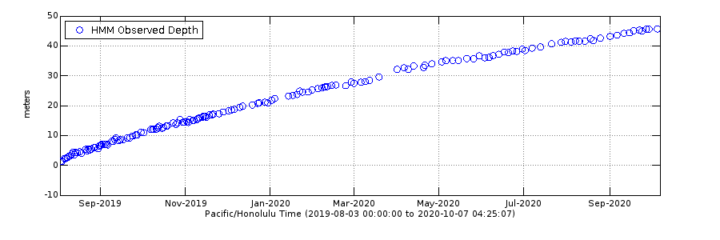
In May 2020, we published a story about a new lake growing in the summit caldera of Hawaii’s Kīlauea volcano. Six months later, the heated lake continues to rise. The water level now tops 40 meters (130 feet), according to U.S Geological Survey (USGS) measurements made with a laser rangefinder.
Though gentle “effusive” eruptions have been the norm at Kīlauea across the past two centuries, the geologic record shows plenty of evidence that the volcano has had periods when violent, explosive eruptions were common. The presence of water in magma is a key factor contributing to explosive eruptions, so USGS scientists have been carefully monitoring the volcano for signs that it may be entering a more explosive and dangerous phase.
As detailed in a September 2020 EOS article, that monitoring has included sending unoccupied aircraft systems (UAS)—drones—deep into the crater to get a closer look at the lake. Scientists have also been conducting regular helicopter flights over the lake and monitoring a suite of ground-based sensors (seismometers, GPS sites, thermal cameras, and others) that measure the motion of the ground, gaseous emissions, and the appearance and temperature of the lake.
Meanwhile, satellites provide the big-picture view. Landsat satellites periodically collect multi-spectral imagery of the lake; the images at the top of this page provide a natural-color perspective. Other satellites with Interferometric Aperture Radar (InSAR) complement the ground-based GPS sites by offering a crucial, large-scale view of land deformation.
“The chance to monitor an incipient volcanic lake is not unprecedented, but it is rare,” a group of USGS geologists wrote in EOS. “Kīlauea’s crater lake provides an opportunity to improve the scientific community’s understanding of how such lakes evolve and interact with magmatic systems below.”
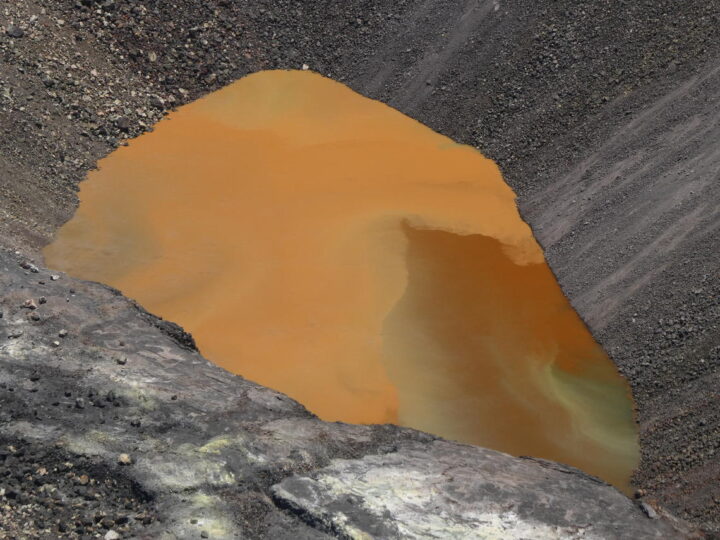
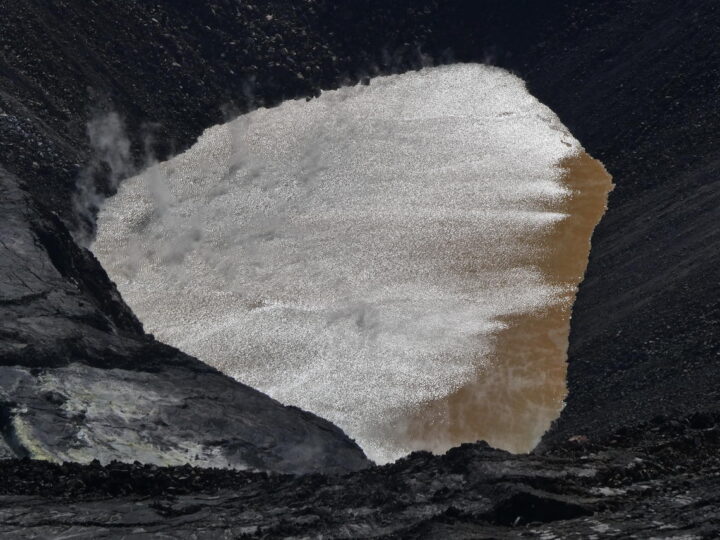
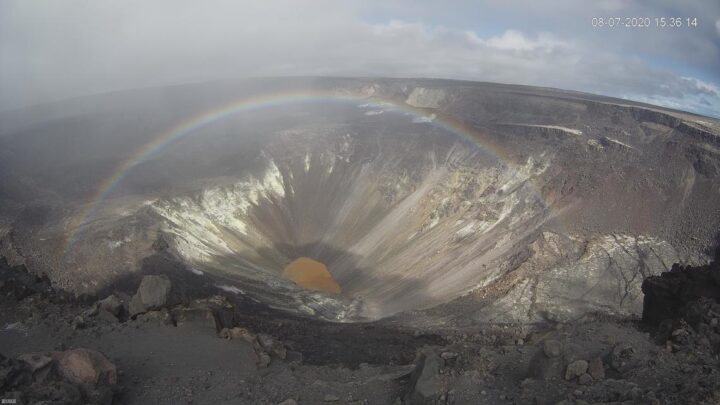
One byproduct of all the scientific monitoring is a steady stream of lake imagery that is visually striking as well as scientifically interesting. In July, for instance, morning sunglint transformed the muddy brown water to something that glittered and shimmered (see photo above). Influxes of new water often set up gradients of color that range from green to rusty orange (also above). And on a day when a light mist moved across the caldera, a webcam at the summit acquired a striking image of a rainbow framing the lake (below). You can find more images in Hawaii Volcano Observatory’s photo and video chronology.
For more than two months, lava has been pouring from part of Hawaii’s Kilauea volcano, destroying homes and remaking the land surface. More data and imagery of the eruption is flowing in from satellites, drones, and ground-based sensors than Earth Observatory can cover, but here are a few striking images that we would be remiss not to share.
By The Lava’s Early Light 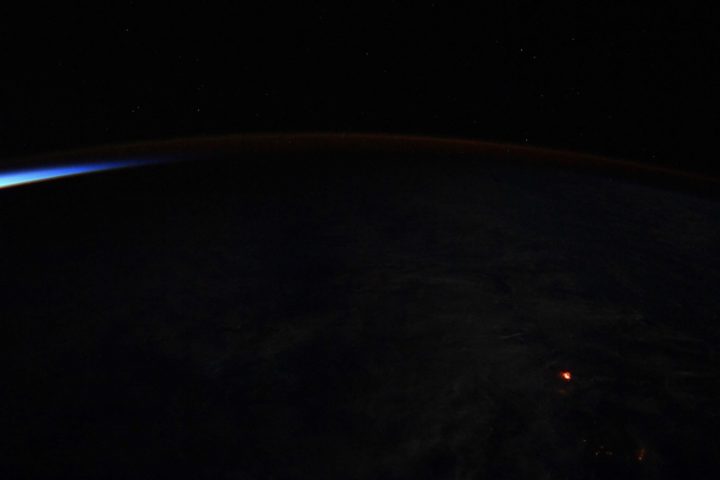
NASA Astronaut Ricky Arnold tweeted this nighttime photograph of lava on June 20, 2018. If the Star Spangled Banner had been composed in Hawaii rather than Baltimore, maybe “lava’s early light” would have made it into the lyrics. Credit: NASA
The Wrong Side of the Lava Flow
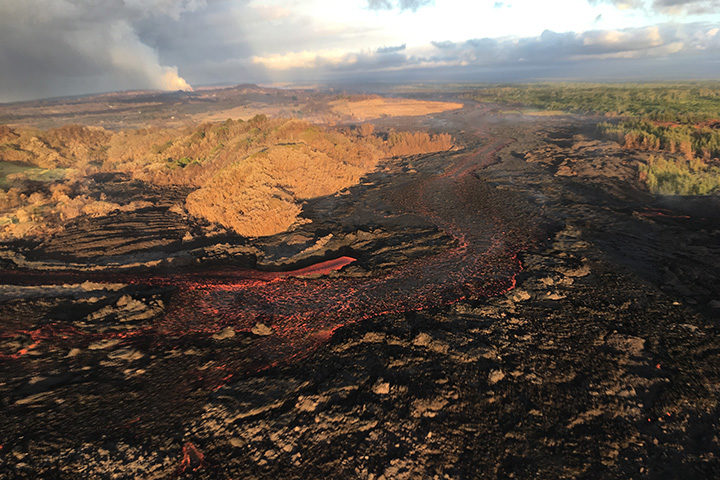
Notice the stark differences in landscapes on the northern and southern sides of the lava channel. With trade winds blowing heat and volcanic gases to the southwest, the north side remained green. Vegetation on the south side, yellowed and brown, took a battering. This aerial photograph was taken on July 10, 2018. Image Credit: USGS.
A Colorful Satellite Perspective on a Collapsing Caldera
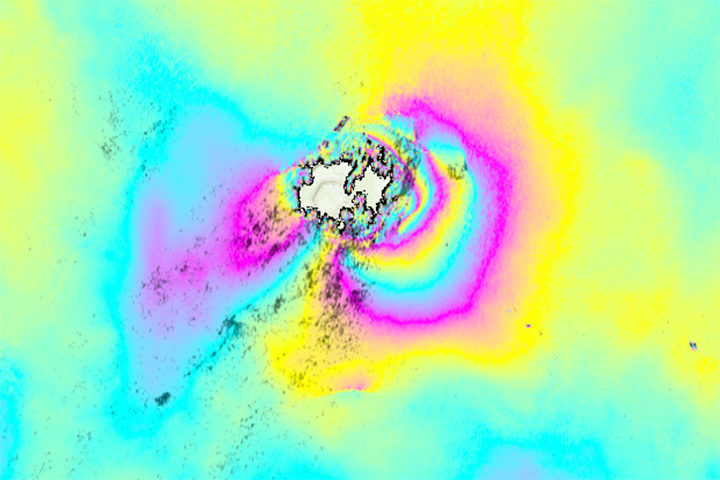
As lava flows from some parts of Kilauea, other parts of the volcano have been sinking. In the case of the summit caldera, the rate of subsidence has been dramatic. This interferometric synthetic aperature radar (InSAR) image, or interferogram, shows surface movement at the summit caldera between June 9 and June 23. Each cycle of yellow-blue-purple indicates approximately 5 inches (13 centimeters) of movement. Areas where the colorful lines are the closest have shifted the most. The data was collected by Advanced Land Observing Satellite-2 (ALOS-2), a Japanese Aerospace Exploration Agency (JAXA) mission. Read more about this image and type of data from NASA’s Disasters Program. Image Credit: NASA/JAXA.
The Same Caldera Collapse Seen from the Ground
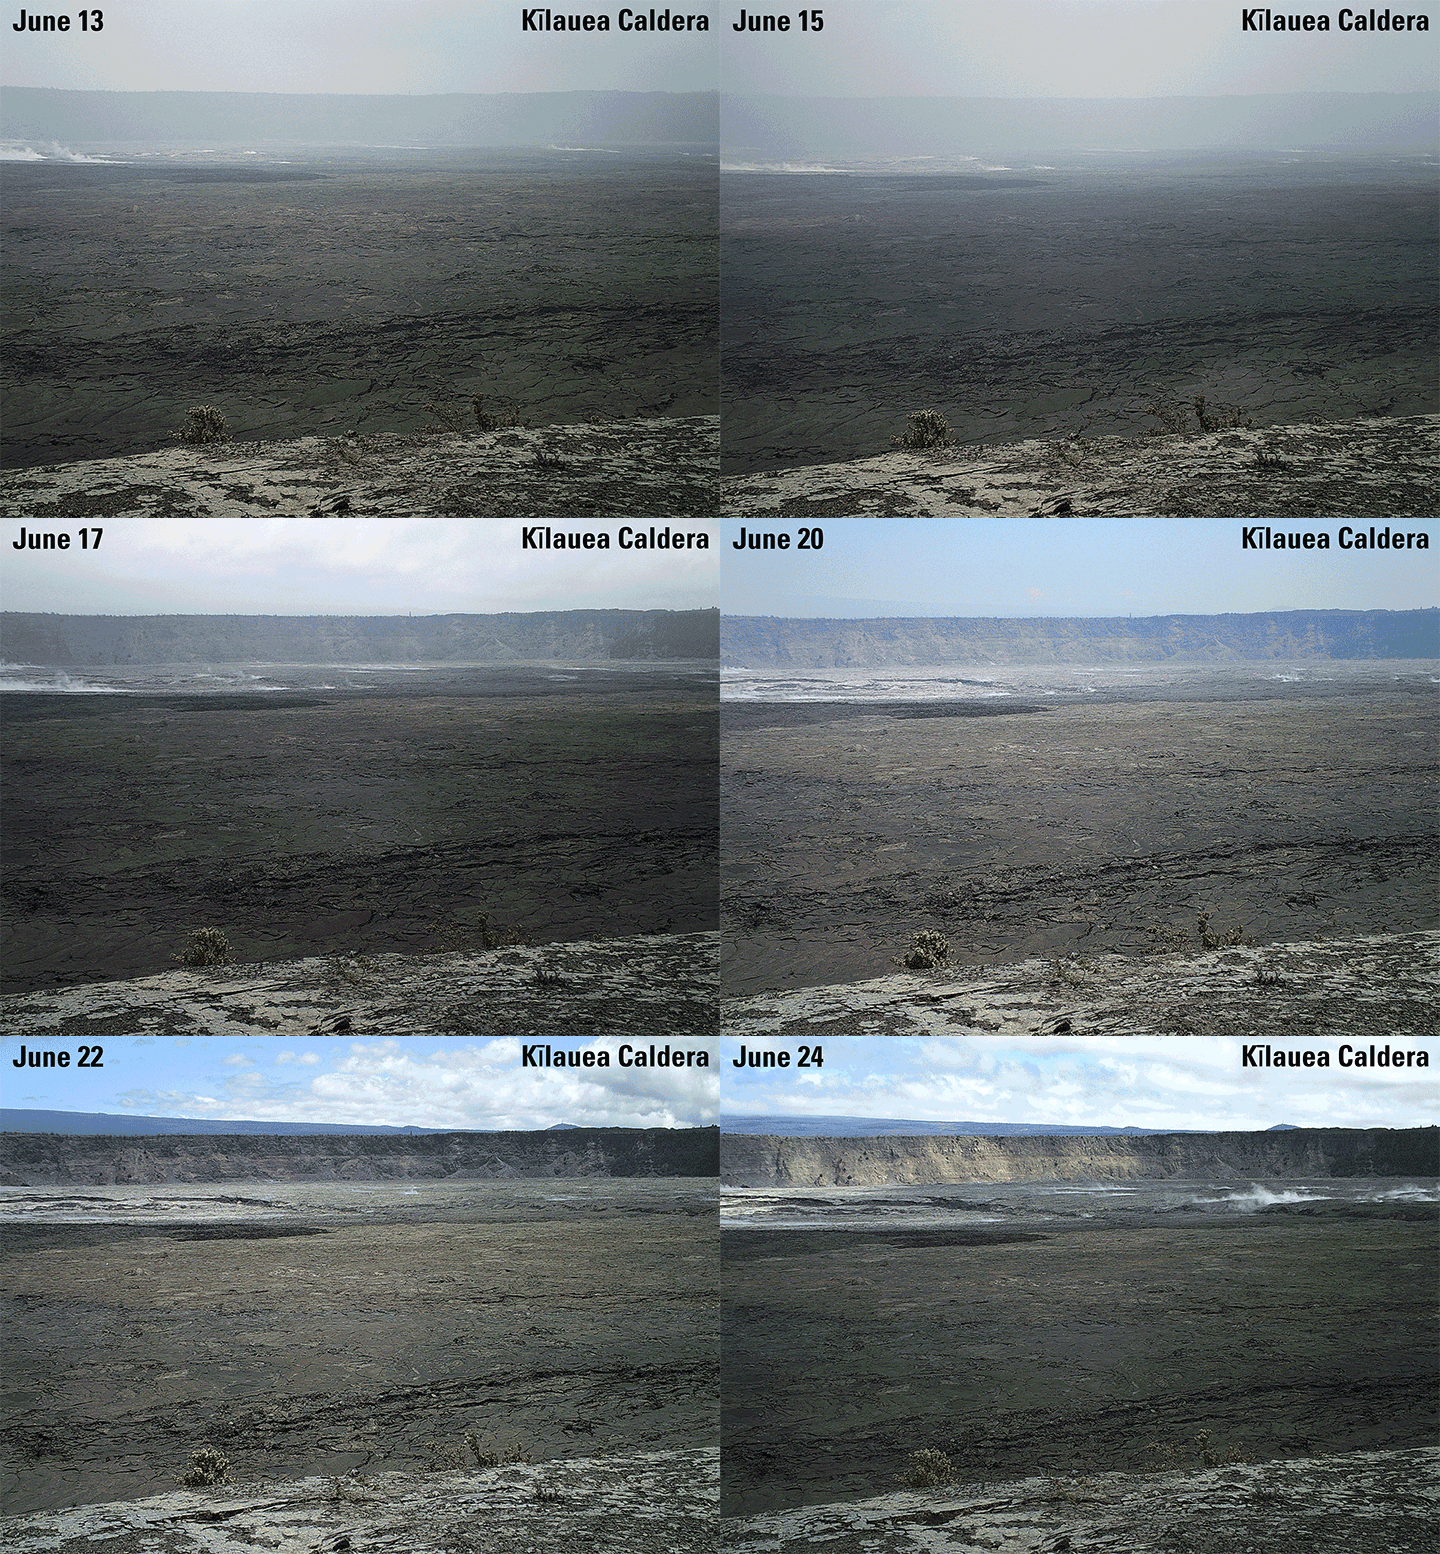
This sequence of images shows rapid subsidence of the caldera floor, along with the development of scarps. One photograph is shown per day between June 13 and 24. The photos were taken from the southern caldera rim, near Keanakāko‘i Crater, and face north. Image Credit: USGS.
Laze Billows into the Air as Lava Pours into the Sea
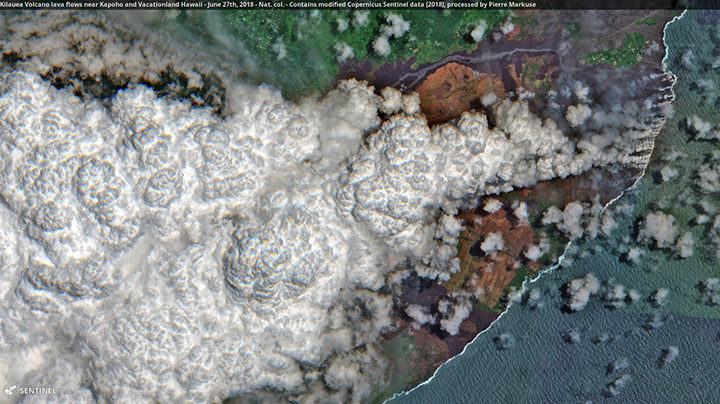
In this Sentinel-2 image, a large plume of laze—steam, volcanic gases, and shards of glass—blows west over Hawaii as lava poured into the sea on June 27, 2018. Pierre Markuse created this image using data from Sentinel-2, a satellite managed by the European Space Agency. He regularly downloads and processes Sentinel and Landsat satellite data and has posted dozens of Kilauea images on Flickr. Image Credit: ESA/Sentinel-2/Markuse
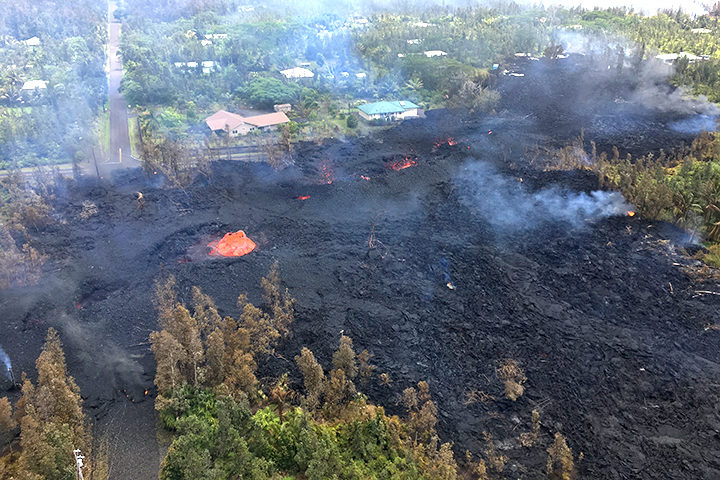
An active fissure in Leilani Estates subdivision. This photo shows fissure 7 on May 5, 2018. Image Credit: U.S. Geological Survey
You have probably seen dramatic images and videos of several new fissure eruptions cracking open the land surface in Hawaii, emitting plumes of gas, and spitting up fountains of lava in the middle of a residential neighborhood.
If you are tracking Kilauea’s eruptions, the U.S. Geological Survey Hawaiian Volcano Observatory (HVO) and Hawaii County Civil Defense are the best sources for the latest information. HVO releases status reports, photos, videos, maps, and near-real time data that are invaluable to understanding what is happening. Hawaii County issues frequent alerts with details about evacuations, road closures, and the status of utilities.
If you want to dig into the science of this eruption, HVO and the Smithsonian Global Volcanism Program both have informative summaries that synthesize what scientists know of Kilauea’s geologic history. There are also knowledgeable volcanologists tracking the eruption closely and offering science-based commentary. Janine Krippner of Concord University (@janinekrippner) is a trained volcanologist who tweets regularly about developments. Ken Rubin @kenhrubin), based at the University of Hawaii, does the same. Erik Klemetti, a volcanologist at Denison University, is reporting on the eruption on his Rocky Planet blog.
To extend the scientific conversation, Earth Matters reached out to a handful of researchers from NASA and elsewhere who are monitoring the volcano. Among those who responded were Simon Carn (Michigan Technological University), Ashley Davies (NASA Jet Propulsion Laboratory), Jean-Paul Vernier (NASA Langley Research Center), Verity Flower (Universities Space Research Association/NASA Goddard Space Flight Center) and Krippner.
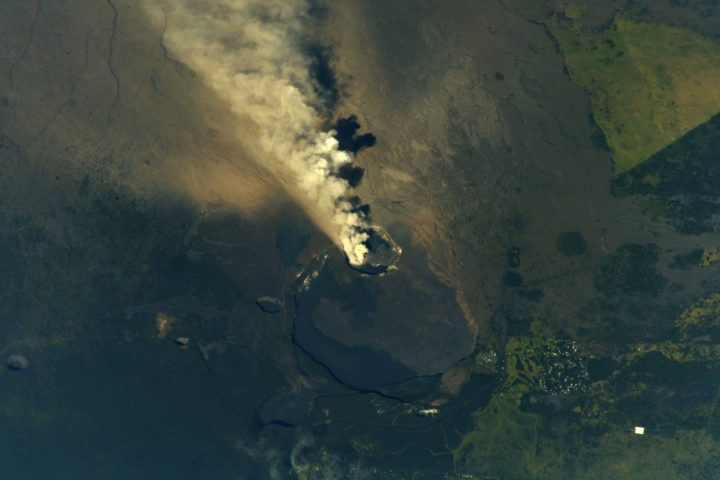
NASA astronaut Drew Feustel tweeted this photograph of a volcanic plume at the summit of Kilauea on May 13, 2018. Image Credit: NASA
Can you briefly describe the steps that happen in an eruption like we’re seeing with Kīlauea?
“First, USGS HVO tiltmeters recorded inflation of the volcano. This was caused by magma moving up from depth, causing the volcano to bulge outwards. The lava lake level in the summit caldera (Halema’uma’u) rose, an indication of the influx of magma into the volcanic plumbing system. Local seismic activity increased due to rock breaking as magma forces its way upwards, and as the broader volcanic edifice adjusted and reacted to the changing stress field. As magma rose, more volcanic gas (including sulfur dioxide) was released. As magma moved into the near surface East Rift Zone, the summit started to deflate, and the lava lake level dropped. There were structural adjustments along the rift, from the summit, to Pu’u O’o, and along the rift, causing earthquakes. Then lava erupted, the whole system began to depressurize, and deflation continued.”
– Ashley Davies

Starting on the afternoon of Monday, April 30, 2018, magma beneath Pu‘u ‘Ō‘ō drained and triggered the collapse of the crater floor. Within hours, earthquakes began migrating east of Pu‘u ‘Ō‘ō, signaling an intrusion of magma along the middle and lower East Rift Zone. Map credit: U.S. Geological Survey. More maps here.
How would you describe the significance or scope of this eruption?
“This eruption is part of the normal life cycle of Kilauea volcano and is comparable to past activity. In fact, 90 percent of the surface of Kilauea is less than 1,000 years old — very young on a geologic time scale. The significance of this eruption is that it is directly occurring in the Leilani community. These people need help and support. Even though we all live with natural hazards, no matter where we are, we don’t often imagine it happening to us.” — Janine Krippner
What can we expect to happen next? Is the fissure eruption likely to persist for a long time?
“It could be a major risk to the Leilani Estates area if the eruption continues. So far, the lava flows have not traveled very far from the eruptive fissure. If this changes or the fissure extends in length, then more property will be destroyed and major roads could be cut.”
— Simon Carn
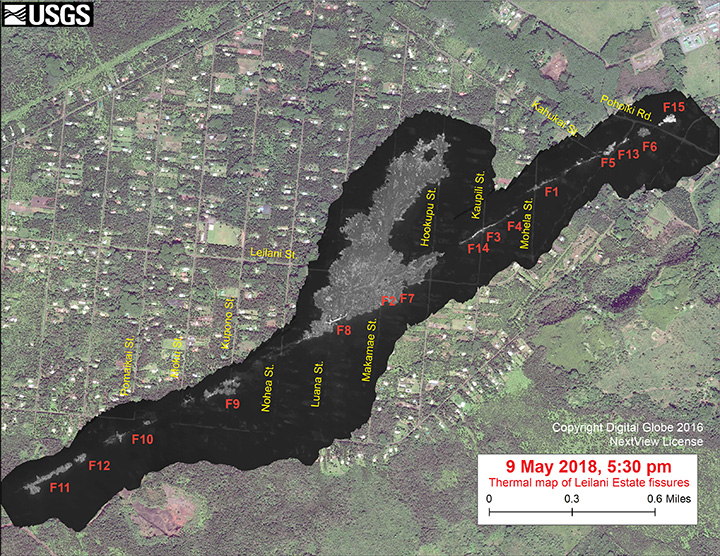
This map overlays a georegistered mosaic of thermal images collected during a U.S. Geological Survey helicopter overflight of the fissures in Leilani Estates on May 9, 2018. The base is a copyrighted satellite image (used with permission) provided by Digital Globe. Temperature in the thermal image is displayed as gray-scale values, with the brightest pixels indicating the hottest areas (white shows active breakouts). Image: Courtesy of USGS, Copyright Digital Globe, NextView License.
“This eruption could persist for quite a while, but it is impossible to tell how long. This is a dynamic situation, and new fissures could start and stop with little to no warning. The risk of lava inundation is real and significant, depending on where lava is extruded at the surface and how much.” — Janine Krippner
Can you address the health hazards associated with sulfur dioxide?
“The problem with sulfur dioxide is that if you breathe it in, it can combine with water in the lungs to create an acid. With sulfur dioxide issuing from the fissures in an inhabited area, it makes for unhealthy concentrations locally. HVO has more on this here.” — Ashley Davies
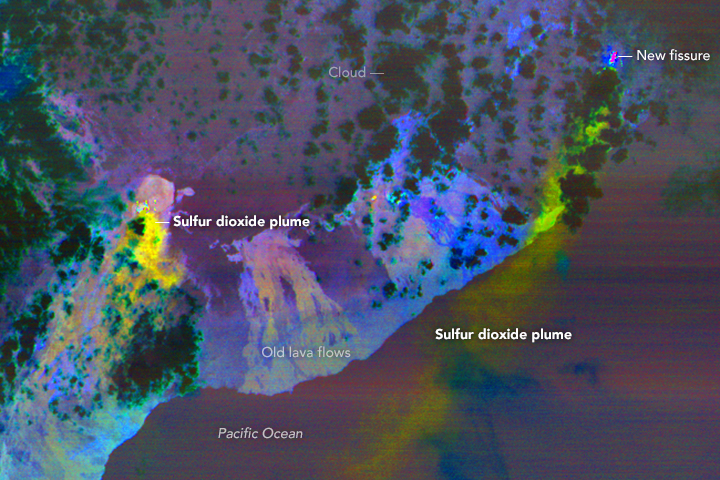
This false-color ASTER image was acquired on May 6, 2018. It shows the sulfur dioxide plume in yellow and yellow-green coming from new activity in Leilani Estates. A smaller, but thicker, sulfur dioxide plume can be seen coming from Kilauea’s main vent. Image Credit: NASA/ASTER
“Sulfur dioxide is a common occurrence in Hawaii, as vog (volcanic smog), which is a mixture of sulfur and aerosols. Sulfur dioxide and/or vog can cause irritation to eyes and airways, causing coughing, wheezing, headaches, and sore throats. People with preexisting conditions, such as asthma, are more at risk. Sulfur dioxide levels have been measured at dangerous and deadly levels near the fissures.” — Janine Krippner
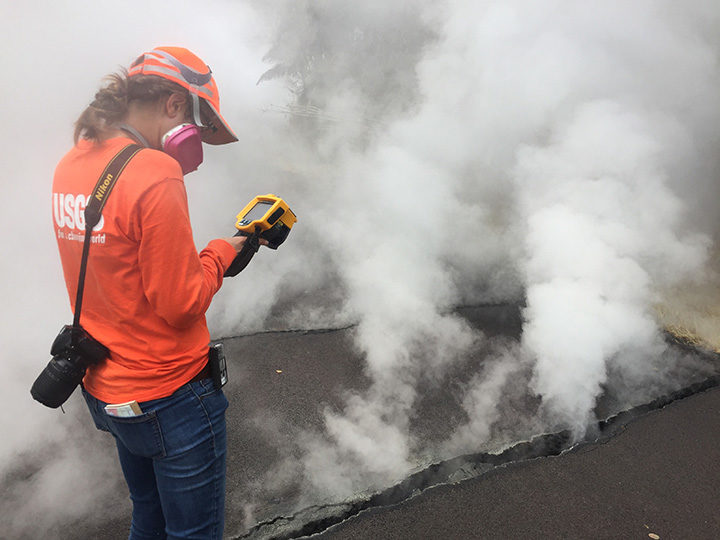
Volcanic gases rise from a fissure on Nohea Street, Leilani Estates. An HVO geologist measured a temperature of 103 degrees C (218 degree F). The asphalt road was describes as “mushy” from the heat. Image Credit: U.S. Geological Survey.
Which satellites sensors are making observations of Kilauea’s plume?
There are several. The Multi-angle Imaging SpectroRadiometer (MISR) can measure the height of plumes from stereo imagery, and makes observations of the size and shape of the particles, which is useful for determining the degree to which the plume is rich in liquid sulfate and water particles versus solid, angular ash particles. The Moderate Resolution Imaging Spectroradiometer (MODIS) and Visible Infrared Imaging Radiometer Suite (VIIRS) are collecting daily snapshots of the amount of particulate matter in the plume — as well as making observations of the sulfur dioxide plumes based on their thermal bands. The Operational Land Imager (OLI) and Advanced Spaceborne Thermal Emission and Reflection Radiometer (ASTER) provide more detailed images, though overpasses are less frequent. Finally, synthetic aperture radar on Sentinel 1 is tracking how much the land deforms as the eruption progresses.
— Verity Flower
To what degree are satellites sensors like OMPS and OMI useful for monitoring sulfur dioxide emissions?
Satellites provide unique information on the total sulfur dioxide mass and spatial distribution in a plume ‘snapshot’, but provide minimal information on sulfur dioxide at ground level. Other techniques provide more localized measurements but can detect surface concentrations. — Simon Carn
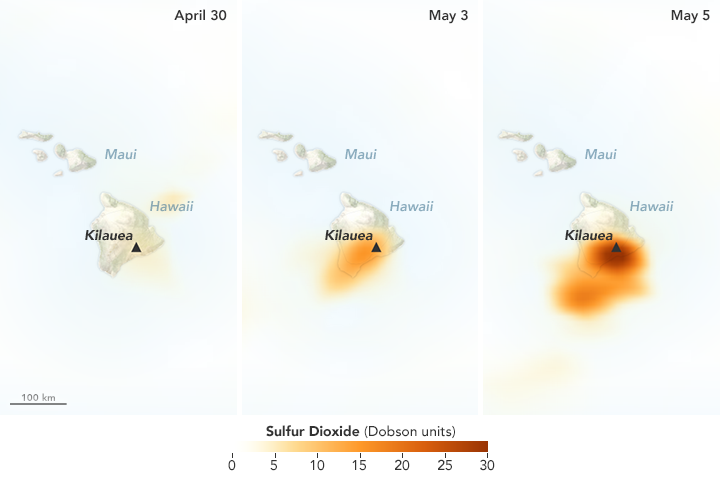
The Ozone Mapping Profiler Suite (OMPS) detected increasing concentrations of sulfur dioxide over Hawaii in May 2018. Image Credit: NASA Earth Observatory. Learn more about this map.
Are there other reasons to monitor volcanic plumes aside from health hazards?
The particles in volcanic ash have sharp, angular edges that can abrade aircraft windows hindering the pilots ability to navigate. Where these ash particles enter aircraft engines the high temperatures cause ash to melt, coating the rotors, air intakes and casings that can lead to engine failure. Plumes can also have effects—sometimes even positive effects—on the wider environment. Ash falls can destroy crops and damage infrastructure during an eruption, but they can also add nutrients to the ocean that fuel phytoplankton blooms and nutrients to the soil that make farmland more fertile on longer timescales. — Verity Flower
Can you tell me anything about the wind patterns around Hawaii?
So far, northwesterly trade winds, which are common in this area, have kept the plume over the ocean. The winds do occasionally shift for short periods, which could bring more volcanic pollution over populated areas. — Verity Flower
What has NASA been doing in response to the eruption?
“The NASA Disasters Program is working with several teams to assess the eruption and make information available to first responders and others. We are working with several instrument teams to monitor the sulfur dioxide plume. We are also looking at thermal imagery from VIIRS to detect the position of the new fissures. The VIIRS thermal anomaly is usually used for fire detection, but it appears to be a useful tool for detecting the fissure events in Leilani Estates. We are also using ASTER thermal anomaly data in near-real time to detect the fissures. You can find imagery and data from several sources showing different aspects of the eruption here.” — Jean-Paul Vernier
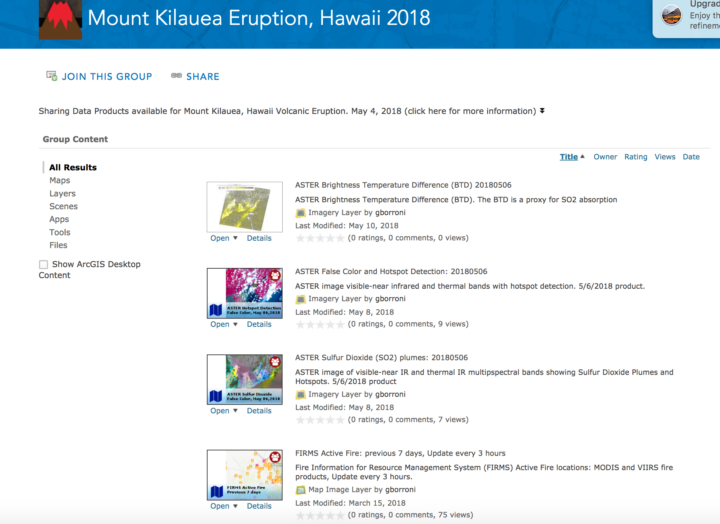
A screenshot from a repository of maps and images related to the eruption compiled by the NASA Earth Science Disasters Program. Image Credit: NASA
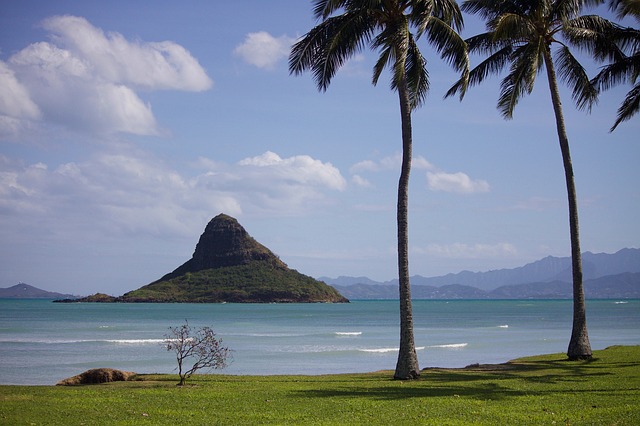
In Hawaii, land of palm trees, pineapples, and year-round surfing, a full-blown blizzard hit last week. The early March storm brought more than 8 inches (20 centimeters) to the top of Mauna Kea volcano, leading authorities to shut the road to the peak.
The snow was all the more surprising given how little has fallen in more traditionally snowy locales. Hawaii received more snow that day than Denver has accumulated over the past seven weeks. The Colorado city got 1.6 inches (4 centimeters) in the past 51 days, according to local news.
The island archipelago also got more white stuff than Chicago. That city, famed for its bitter winters, is currently in the midst of a snow drought, with a mere 0.6 inches (1.5 centimeters) falling in 2017. That’s the least on record since the late 1800s. To put that into perspective: Chicago averages 37 inches (94 cm) of yearly snowfall. By contrast, Hawaii gets a yearly average of 3.7 inches (9 cm).
Thanks to their height, the peaks of Mauna Kea and Mauna Loa volcanoes do receive a dusting now and again. But that snow rarely sticks around for more than a few days, according to Ken Rubin, an assistant professor of geology and geophysics at the University of Hawaii.

Mauna Kea in December 2016. Image: NASA Earth Observatory/Jesse Allen, using Landsat data from the U.S. Geological Survey.