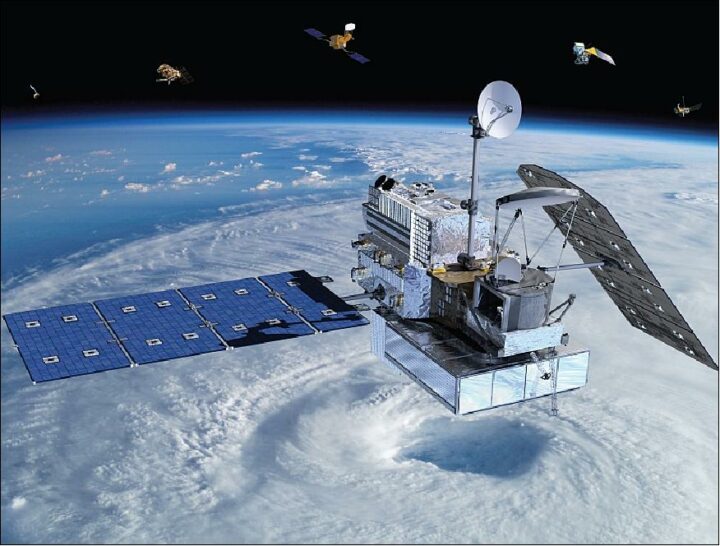
On February 27, 2014, a Japanese rocket launched NASA’s latest satellite to advance how scientists study raindrops from space. The satellite, the Global Precipitation Measurement (GPM) Core Observatory, paints a picture of global precipitation every 30 minutes, with help from its other international satellite partners. It has provided innumerable insights into Earth’s precipitation patterns, severe storms, and into the rain and snow particles within clouds. It has also helped farmers trying to increase crop yields, and aided researchers predicting the spread of fires.
In honor of GPM’s fifth anniversary, we’re highlighting some of our favorite and most unique Earth Observatory stories, as made possible by measurements taken by GPM.
The Second Wettest October in Texas Ever
In Fall 2018, storm after storm rolled through and dumped record rainfall in parts of Texas. When Hurricane Willa hit Texas around October 24, the ground was already soaked. One particularly potent cold front in mid-October dropped more than a foot of rain in areas. By the end of the month, October 2018 was the second wettest month in Texas on record.
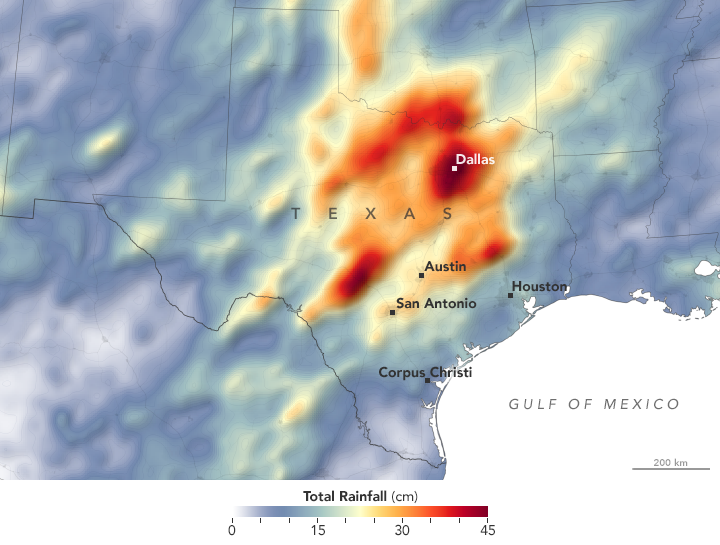
GPM measured the total amount of rainfall over the region from October 1 to October 31, 2018. The brightest areas reflect the highest rainfall amounts, with many places receiving 25 to 45 centimeters (10 to 17 inches) or more during this period. The satellite imagery can also be seen from natural-color satellite imagery.
Observing Rivers in the Air
With the GPM mission’s global vantage point, we can more clearly see how weather systems form and connect with one another. In this visualization from October 11-22, 2017, note the long, narrow bands of moisture in the air, known as “atmospheric rivers.” These streams are fairly common in the Pacific Northwest and frequently bring much of the region’s heavy rains and snow in the fall and winter. But this atmospheric river was unusual for its length—extending roughly 8,000 kilometers (5,000 miles) from Japan to Washington. That’s about two to three times the typical length of an atmospheric river.

Since atmospheric rivers often bring strong winds, they can force moisture up and over mountain ranges and drop a lot of precipitation in the process. In this case, more than four inches of rain fell on the western slopes of the Olympic Mountains and the Cascade Range, while areas to the east of the mountains (in the rain shadow) generally saw less than one inch.
Increasing Crop Yield for Farmers in Pakistan
Knowing how much precipitation is falling or has fallen is useful for people around the world. Farmers, in particular, are interested in knowing precipitation amounts so they can prevent overwatering or underwatering their crops.
The Sustainability, Satellites, Water, and Environment (SASWE) research group at the University of Washington has been working with the Pakistan Council of Research in Water Resources (PCRWR) to bring this kind of valuable information directly to the cell phones of farmers. A survey by the PCRWR found that farmers who used the text message alerts reported a 40 percent savings in water. Anecdotally, many farmers say their income has doubled because they got more crops by applying the correct amount of water.
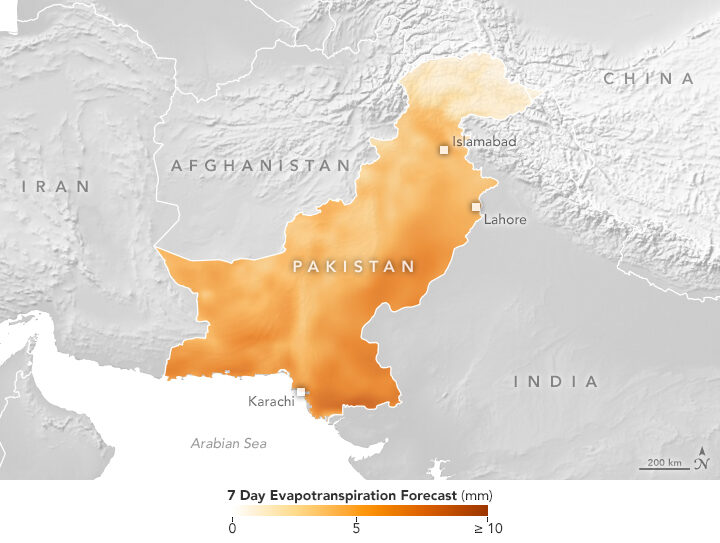
The map above shows the forecast for evapotranspiration for October 16-22, 2018. Evapotranspiration is an indication of the amount of water vapor being removed by sunlight and wind from the soil and from plant leaves. It is calculated from data on temperature, humidity, wind speed, and solar radiation, as well as a global numerical weather model that assimilates NASA satellite data. The team also looks at maps of precipitation, temperature and wind speed to help determine crop conditions. Precipitation data comes from GPM that is combined with ground-based measurements from the Pakistan Meteorological Department.
Forecasting Fire
Precipitation can drastically affect the spread of a fire. For instance, if a region has not received normal precipitation for weeks or months, the vegetation might be drier and more prone to catching fire.
NASA researchers recently created a model that analyzes various weather factors that lead to the formation and spread of fires. The Global Fire Weather Database (GFWED) accounts for local winds, temperatures, and humidity, while also being the first fire prediction model to include satellite–based precipitation measurements.
The animation above shows GFWED’s calculated fire danger around the world from 2015 to 2017. The model compiles and analyzes various data sets and produces a rating that indicates how likely and intense fire might become in a particular area. It is the same type of rating that many firefighting agencies use in their day–to–day operations. Historical data are available to understand the weather conditions under which fires have occurred in the past, and near–real–time data are available to gauge current fire danger.
Automatically Detecting Landslides
In this mountainous country of Nepal, 60 to 80 percent of the annual precipitation falls during the monsoon (roughly June to August). That’s also when roughly 90 percent of Nepal’s landslide fatalities occur. NASA researchers have designed an automated system to identify potential landslides that might otherwise go undetected and unreported. This information could significantly improve landslide inventories, leading to better risk management.
The computer program works by scanning satellite imagery for signs that a landslide may have occurred recently, looking at topographical features such as hill slopes.
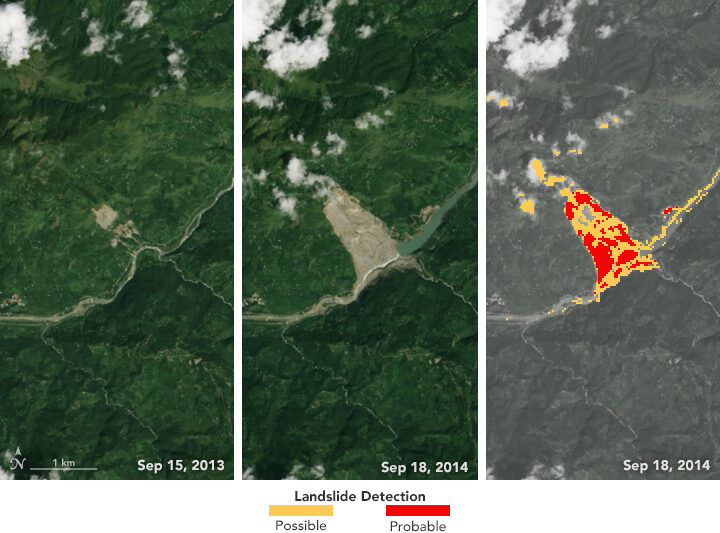
The left and middle images above were acquired by the Landsat 8 satellite on September 15, 2013, and September 18, 2014—before and after the Jure landslide in Nepal on August 2, 2014. The image on the right shows that 2014 Landsat image processed with computer program. The red areas show most of the traits of a landslide, while yellow areas exhibit a few of the proxy traits.
The program also uses data from GPM to help pin when each landslide occurred. The GPM core satellite measures rain and snow several times daily, allowing researchers to create maps of rain accumulation over 24-, 48-, and 72-hour periods for given areas of interest—a product they call Detecting Real-time Increased Precipitation, or DRIP. When a certain amount of rain has fallen in a region, an email can be sent to emergency responders and other interested parties.
The GPM Core Observatory is a joint satellite project by NASA and the Japan Aerospace Exploration Agency. The satellite is part of the larger GPM mission, which consists of about a dozen international satellite partners to provide global observations of rain and snow.
To learn more about GPM’s accomplishments over the past five years, visit: https://pmm.nasa.gov/resources/featured-articles-archive
To learn more about the GPM mission, visit: https://www.nasa.gov/mission_pages/GPM/main/index.html
