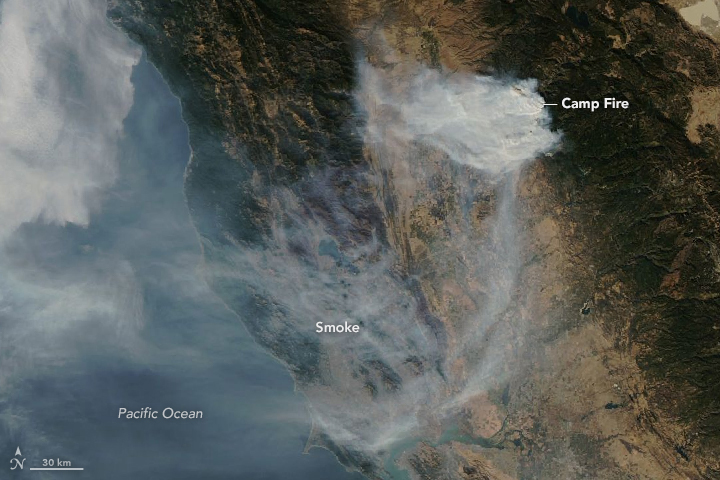
Image Credit: NASA Earth Observatory/Aqua/MODIS
As powerful downslope winds sent the deadly Camp Fire raging through bone-dry vegetation in northern California on November 8, 2018, sensors on the ground and in space began to detect sharp increases in air pollution downwind of the inferno.
From space, the Moderate Resolution Imaging Spectroradiometer (MODIS) and Visible Infrared Imaging Radiometer Suite (VIIRS) sensor observed expansive smoke and aerosol plumes over California’s Central Valley and coast soon after the fire began. Likewise, the Ozone Mapping Profiler Suite (OMPS) on Suomi NPP observed unusually high aerosol levels, and the Measurement of Pollution in the Troposphere (MOPITT) on Terra picked up strong carbon monoxide signals from the fire.
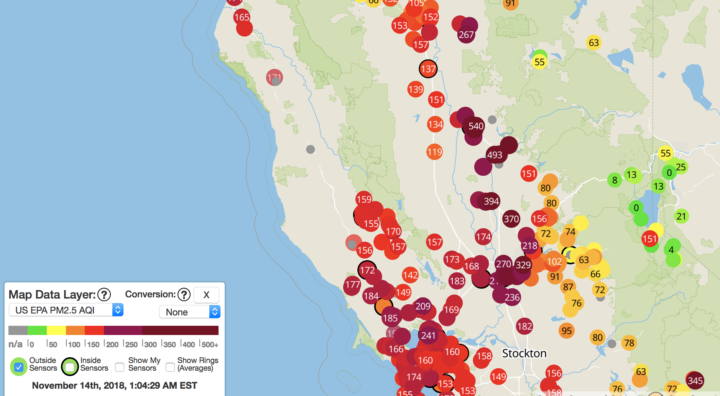
Image Credit: Purple Air
Meanwhile on the ground, atmospheric scientists Pawan Gupta, Robert Levy, Prakash Doraiswamy, and Olga Pikelnaya have been keeping a close eye on air quality data from a network of low-cost sensors distributed throughout the region. These sensors measure the mass concentration of fine particulate matter (PM2.5). Some stations measured PM2.5 values higher than 500 micrograms per cubic meter, which is about 40 times higher than the level considered safe to breathe.
#fires and #smoke in CA continue deteriorating air quality in the region – satellite images from @NASA_NPP #VIIRS #OMPS and low-cost sensor network @purpleairq shows hazardous conditions @NASA_HAQAST @NASAEarthData @iccialtopenburn @Open_AQ @R5_Fire_News @USRAedu @SanGasso pic.twitter.com/lhO08wUg4i
— Pawan Gupta (@pawanpgupta) November 11, 2018
“On November 9th, due to favorable wind direction, most of the smoke was confined to a smaller region north of San Francisco, but the wind direction changed on the 10th, and smoke spread over a much larger region,” noted Gupta, who is based at NASA’s Marshall Space Flight Center and works with NASA’s SERVIR and ARSET programs. “On the 11th and 12th, the wind direction again changed, and most of the smoke blew over the ocean.”
Gupta is involved in an ongoing effort to deploy and test low-cost commercial air quality sensors to see how well their measurements compare with standard EPA measurements and NASA satellite observations. The ground-based sensors that are part of official state and federal government observing networks cost several thousand dollars each, but the new generation of sensors cost just a few hundred dollars—cheap enough that Gupta thinks they could proliferate and potentially be used to help fill in crucial gaps, particularly in countries with few air quality sensors.
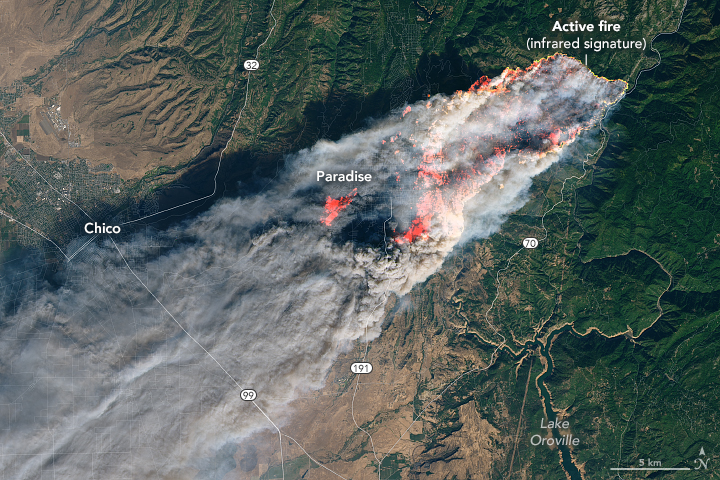
Image Credit: NASA Earth Observatory/Landsat 8/OLI
“The low-cost sensors have performed as expected, though with varying accuracy for certain types of particles,” said Gupta. “Going forward, we hope to use what we learn from them to improve the techniques scientists use to derive levels of particulate matter at the surface from the entire column aerosol measurements observed by satellites.”
So far, Gupta and his colleagues have deployed about 40 low-cost sensors in California. Next summer, they plan to add hundreds of additional sensors in New Delhi, an area that regularly gets hit with dust storms and smoke from agricultural burning. They also plan to deploy sensors in North Carolina, an area with relatively clean air.
Citizen scientists interested in air quality can get involved in the project. Gupta and colleagues from RTI International, South Coast Air Quality Management District, NASA, and other institutions are recruiting volunteers to host the low-cost sensor and share the results with the experts.
Further Reading:
Air Quality Citizen Science, Project Goals and Overview
EOS, New Strategies to Protect People from Smoke During Wildfires
KVPR, NASA’s JPL Using Fresno As A Test Bed For Air Quality Research
Geohealth, Impact of California Fires on Local and Regional Air Quality: The Role of a Low‐Cost Sensor Network and Satellite Observations
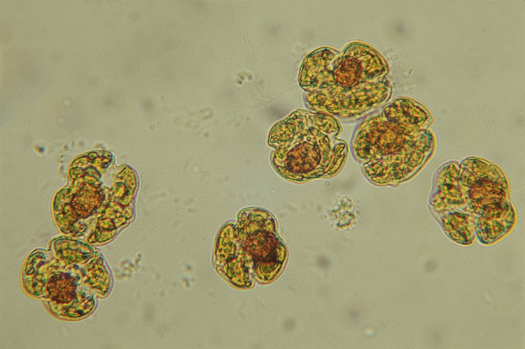
Karenia brevis cells. Image credit: Mote Marine Laboratory
Put a sample of water from the Gulf of Mexico under a microscope, and you will often find cells of Karenia brevis swimming around. The microscopic algae—the species of phytoplankton responsible for Florida’s worst red tide outbreaks—produce brevetoxin, a compound that in high concentrations can kill wildlife and cause neurological, respiratory, and gastrointestinal issues for people.
Under normal conditions, water quality tests find, at most, a few hundred K. brevis cells per liter of water—not enough to cause problems. But in August 2018, in the midst of one of the most severe red tide outbreaks to hit Florida’s Gulf Coast in a decade, water samples regularly contained more than one million K. brevis cells per liter.
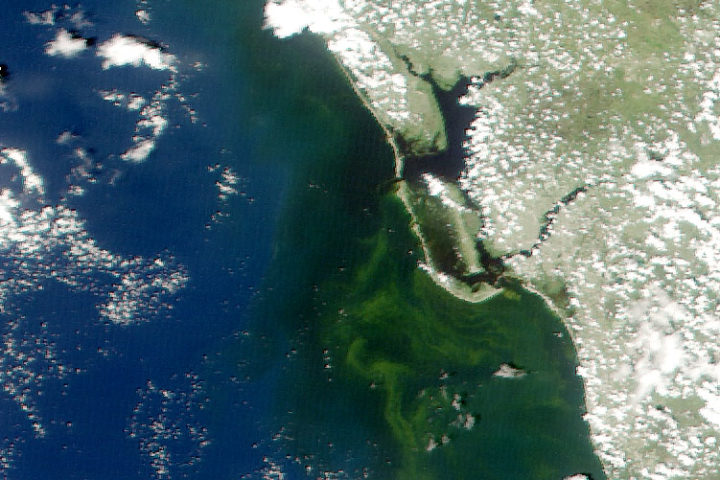
Natural-color MODIS satellite image of algae staining the water off the coast of Fort Myers on August 19, 2018. Image from the University of South Florida Near Real-Time Integrated Red tide Information System (IRIS).
That was enough to stain large swaths of coastal waters shades of green and brownish-red and leave beaches littered with rotting fish carcasses. Roughly 100 manatees, more than 200 sea turtles, and at least 12 dolphins have been killled by red tides, according to preliminary estimates. For much of August, the toxic bloom stretched about 130 miles (200 kilometers) along Florida’s Gulf coast, from roughly Tampa to Fort Myers. Though the bloom has been active since October 2017, it intensified rapidly in July 2018. The damage grew so severe and widespread that Florida’s governor declared a state of emergency in mid-August.
One of the best ways to test for the presence of K. brevis is to analyze water samples collected from boats or beaches. State environmental agencies do this on a regular basis, but understanding the full extent and evolution of fast-changing blooms, or predicting where they will move with ground sampling alone is a challenge.
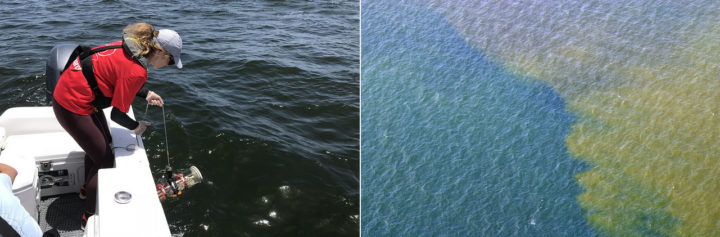
Sampling red tide in 2018 (left). An aerial view of red tide in 2005 (right). Photo credits: Florida Fish and Wildlife Conservation Commission.
That’s why key red tide monitoring systems, such as the National Oceanic and Atmospheric Administration’s (NOAA’s) Harmful Algal Bloom Forecast System and the Near Real-Time Integrated Red Tide Information System (IRIS) from the University of South Florida, make use of satellite data from the Moderate Resolution Imaging Spectroradiometer (MODIS) sensors on NASA’s Aqua and Terra satellites. These sensors pass over Florida’s Gulf Coast twice a day, acquiring data at several wavelengths that can be useful for identifying and mapping the spatial extent of algal blooms. Other satellite sensors such as the Visible Infrared Imaging Radiometer Suite (VIIRS) on Suomi NPP and the Ocean and Land Color Instrument (OCLI) on Sentinel-3 collect information that can be used to monitor red tides as well.
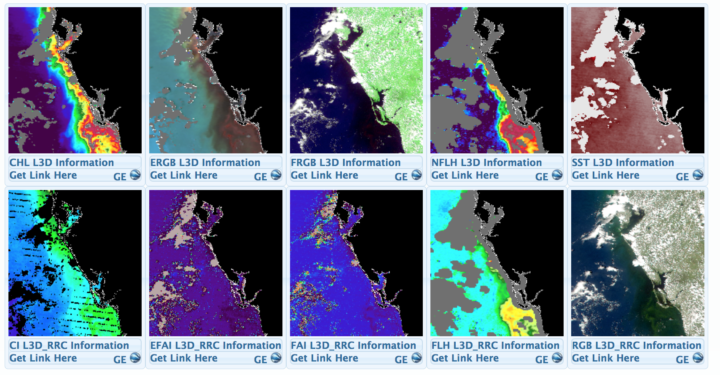
A screenshot from the University of South Florida’s Near Real-Time Integrated Red tide Information System (IRIS). The image shows various types of data captured by MODIS sensor on Terra on August 19, 2018. Solar-stimulated fluorescence data (NFLH) is particularly useful for locating algal blooms. Image Credit: USF/IRIS
Despite the utility of satellite observations, there are some significant challenges to interpreting satellite data of algal blooms in shallow, coastal waters, explained oceanographer Chuanmin Hu of the University of South Florida. Chief among them: it can be quite difficult to distinguish between algal blooms, suspended sediment, and colored dissolved organic matter (CDOM) that flows into coastal areas.
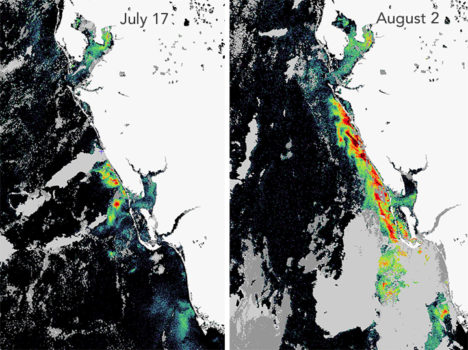
The Karenia brevis bloom expanded and intensified in late-July. This fluorescence data comes from the OCLI sensor on Sentinel 3. Image courtesy of Rick Stumpf, NOAA.
To get around this problem and make satellites better at pinpointing algal blooms, Hu and colleagues at the University of South Florida have developed a red tide monitoring system that makes use of MODIS observations of fluorescence, which algal bloom emit in response to exposure to sunlight. “If we have fluorescence data to go along with a natural-color image from MODIS, we can say with a high degree of confidence where the algal blooms are and where the sensor is just detecting sediment or CDOM,” he said. When fluorescence data is available, the Florida Fish and Wildlife Commission pushes it out to the public as part of its red tide status updates (see the August 21 update below).
Likewise, NOAA has combined a fluorescence method with a long-standing technique that identifies recent increases in chlorophyll concentration, the combination improves the identification of likely K. brevis blooms — information that then gets incorporated in NOAA’s HAB Forecast System, noted Richard Stumpf, an oceanographer with NOAA.
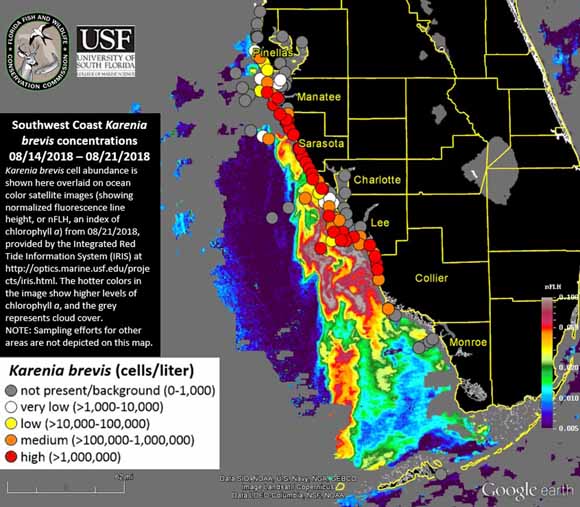
K. brevis cell abundance shown on an ocean color satellite image from the IRIS system. Warmer colors indicate higher levels of chlorophyll a, an indicator of algae. Cloudy areas are gray. Circles indicate locations where officials tested water samples on the ground. Image Credit: FFW/USF/IRIS.
However, that still leaves some big problems—only about ten percent of MODIS passes collect usable fluorescence data. The rest of the time images are marred by either sunglint or clouds. And the algorithm that scientists use to detect algal blooms with MODIS does not work well within one kilometer of the coast—the part that is of the greatest interest to beachgoers and boaters.
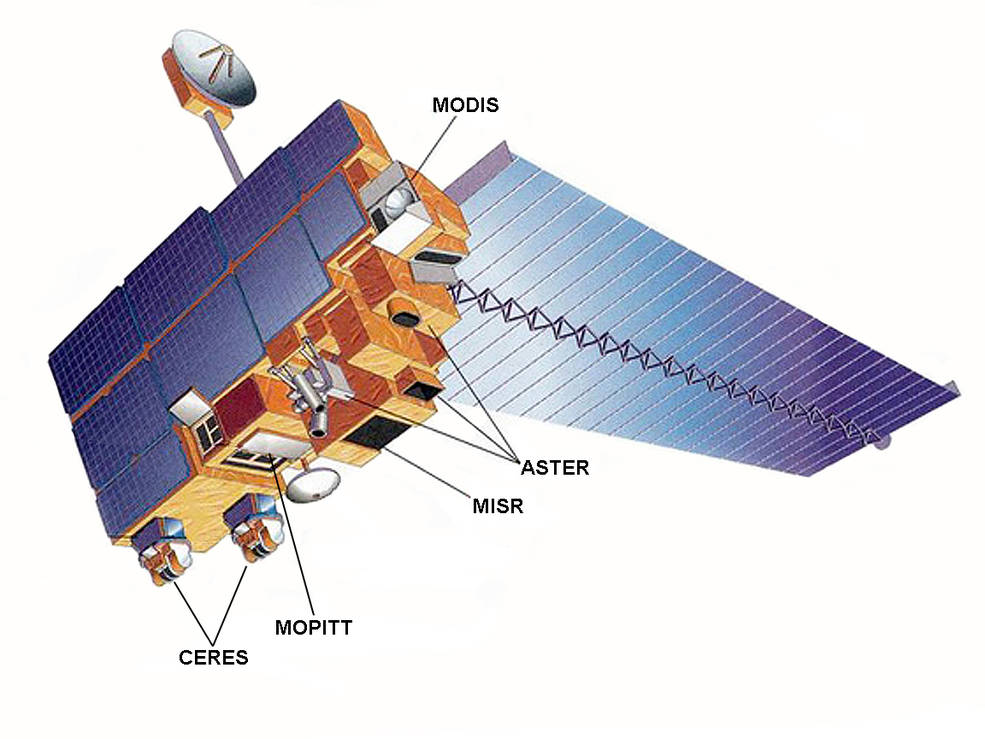
The Terra satellite. Image Credit: NASA
To help fill in the gaps, NASA’s Applied Science program is working with several partner institutions on a smartphone app called HABscope. The app, developed by Gulf of Mexico Observing System (GCOOS) researcher Robert Currier, makes it possible for trained water samplers (typically lifeguards who participate in Mote Marine Laboratory’s Beach Conditions Reporting System) to collect video of water using microscopes attached to their smartphones.
After recording, HABscope uploads videos to a cloud-based server for automatic analysis by computer software. The software rapidly counts the number of K. brevis cells in a water sample by using technology similar to that found in facial recognition apps. But rather than focusing on facial features, the software looks for a particular pattern in the movement of K. brevis cells.
K. brevis are vigorous swimmers, often using a pair of long, whip-like flagella to migrate vertically about 10 to 20 meters (33 to 66 feet) each day. They chart a zig-zagging, corkscrew-shaped path that allows the software to easily pick them out amidst the cast of other phytoplankton found in Gulf of Mexico water samples.
The data about K. brevis abundance at various locations along the coast is then fed into a respiratory distress forecasting tool managed by NOAA. “Respiratory distress forecasts can now be produced 1 to 2 times per day for specific beaches along the Florida Gulf Coast,” said Stumpf. “Previous to this project, these forecasts were issued at most twice a week, and only as general statements about risk within a county. The combination of earth observations with rapid field monitoring will increase the accuracy and usefulness of the forecasts.”
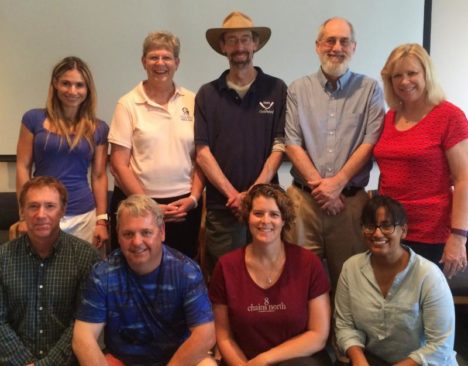
The research team that developed the HABscope app included oceanographers, ecologists, computer application developers, and public health experts. Photo Credit: Mote Marine Laboratory.
