
Usually, comic book heroes wear tight pants and have superhuman strength. In the new educational manga Raindrop Tales from NASA, one of the heroes (Mizu-chan) evaporates water with her hair. The other (GPM) rides on a 3,900-kilogram satellite that observes rain and snow.
Look carefully at the art in the screenshots above, and you will find some telling details. Mizu-chan wears a flowing blue dress that symbolizes the many forms of water (snow, ice, rain, hail, water vapor, fresh water, salt water, etc.) found on Earth. Notice how her hemline is surrounded by clouds. Depending on her mood, the clouds form different types of precipitation.
GPM—named after the Global Precipitation Measurement mission—has blond hair and wears a kimono with a rain pattern on one half and a snow pattern on the other. Though he rides atop the GPM Core Observatory, that does not mean he has free reign over the satellite. Read the full comic to find out how GPM deals with meddlesome managers on the ground and what happens when he meets a diverse cast of characters in space.
The new manga is the culmination of an anime challenge sponsored by GPM’s education and outreach team. They made a call to artists from around the world to develop anime-themed comic book characters that could be used to teach students about the mission. Yuki Kiriga of Tokyo developed the GPM character; Sabrynne Buchholz of Colorado developed Mizu-chan. See some of their winning artwork below.

After finishing the manga, you may want to learn more about water. If so, try this story about the water cycle. “Viewed from space, one of the most striking features of our home planet is the water, in both liquid and frozen forms, that covers approximately 75 percent of the Earth’s surface,” the story begins.

The vast majority (about 96.5 percent) of that water, of course, fills the oceans. As for the rest of it, approximately 1.7 percent of Earth’s water is stored in the polar icecaps, glaciers, and permanent snow; another 1.7 percent is stored in groundwater, lakes, rivers, streams, and soil.
Only .001 percent of the water on Earth exists as water vapor in the atmosphere. But that tiny fraction is what GPM sees the best. To get a sense of the data GPM is collecting on a routine basis, see this story about the devastating rains that struck South Carolina in October 2015.
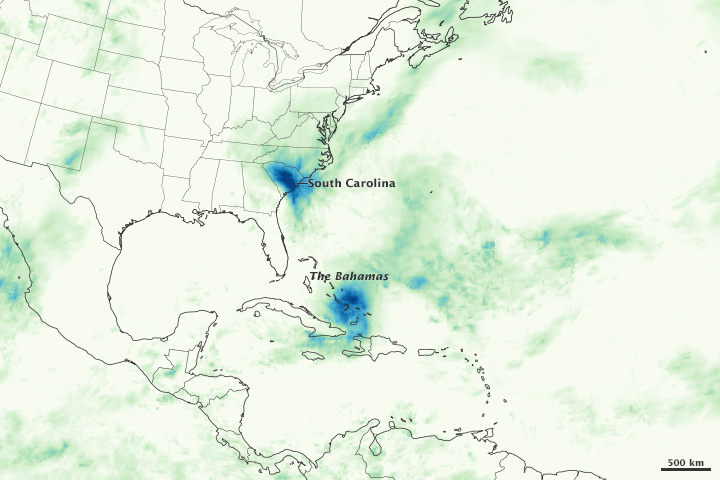
Every month on Earth Matters, we offer a puzzling satellite image. The October 2015 puzzler is above. Your challenge is to use the comments section to tell us what part of the world we are looking at, when the image was acquired, what the image shows, and why the scene is interesting.
How to answer. Your answer can be a few words or several paragraphs. (Try to keep it shorter than 200 words). You might simply tell us what part of the world an image shows. Or you can dig deeper and explain what satellite and instrument produced the image, what spectral bands were used to create it, or what is compelling about some obscure speck in the far corner of an image. If you think something is interesting or noteworthy, tell us about it.
The prize. We can’t offer prize money, but, we can promise you credit and glory (well, maybe just credit). Roughly one week after a puzzler image appears on this blog, we will post an annotated and captioned version as our Image of the Day. In the credits, we’ll acknowledge the person who was first to correctly ID the image. We’ll also recognize people who offer the most interesting tidbits of information about the geological, meteorological, or human processes that have played a role in molding the landscape. Please include your preferred name or alias with your comment. If you work for or attend an institution that you want us to recognize, please mention that as well.
Recent winners. If you’ve won the puzzler in the last few months or work in geospatial imaging, please sit on your hands for at least a day to give others a chance to play.
Releasing Comments. Savvy readers have solved some of our puzzlers after only a few minutes or hours. To give more people a chance to play, we may wait between 24-48 hours before posting the answers we receive in the comment thread.
Good luck!
For nearly 20 years, Jim Acker, a contract support scientist at the NASA Goddard Earth Science Data and Information Services Center (GES DISC), has helped oceanographers compile and study data collected by satellites. A chemical oceanographer by training, he has been involved in the study of ocean color as viewed from space. He recently wrote a book for NASA about the history of the subject. He is also scheduled to deliver the NASA Goddard Science Colloquium on September 30 at 3:30 p.m. His talk is entitled: “Rise of the Machines: Computational Power and the History of NASA’s Ocean Color Missions.” He gave us a preview of the book and the talk this week.
NASA Earth Observatory: Most of us think of the ocean as blue; in some places, it looks green. So what do scientists mean when they refer to “ocean color?”

Jim Acker: Well, it’s blue and green and brown, and occasionally a few other related hues. Ocean color refers to the science of using satellite sensors to measure the light emanating from the ocean and determining what is in the water based on those light measurements. The main things that change the color of the ocean are phytoplankton—the floating plants at the base of the ocean food chain—dissolved colored substances, and different kinds of sediments.
EO: What are some of the things we have learned by looking at the ocean from satellites?
Acker: One of the main things done with global observations has been estimating how much carbon is produced by the growth of phytoplankton. Ocean color observations have shown how much this can vary, particularly with events like El Niño or La Niña in the Pacific Ocean.
The satellite view also can show how much variation there is over relatively short distances. A ship could be sitting in nice clear water, and just a few tens of kilometers away there could be a strong phytoplankton bloom that they would never know about without observations from space.

The observations also have helped understand phytoplankton patterns in hard-to-reach places like the polar seas and the Red Sea or Arabian Sea. The interaction of the land and ocean, with weather patterns and river inflows, has also been better observed.
EO: Have there been any big surprises?
Acker: Definitely. One of the biggest surprises from the Coastal Zone Color Scanner, the first NASA ocean color mission, was truly how much the ocean varied over small distances. Where oceanographers used to draw simple lines, they realized there were swirls and spirals and curlicues and loops and jets and rings. It was much more complicated.
Another surprise when SeaWiFS and MODIS started making global observations was how cloudy it is over the oceans. It takes really impressive data processing to get accurate values because of that.

And because the satellites make continuous observations, they have observed many different features that weren’t where we expected them to be or they happened more often than we thought.
EO: What provoked you to write a book?
Acker: NASA wanted to have some histories of NASA science, and I wanted to tell the history of ocean color because it’s been so successful. It’s like a well-trained, elite athlete: they make what they do look easy, though a lot of hard effort and training makes that possible.

Ocean color measurements are very difficult to make, but because the missions have been so successful, the public and even most scientists have just seen the beautiful results and have not realized the dedicated, behind-the-scenes work that made them possible. It isn’t just about seeing images from space on a computer monitor. To be sure the data is accurate, there have been some true high-seas adventures. I was able to get a lot of real-life experiences from the scientists and engineers into the book.
EO: What is your favorite book about science? And your favorite writer?
Acker: My favorite book that was sort of about science was The Map that Changed the World by Simon Winchester; I also enjoyed his book about the eruption of Krakatoa. My favorite writers are Pat Conroy and J.R.R. Tolkien. The late Stephen Jay Gould wrote a lot of things about science I liked. And I have to mention that I just read Andy Weir’s The Martian and was quite impressed. I’m looking forward to seeing the movie.

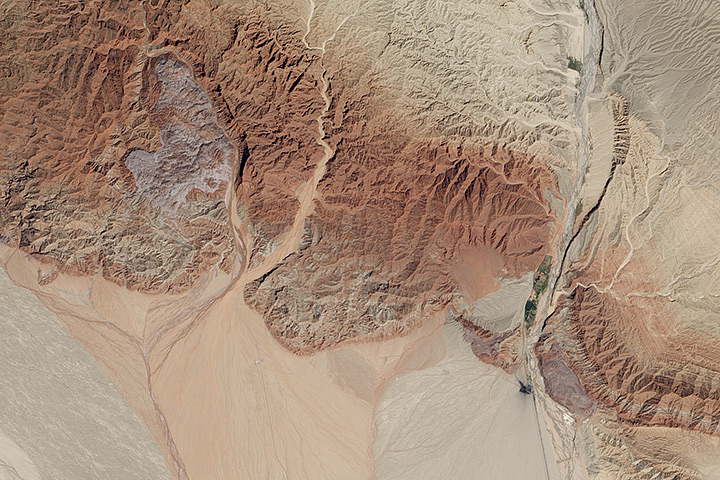
Every month on Earth Matters, we offer a puzzling satellite image. The September 2015 puzzler is above. Your challenge is to use the comments section to tell us what part of the world we are looking at, when the image was acquired, what the image shows, and why the scene is interesting.
How to answer. Your answer can be a few words or several paragraphs. (Try to keep it shorter than 200 words). You might simply tell us what part of the world an image shows. Or you can dig deeper and explain what satellite and instrument produced the image, what spectral bands were used to create it, or what is compelling about some obscure speck in the far corner of an image. If you think something is interesting or noteworthy, tell us about it.
The prize. We can’t offer prize money, but, we can promise you credit and glory (well, maybe just credit). Roughly one week after a puzzler image appears on this blog, we will post an annotated and captioned version as our Image of the Day. In the credits, we’ll acknowledge the person who was first to correctly ID the image. We’ll also recognize people who offer the most interesting tidbits of information about the geological, meteorological, or human processes that have played a role in molding the landscape. Please include your preferred name or alias with your comment. If you work for or attend an institution that you want us to recognize, please mention that as well.
Recent winners. If you’ve won the puzzler in the last few months or work in geospatial imaging, please sit on your hands for at least a day to give others a chance to play.
Releasing Comments. Savvy readers have solved some of our puzzlers after only a few minutes or hours. To give more people a chance to play, we may wait between 24-48 hours before posting the answers we receive in the comment thread.
Good luck!
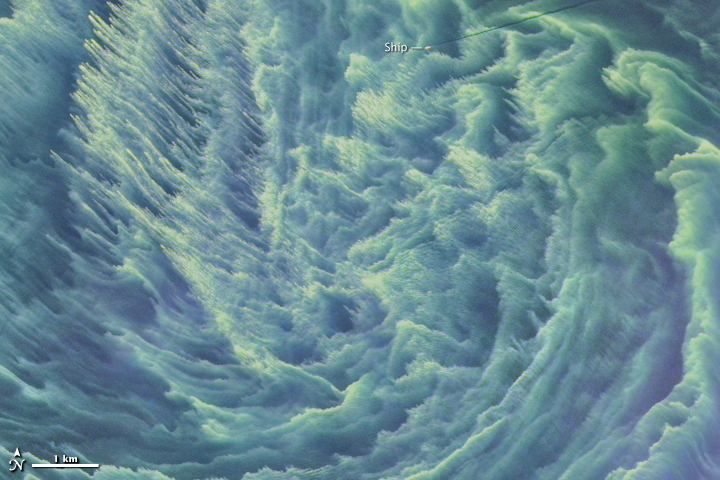
When I first saw the image for the August puzzler, I was struck by its beauty. The blue-green swirls look like they could be the brush strokes of an impressionist painting. Instead, this false-color scene was acquired by the Operational Land Imager (OLI) on Landsat 8.
Without any land visible in the scene, I thought it would be at least a day or two before receiving a correct guess. I was wrong. Congratulations to Helen Macintyre who was the first to correctly post a correct answer to the blog on August 18, just 94 minutes after the puzzler was posted.
Macintyre wrote, “Initially I thought hurricane, but the strands in the upper left seem too sharp and thin. I think this is an algal bloom swirling in ocean currents. The line near the top I think is a large ocean liner cutting through this, leaving a darker colored wake.”
Indeed, the scene shows a phytoplankton bloom. This particular bloom contains cyanobacteria—an ancient type of marine bacteria that, like other phytoplankton, capture and store solar energy through photosynthesis.
Later that same day, Kari Nöjd posted a comment and became the first to correctly guess the phenomenon and its location. In fact, Nöjd was the only participant to correctly place this bloom in the Baltic Sea. Excellent work!
Nöjd wrote, “My guess is that this picture shows sea surface where algae is blooming. The line is from the boat, which is driving through the sea surface. Picture could have been taken from the Baltic Sea where has been big algae blooming fields forming for the past month … Unfortunately this is also effect of a human behavior. Nutrients from fields and waste waters increase the algae blooming.”
According to NASA oceanographer Norman Kuring, major cyanobacteria blooms like this one appear in the Baltic Sea nearly every summer, “and they always look like this in the satellite data.” Physical measurements from an expert in the field, however, were required to confirm that the bloom was cyanobacteria.
As for the line cutting through the scene? Yes, that’s the result of a ship cruising through the bloom. There are other ships too, as well as an airplane, visible in the zoomed-out version posted in our August 23, 2015, Image of the Day.
On Facebook, Scot Hoffman was the first to guess algae bloom. In fact, a lot of comments on Facebook noted that the scene was a bloom, but the location remained elusive. Many thought it might be Lake Erie—a good guess because blooms are visible during the summer in that lake as well.

Every month on Earth Matters, we offer a puzzling satellite image. The August 2015 puzzler is above. Your challenge is to use the comments section to tell us what part of the world we are looking at, when the image was acquired, what the image shows, and why the scene is interesting.
How to answer. Your answer can be a few words or several paragraphs. (Try to keep it shorter than 200 words). You might simply tell us what part of the world an image shows. Or you can dig deeper and explain what satellite and instrument produced the image, what spectral bands were used to create it, or what is compelling about some obscure speck in the far corner of an image. If you think something is interesting or noteworthy, tell us about it.
The prize. We can’t offer prize money, but, we can promise you credit and glory (well, maybe just credit). Roughly one week after a puzzler image appears on this blog, we will post an annotated and captioned version as our Image of the Day. In the credits, we’ll acknowledge the person who was first to correctly ID the image. We’ll also recognize people who offer the most interesting tidbits of information about the geological, meteorological, or human processes that have played a role in molding the landscape. Please include your preferred name or alias with your comment. If you work for or attend an institution that you want us to recognize, please mention that as well.
Recent winners. If you’ve won the puzzler in the last few months or work in geospatial imaging, please sit on your hands for at least a day to give others a chance to play.
Releasing Comments. Savvy readers have solved some of our puzzlers after only a few minutes or hours. To give more people a chance to play, we may wait between 24-48 hours before posting the answers we receive in the comment thread.
Good luck!

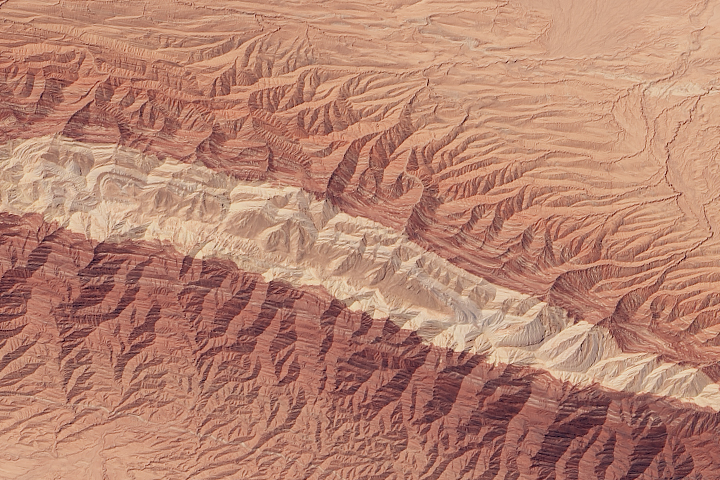
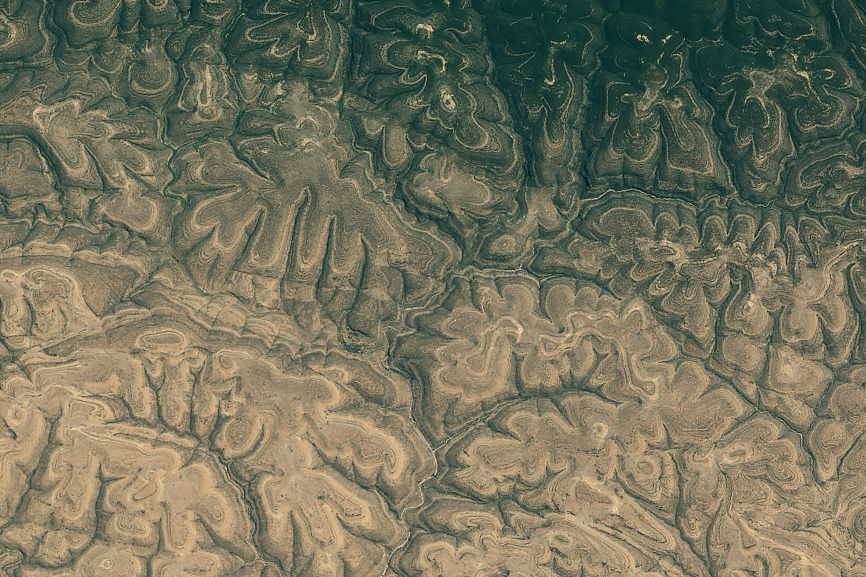
This image was acquired on June 27, 2015, by the Operational Land Imager on Landsat 8. Read more about the image here.
What was that brain-like pattern featured in our July puzzler and how did it form? The key insight—which none of the hundreds of readers who commented mentioned—was that the pattern was caused by a network of stream valleys and bands of vegetation that follow the contour of the hills. (Read our July 26 Image of the Day to find out why the vegetation grows in bands.) However, reader Stephanie Wurdinger did nail the location on both Facebook and our Earth Matter blog. “This is along the north coast of Somalia between Dayaha and Maydh, in Sanaag region. Mt Shimbiris is just off the upper right hand corner of this image. I believe it is part of the Maydh greenstone belt,” she wrote.
One of the more interesting things about the forests of the Cal Madow is that they are important sources of frankincense and myrrh, the fragrant resins made famous by the Biblical account of three kings bringing them to Bethlehem as gifts. For a more modern take on the frankincense and myrrh trade, check out the video put together by the the Institute for Environmental Diplomacy and Security at the University of Vermont. Skip ahead to mintute 2:30 to join the producers as they bump over rough mountain roads in Somaliland looking for frankincense. The same organization has posted a report about the frankincense industry in Somaliland with many more details.
Every month on Earth Matters, we offer a puzzling satellite image. The July 2015 puzzler is above. Your challenge is to use the comments section to tell us what part of the world we are looking at, when the image was acquired, what the image shows, and why the scene is interesting.
How to answer. Your answer can be a few words or several paragraphs. (Try to keep it shorter than 200 words). You might simply tell us what part of the world an image shows. Or you can dig deeper and explain what satellite and instrument produced the image, what spectral bands were used to create it, or what is compelling about some obscure speck in the far corner of an image. If you think something is interesting or noteworthy, tell us about it.
The prize. We can’t offer prize money, but, we can promise you credit and glory (well, maybe just credit). Roughly one week after a puzzler image appears on this blog, we will post an annotated and captioned version as our Image of the Day. In the credits, we’ll acknowledge the person who was first to correctly ID the image. We’ll also recognize people who offer the most interesting tidbits of information about the geological, meteorological, or human processes that have played a role in molding the landscape. Please include your preferred name or alias with your comment. If you work for or attend an institution that you want us to recognize, please mention that as well.
Recent winners. If you’ve won the puzzler in the last few months or work in geospatial imaging, please sit on your hands for at least a day to give others a chance to play.
Releasing Comments. Savvy readers have solved some of our puzzlers after only a few minutes or hours. To give more people a chance to play, we may wait between 24-48 hours before posting the answers we receive in the comment thread.
Good luck!
This is a cross-post from Laura Rocchio and our colleagues at NASA’s Landsat Science Team.
The European Space Agency’s Sentinel-2A successfully launched into orbit on June 22, 2015, from Europe’s Spaceport in Kourou, French Guiana, aboard a Vega rocket (10:52 p.m. local time; 01:52 GMT).
The Sentinel-2A satellite has spectral bands similar to Landsat 8’s (excluding the thermal bands of Landsat 8’s Thermal Infrared Sensor). The placement of the Sentinel-2A bands, as compared to Landsat 8 and Landsat 7 bands, can be seen in the graphic below.
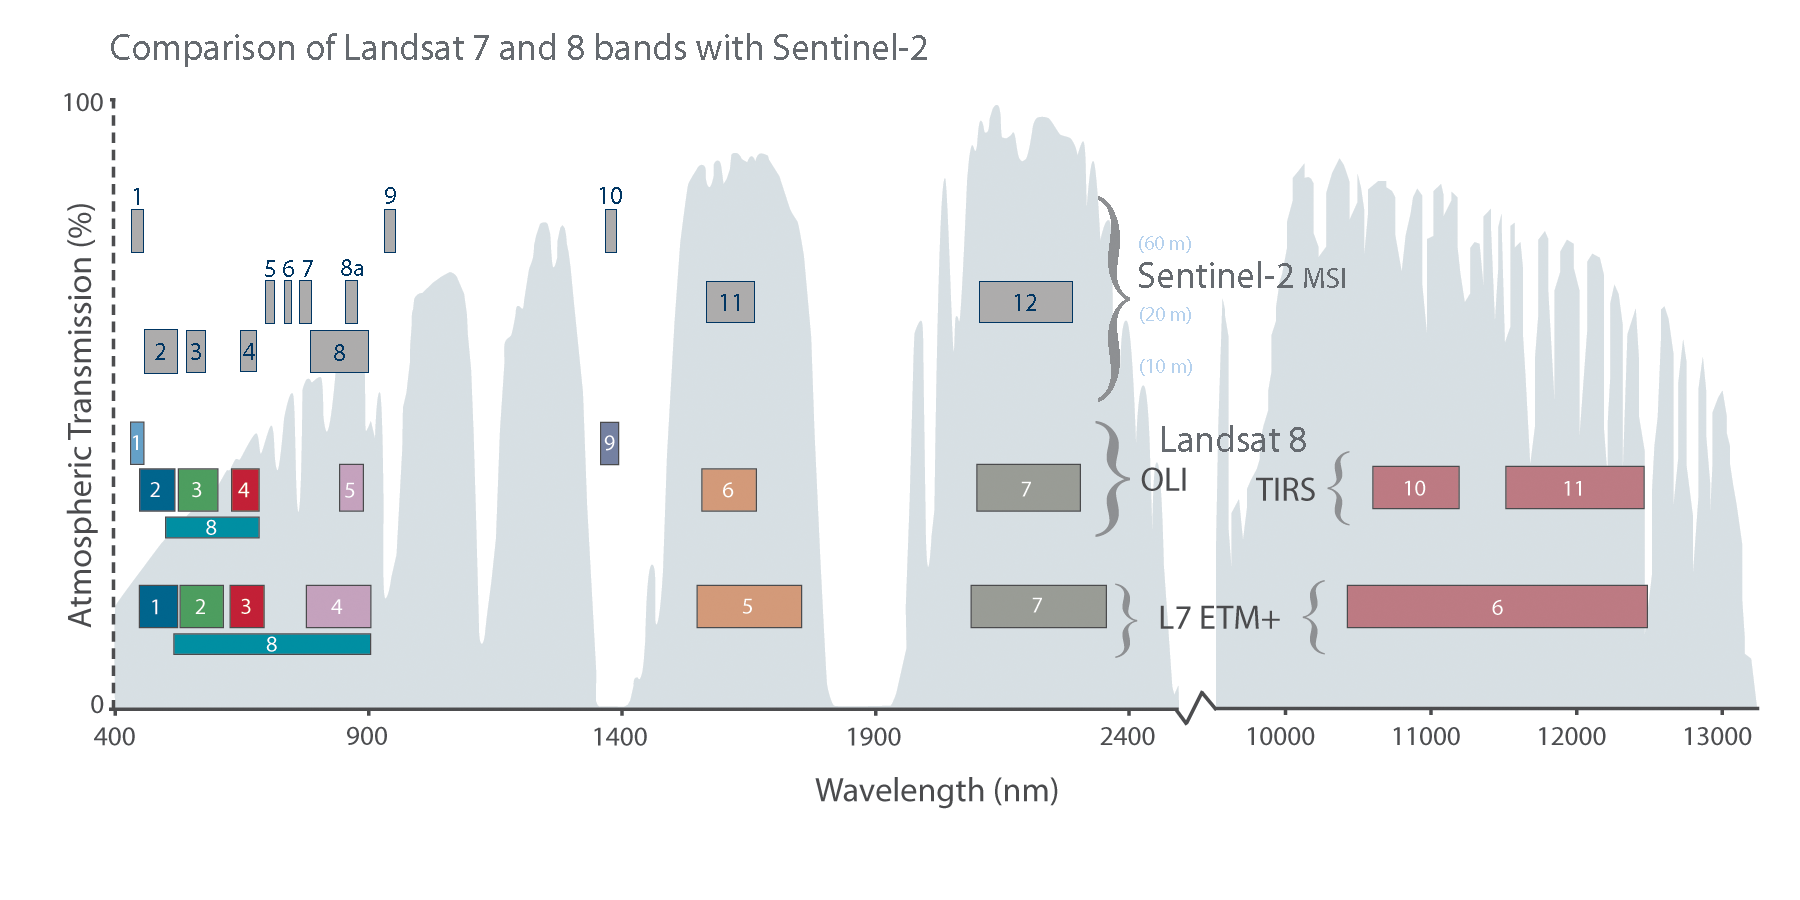
The main visible and near-infrared Sentinel-2A bands have a spatial resolution of 10 meters, while its “red-edge” (red and near-infrared bands)—specifically designed to monitor vegetation—along with its two shortwave infrared bands have a 20-meter spatial resolution, and its coastal/aerosol, water vapor, and cirrus bands have a 60-meter spatial resolution.
During the development of Landsat 8 and Sentinel-2A, calibration scientists from both projects worked together to cross-calibrate the sensors. Many scientists and researchers are looking forward to collectively using data from Landsat 8 and Sentinel-2A.
Sentinel-2A alone provides 10-day repeat coverage of Earth’s land areas. In combination with the 8-day coverage from Landsat 7 and 8 combined, users can look forward to better-than-weekly coverage at moderate resolution. Repeat coverage capabilities will further increase with the planned launch of a second Sentinel-2 satellite (Sentinel-2B) in 2016.
According to ESA, “As well as monitoring plant growth, Sentinel-2 will be used to map changes in land cover and to monitor the world’s forests. It will also provide information on pollution in lakes and coastal waters. Images of floods, volcanic eruptions and landslides will contribute to disaster mapping and helping humanitarian relief efforts.”
After the successful Sentinel-2A launch, Dr. Garik Gutman, the NASA Land Use / Land Cover Change program manager, said, “We are looking forward to new exciting data to complement Landsat observations and to collaborative research—especially because ESA followed USGS in its open data policy.” This sentiment is echoed by many in the Landsat community.
Read more about Sentinel 2A by clicking here.
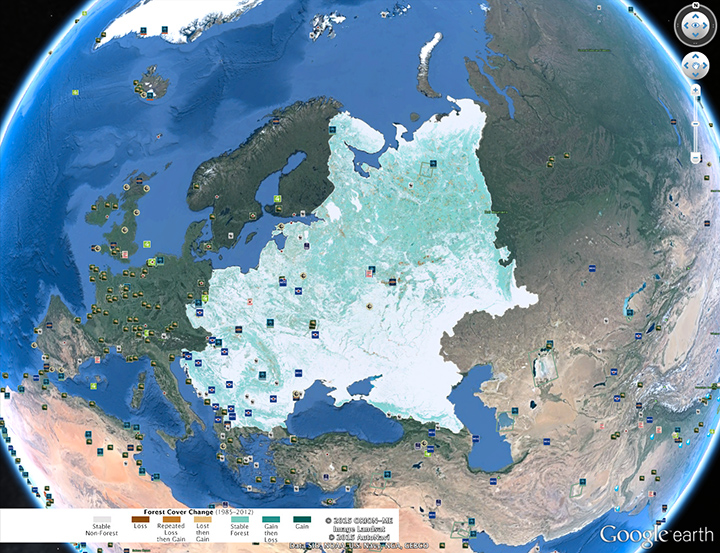
Our July 16 Image of the Day—Changing Forest Cover Since the Soviet Era—features a Landsat-derived map showing how forests have changed in Eastern Europe since 1985. After exploring the three areas we highlighted, I highly recommend browsing the map at full resolution using either Google Earth or GigaPan. The amount of detail you will find is extraordinary. There are dozens of other interesting forest loss and gain hot spots that we could have highlighted. In fact, we may publish additional stories using these data, so please let us know if you are aware of local stories of forest change in eastern Europe that deserve more attention.
While the satellite maps offer invaluable “big picture” perspective, ground photographs really bring the changes to life. Peter Potapov, the University of Maryland scientist who led the mapping effort, passed along a few photographs taken during his field research in Russia. It is one thing to know that a brown pixel in the maps indicate forest loss and the a green pixel indicates gain. It becomes real when you can actually see charred trunks after a forest fire or stands of saplings springing up in abandoned Soviet farm fields.
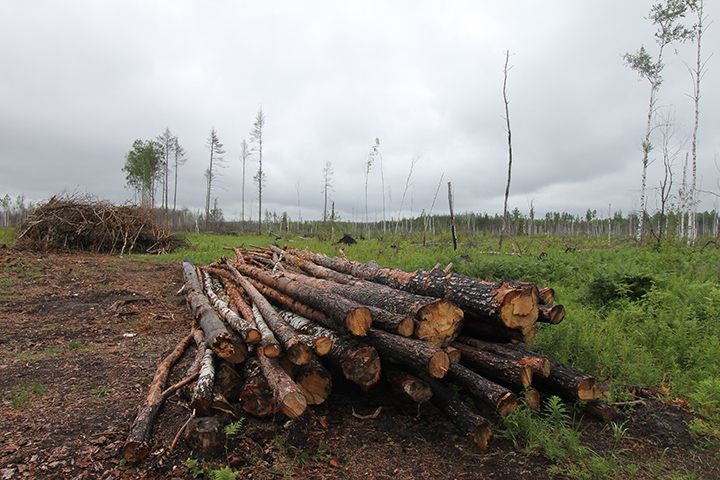
Logging site in the Vladimir region of Russia. Photo Credit: Peter Potapov.
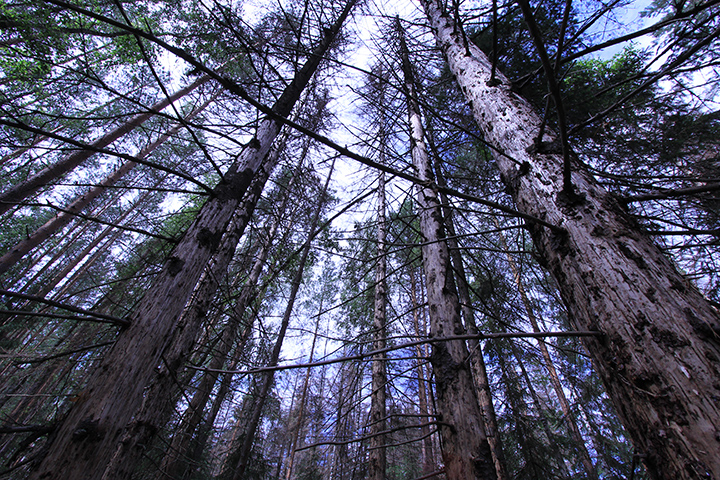
Spruce trees killed by bark beetle in the Vladimir region of Russia. Photo Credit: Peter Potapov.

Charred trunks caused by a forest fire in the Vladimer region of Russia. Photo credit: Peter Potapov
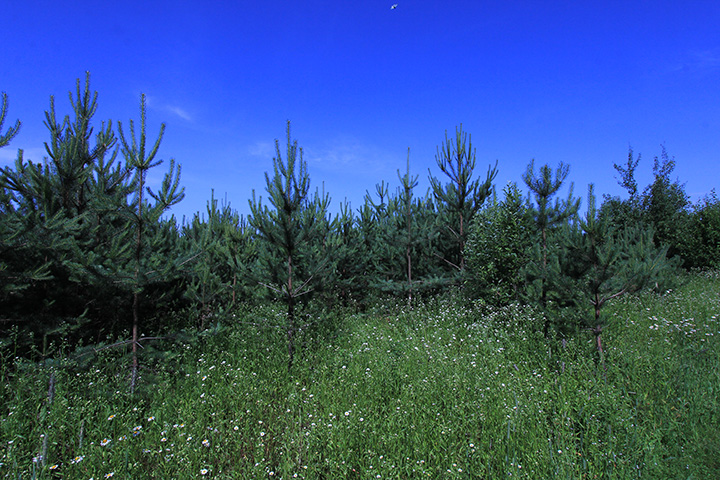
Pine forests in an abandoned pasture in the Vladimir region of Russia. The pine trees are about ten years old. Photo Credit: Peter Potapov.

Birch forest growing on abandoned farmland in the Nizhny Novgorod region of Russia. Photo Credit: Peter Potopov
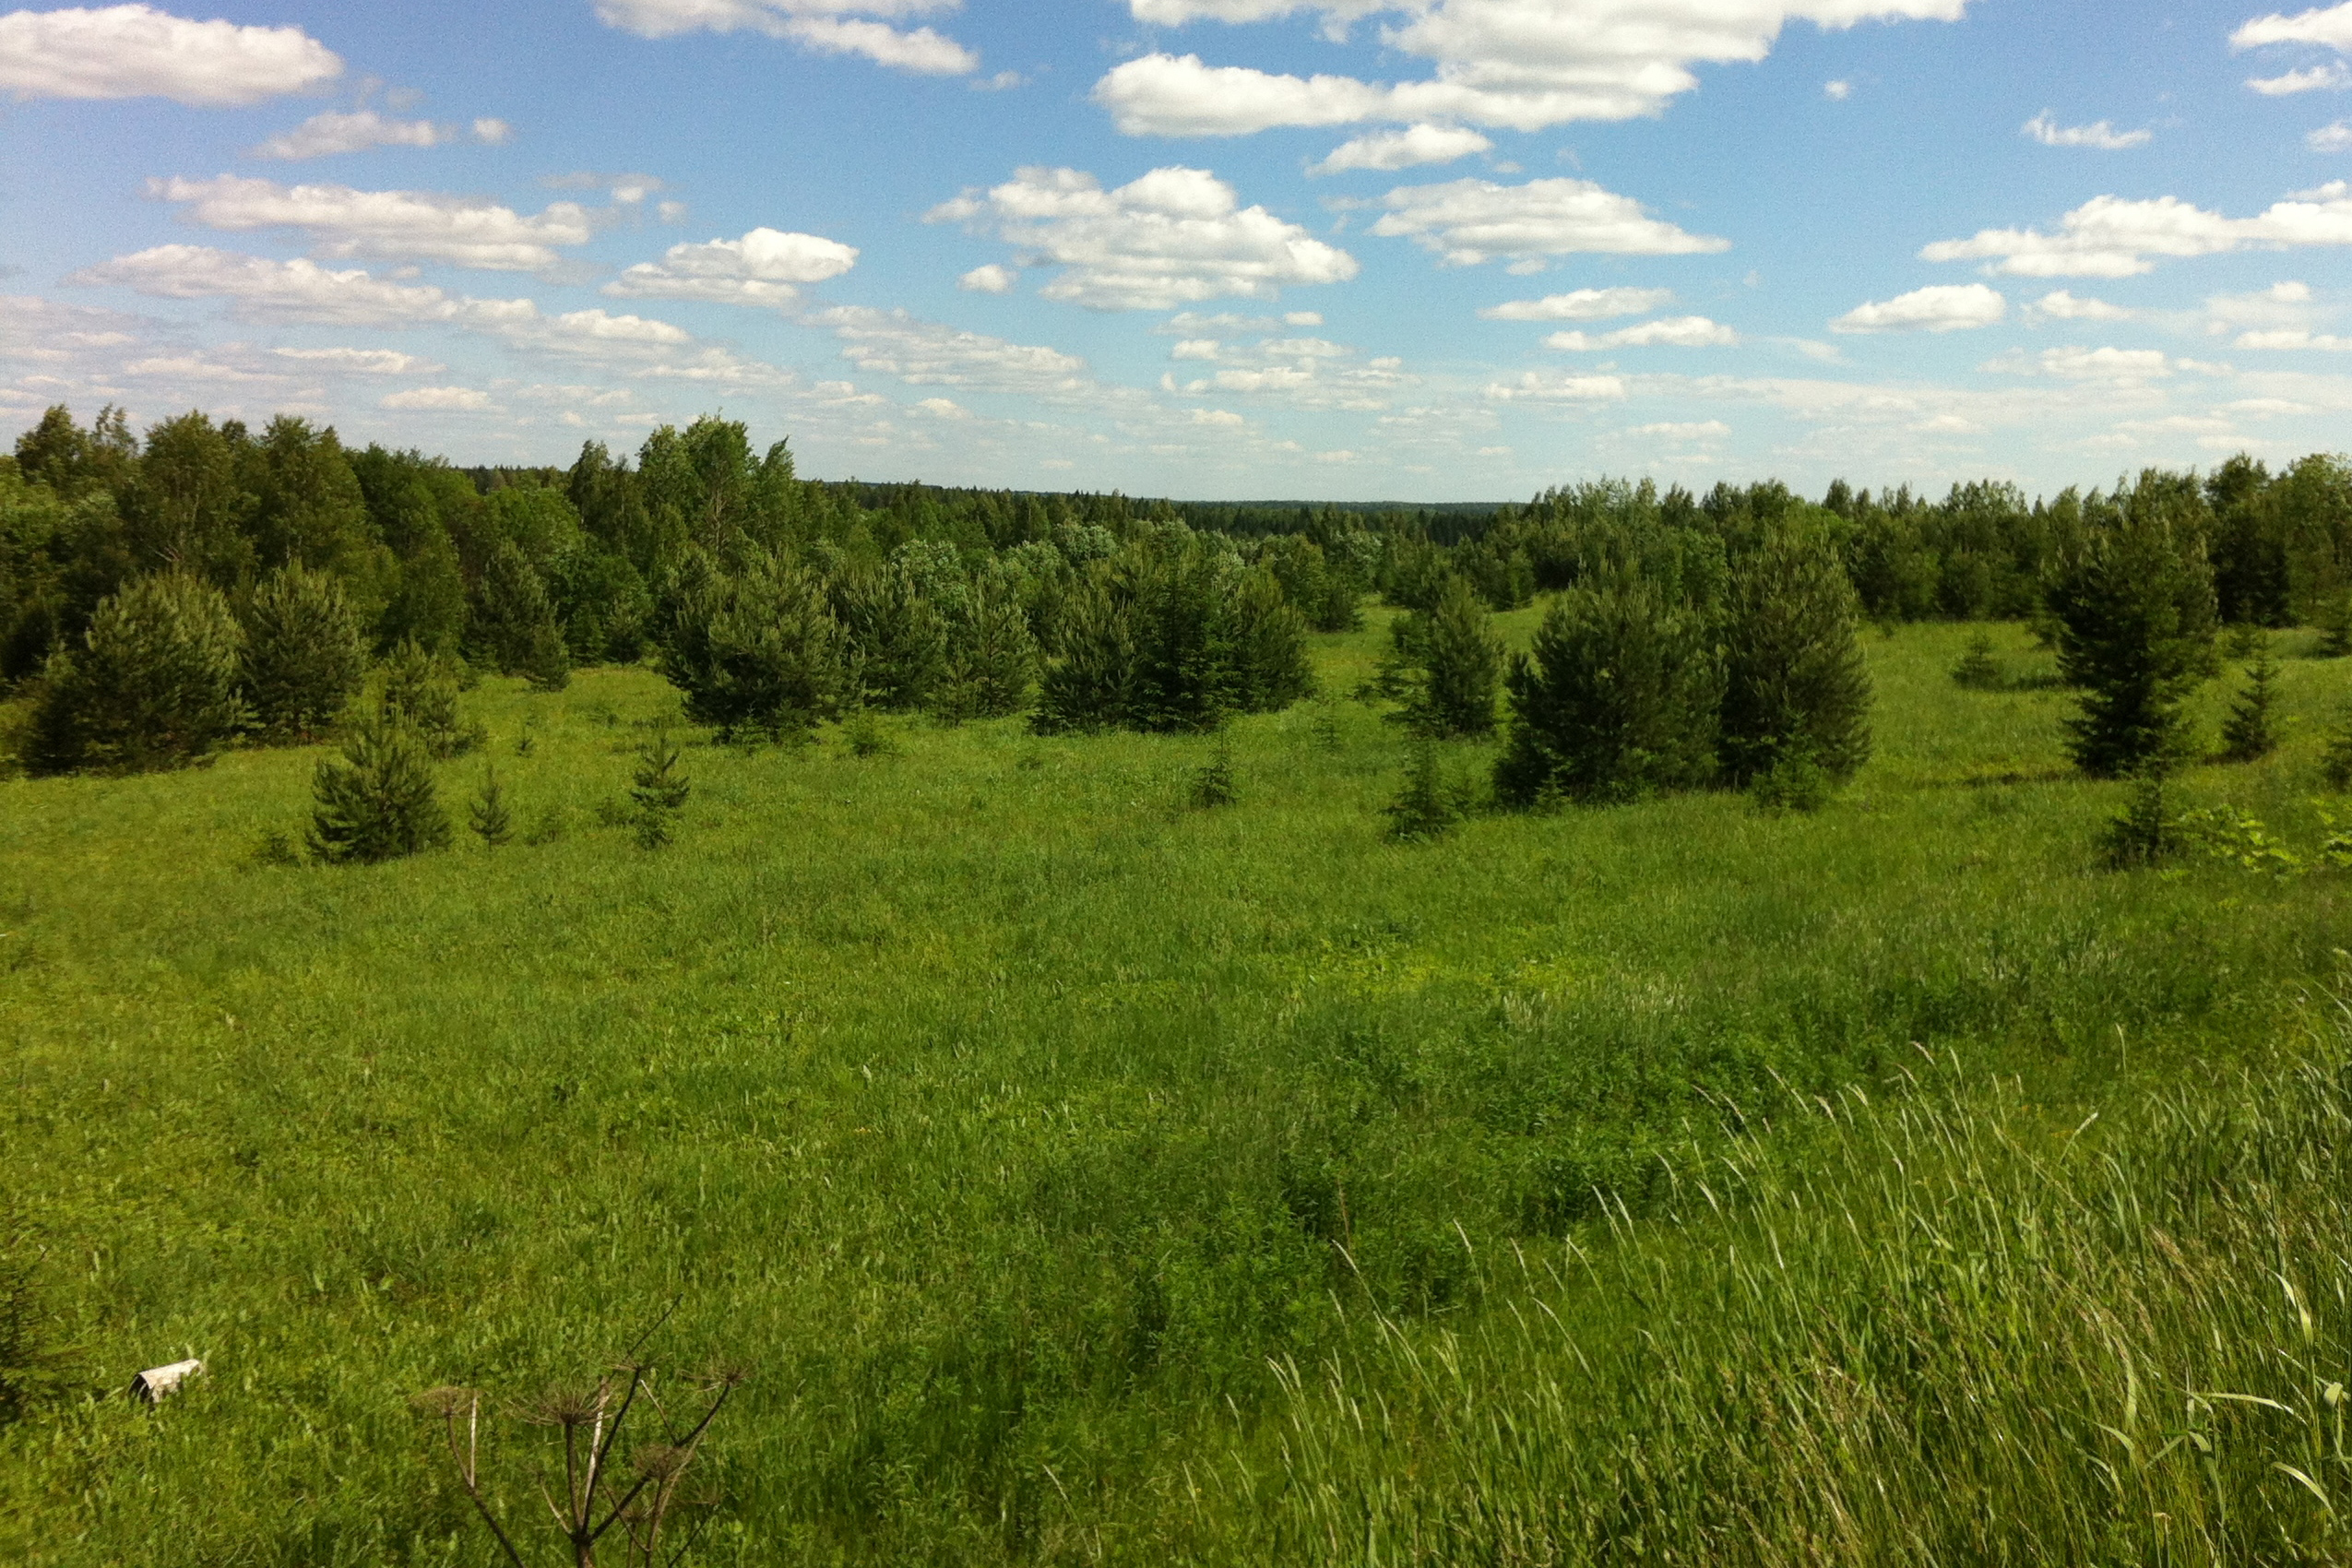
Early stages of forest recovery in abandoned farmland in the Kirov region of Russia. Photo Credit: Peter Potapov
