[youtube HTAZue6ylZ8]
Study: Quickening Water Cycle Fueling Extreme Weather
There’s been no shortage of extreme weather in recent years, from flooding in Australia to record-breaking temperatures in North America to wildfires in Russia. A new study published in Science argues that at least some of the blame should go to global warming for accelerating the water cycle. By measuring changes in the salinity of the ocean’s surface, the authors conclude that the water cycle has sped up by 4 percent over the last half century. The research is based on data from ships and a network of floating Argo sensors, not satellite data. However, NASA’s newly-launched Aquarius satellite will likely provide better global salinity estimates in the coming years. In other extreme weather news, a new poll found that two-thirds of Americans believe global warming is exacerbating severe weather and a new video (above) from the Yale Forum on Climate Change tackles the subject as well.
Welcome to the Earth-observing Club, Risat-1
On April 26, India’s space agency successfully launched Risat-1, an Earth-observing satellite carrying a synthetic aperture radar system. Though it’s been called a spy satellite, Risat-1 will more likely be used to monitor the health of forests and agriculture and to predict natural disasters, according to Space Daily. Risat’s radar is capable of collecting images in all weather conditions and can “see” through tropical clouds and rain showers; it can also image the Earth at night. India currently has 11 Earth-observing satellites in orbit. The Canadian RADARSAT SAR, Europe’s Envisat (which recently went AWOL), and the Space Shuttle have flown similar instruments in the past.
Helmets for Severe Weather Week?
Around this time last year, fierce storms barreled through the central and southern United States, spawning more than 300 tornadoes that took hundreds of lives. This year, tornadoes have already killed 63 people (more than 100 tornadoes ripped through several Plains states just a few weeks ago), but tornado season hasn’t even hit its peak yet. Due to a lack of data, it’s up for debate whether climate change is fueling such outbreaks. Regardless of the cause, NOAA and FEMA are sponsoring the first ever severe weather preparedness week in an effort to limit the death toll of future storms. Meanwhile, NPR ran an interesting story that questions why the Centers for Disease Control and Prevention recommends people use their hands rather than helmets to protect their heads during twisters.
Study Suggests Chinese Dam and Earthquake are Linked
 A disastrous 7.9 earthquake struck Wenchuan, China, in 2008, killing 80,000 thousand people. Ever since, many scientists have wondered whether the quake may have been triggered by the construction of nearby Zipingpu Dam, which put 900 million tons of water on top of the fault that was at the epicenter of the quake. Some scientists believe the pressure from the reservoir could have pushed water into the fault, lubricating and weakening it enough to cause it to slip. Though the topic remains controversial, a new article in Science reviews new evidence that suggests the dam and earthquake were linked.
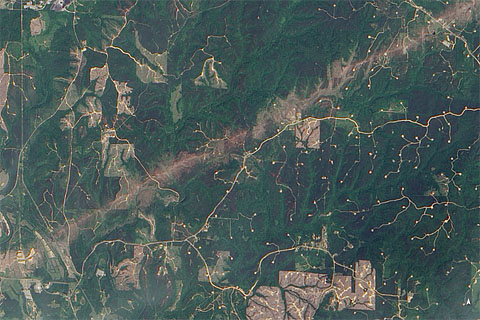
Nepal Gets a New Tool for Monitoring Wildfires
In the last few days, hundreds of fires have burned across the southern belt of the Hindu-Kush Himalayan region. The MODIS instrument on NASA’s Aqua satellite captured this view of the burning on April 24. Should you be interested in monitoring Nepalese wildfires, the International Center Integrated Mountain Development just released a pilot version of a new monitoring system based on MODIS data. Go here to check it out.
Next Stop: The Arctic Circle
Operation IceBridge, NASA’s multi-year mission that maps polar ice, has passed the mid-point of its current mission to the Arctic. You can visit this page for more details and follow along on the IceBridge blog.
[youtube i_11HEGHLAk]
Note: Click on the images for larger views and crediting information.

Global Warming and Whipsaw Weather
Perhaps you’ve noticed that we’ve had a record-shattering heat wave across much of North America in recent months, whereas Europe and Asia have experienced an unusually cold winter. That’s to be expected according to a new report on extreme weather published by the Intergovernmental Panel on Climate Change. The report points out that it’s “very likely” that we’ve seen an overall increase in both cold and warm days (and nights) since 1950 due to global warming. Another recent study, published in Nature Climate Change, came to a similar conclusion, noting that the evidence for global warming as the cause of increases in heat waves and precipitation extremes is particularly robust.
Raise Your Glass to Water
March 22nd was World Water Day. Where is the world’s water? You’ve likely heard that oceans hold 97 percent of it. That’s true, but the numbers get even more interesting when you start to consider some of the less voluminous places where water resides. As this story noted, swamps hold four times as much water as the world’s rivers (0.0008 percent versus 0.0002 percent); and the atmosphere holds more than both (0.001 percent). Want to learn about the blue stuff? A new 30-second animation based on data from the GRACE satellites is on display at Times Square through April 22nd. And though Gothamist suspects it may actually be a Van Gogh painting, NASA’s Goddard’s Scientific Visualization Studio has a new visualization (below) of the ocean’s surface currents that’s going viral.
[youtube CCmTY0PKGDs]
What’s Causing Lake Poyang to Dry?
Poyang Lake in China has seen better days. Once China’s largest lake, it shrunk to just a fraction of its usual size this winter. Scientists are working to understand exactly what’s causing the decline in water levels, but an ongoing drought has surely played a role. The Three Gorges Dam, which is upriver, has likely contributed to the drawdown as well. Remote Sensing of the Environment recently published a study of data from the MODIS instrument that documents the dramatic fluctuation in lake levels between 2000 and 2010. The authors conclude Poyang Lake covered 3,163 square kilometers (1,220 square miles) in August of 2010, but only 714 kilometers (275 square miles) in October of 2010. (In recent months, the size of the lake has dipped to less than 200 square kilometers (77 square miles.) Overall, the scientists found the size of the lake has declined by about 30 square kilometers (12 square miles) a year.
When it Rains it Pours
Xin Lin and Arthur Hou, scientists based at NASA’s Goddard Space Flight Center, recently published a study detailing seasonal and geographical variations in rainfall across the continental United States. By analyzing data from ground radars and rain gauges, they found that although heavy rain events (greater than 10 millimeters (0.4 inches) of rain per hour) only make up up 2.6 percent of total events, they represented 27 percent of the total volume that fell between 2002 and 2009. Light rain events, in contrast, accounted for 65 percent of rain events and 15 percent of the total rain volume.
A Grandfather Speaks Up
James Hansen is sometimes called the grandfather of climate change science, but he also happens to be the grandfather of a pair of youngsters named Sophie and Conner. In the TED talk below, he explains how their birth helped spur him—a self-described “reticent midwestern scientist”—to speak out about the science he’d been studying for decades.
[youtube fWInyaMWBY8]
A Less Hardy Hardiness Map

The USDA has unveiled a new version of its plant hardiness map, which gardeners use to gauge which plants will survive in which climate zone. (Check your nearest seed packet.) In the newest iteration, many zones have shifted northward because winters aren’t as cold as they were 22 years ago when the agency last updated the map — good news if you’re trying to grow, say, figs in Boston. On the new map, most parts of the United States are a half-zone warmer — about 5 degrees Fahrenheit (2.7 Celsius). Global warming surely underlies much of the change, but the USDA points out that more sophisticated mapping techniques, plus the inclusion of data from additional weather stations, has also affected the distribution of the zones.
Why the Arctic Ocean Isn’t Freshening
Rapid freshening on the North American side of the Arctic Ocean in recent decades has prompted speculation that rapid melting of sea ice might be causing a slowing of the “conveyor belt” that keeps water circulating through the world’s oceans. New research led by scientists at the University of Washington helps allay such fears. The researchers conclude that freshwater from the Eurasian part of the Arctic Ocean, which comes originally from rivers in Russia, has simply found a new route that brings more of it toward Canada. The cause for the new freshwater route: changes in winds associated with a weather pattern known as the Arctic Oscillation. In fact, the analysis of satellite and oceanographic data shows that overall salinity in the Arctic Ocean remained constant between 2005 and 2008; as the Canadian portion became fresher, the Eurasian portion grew saltier. The shifting path of the fresh water is shown in red in the animation below.
http://www.youtube.com/watch?feature=player_embedded&v=y8diuqAI6YA
Temperature Ranking-palooza
There’s always a flurry of media activity in January when scientists at NASA, NOAA, and the UK Met Office tally up the year’s temperature measurements and rank how warm the past year was. This January was no exception. In NASA’s analysis, 2011 came in as the 9th warmest year on the modern meteorological record. However, the longer-term trends are what really matter. Look at the whole record – and here are a few interactive charts that are useful for doing that – and it’s clear that the last decade has been the hottest on record. Another remarkable stat: 9 of the 10 hottest years have occurred since 2000. For more details, the science team that manages NASA’s analysis has published a thorough temperature update here.
Image Gallery: Top Climate and Weather Events of 2011
As part of an annual review of Earth’s climate, scientists from NOAA and other institutions have compiled lists of the ten most significant climate and weather events of the past year.In making their recommendations, judges considered the scope, how unusual the event was, and how much human and economic damage it caused. For the United States, the spring rash of tornadoes in the Southeast, extreme drought in the South, a tornado in Missouri, and spring flooding of the Ohio and Mississippi Rivers topped the list. For Earth as a whole, extreme drought in East Africa, flooding in Thailand and Eastern Australia, the persistence of La Nina, and Tropical Storm Washi all made the list.
A Climate Stopgap (That’s Good for Your Health)
Scanning the coverage of a study published recently in Science could leave you thinking scientists have come across a miracle cure for global warming, while simultaneously saving lives and boosting agricultural yields. The good news is that researchers have demonstrated how a set of simple control strategies for methane and black carbon – such as patching up gas pipelines or using existing technology to reduce vehicle emissions – could markedly slow the pace of climate change AND produce health and agricultural benefits. But the flip side is that such actions would provide only a short-term benefit. In the longer term, societies still have to tackle carbon dioxide emissions to get the climate back to a state of equilibrium.
Explore Ignite@AGU
http://www.youtube.com/watch?v=ExuzZrdW58c&feature=player_embedded
If you get a kick out of TED talks — those rapid-fire, information-packed lectures that have turned many little-known academics into YouTube stars — it’s time you also check out Ignite. Whereas TED talks can be up to 18 minutes, Ignite allows speakers just five minutes and a maximum of 20 slides. Above, watch NASA Goddard’s Richard Kleidman use his five minutes at an Ignite event to explain why the world needs a more robust network of ground sensors for monitoring air pollution.
Some of the world’s largest companies suffered multimillion-dollar losses from flooding or drought in the past year, according to a November 16 report from The Guardian. Citing a study from the Carbon Disclosure Project, The Guardian stated that although too much or too little water can affect the profits of large companies, many of those companies remain unprepared for problems likely to arise in the future.
Natural hazards cause widespread losses in dollars and lives, but Mother Nature does not deserve all the blame. Growing human populations and increasingly expensive infrastructure have also contributed to the losses. In short, more people have more stuff for Nature to damage or destroy. For more background, see the Earth Observatory feature The Rising Cost of Natural Hazards.
[youtube 6kgU-mugZOY]
When Music and Climate Change Meet
During a recent event that highlighted the intersection of art and science, NASA climatologist Gavin Schmidt offered an intriguing pitch (see 5:15 in the video above) for a climate change symphony that would use music to tell the story of Earth’s long and varied geologic history. “There are trends in the tides of the planet that come from the changes in the continents, the wobbles in the Earth’s orbit,” he said, emphasizing Earth’s many rhythms, crescendos, and cataclysms that lend themselves to music. Schmidt’s comment came during a panel discussion that included former New York Times reporter Andy Revkin and EPA climatologist Irene Nielson, and followed a unique Antarctica-inspired performance from a string quartet arranged by Paul Miller (aka DJ Spooky). Schmidt isn’t alone in thinking along these lines. NPR recently interviewed composer Andre Gribou about creating musical scores for films shown on spherical visualization system called Science on a Sphere. A new SOS film – called Loop – came out this week.
It’s Official: 2011 Sea Ice Second Lowest on Record
A few weeks ago, the National Snow and Ice Data Center offered an initial assessment of Arctic sea ice that showed that the minimum extent for the year was the second lowest on record. Since then, NASA scientists have dotted the i’s and crossed the t’s and confirmed the finding. Joey Comiso, a NASA sea ice expert, said the continued pattern of low sea ice extents fits into the large-scale decline that has unfolded over the past three decades. “The sea ice is not only declining, the pace of the decline is becoming more drastic,” Comiso pointed out. “The older, thicker ice is declining faster than the rest, making for a more vulnerable perennial ice cover.”
So That’s What Happened to UARS
An old stalwart of NASA’s Earth-observing fleet, the six-ton Upper Atmosphere Research Satellite (UARS), came tumbling through the atmosphere in an uncontrolled reentry in late-September that generated a slew of headlines about the risks of being struck by falling space junk. Those risks, of course, are minuscule (about 1 in 21 trillion) and the handful of satellite pieces that did survive reentry ended up falling harmlessly into a remote area of the South Pacific in the general vicinity of Christmas Island. After its launch in 1991, UARS played a critical role in parsing out how chlorofluorocarbons, chemicals that used to be used widely as refrigerants, deplete ozone. UARS is gone, but for NASA the study of ozone goes on. Later this month, a new ozone-monitoring instrument called Ozone Mapper Profile Suite (OMPS) will launch as part of the NPOESS Preparatory Project.
Texas Drought Overstays Its Welcome
If you’re from Texas, you know this already. But for those who aren’t: the state has been embroiled in an extended heat wave and drought that has left large portions of the state on fire and caused billions of dollars in losses for farmers. If that’s not gloomy enough for you, climatologist John Nielsen-Gammon of the University of Texas warned that the situation isn’t likely to improve anytime soon. The drought could easily persist until 2012. The problem? The establishment of a new La Niña in the central Pacific Ocean, a phenomenon characterized by cooler ocean temperatures that leads to wetter than normal conditions in the Pacific Northwest and drier conditions in the Southwest.

Dramatic Arctic Ozone Loss
In April, the World Meteorological Organization announced that scientists had observed significant thinning of the ozone layer over the Arctic. That news turned heads because it’s the ozone layer over Antarctica that’s most prone to ozone loss. Recently, a research team associated with NASA’s Jet Propulsion Laboratory offered a more comprehensive assessment of the unusual spring thinning in the Arctic based on data collected by the Aura and CALIPSO satellites, balloon instruments, and atmospheric models. The bottom line: the upper atmosphere of the Arctic grew so cold this winter that ozone loss was severe enough that scientists say what amounts to a “hole” (five times the size of California) formed over the region and persisted for more than a month. Is climate change to blame? Sort of, but not exactly. Manmade chlorofluorocarbons drive ozone depletion (not the greenhouse gas carbon dioxide), but scientists say that global warming has likely exacerbated ozone loss because it cools the upper part of the atmosphere even as it warms the lower part. Confused? The Capital Weather Gang has a post that delves into the details.
Floods Devastate Pakistan
For the second straight year, torrential monsoon-driven rains have swamped portions of Pakistan. The AFP reports that more than 200 people have been killed and thousands have fled their homes. Researchers associated with the MODIS instrument on the Terra satellite recently posted an eye-opening set of images that shows the condition of the swollen Indus River in early September in comparison to more normal conditions. Meanwhile, NASA researcher William Lau has published an interesting new study that shows last year’s floods in Pakistan were closely linked to large fires that occurred in western Russia around the same time.
Climate Science Marathon
Kick back and break out the popcorn. Al Gore’s Climate Reality Project has posted 24 hours of presentations and roundtable discussions about climate change. Reactions to the event have been predictably diverse. Commentators who regularly question the veracity of climate change have taken a dim view of the presentations, while those who regard climate change as an urgent threat have welcomed them. Despite having an unusually high tolerance for PowerPoint, I’ll admit that I have about 22 hours to go before getting through all of them. One segment caught my eye: NASA’s Drew Shindell explains how physics suggests a warming world will produce more extreme weather. Take a look starting at 37:35 of the Cape Verde video.
The Extreme Weather Connection
Speaking of extreme weather and climate science, Nature has an interesting piece about how some climate scientists have become less reluctant about linking extreme weather events to climate change. Nature recently published two studies highlighting just such connections. The journal also reports that a group of British and American researchers are laying the foundation for a system to assess in near-real time how much specific weather events are connected to climate change. “Attribution of extremes is hard — but it is not impossible,” Gavin Schmidt of the Goddard Institute for Space Studies told Nature.
[youtube 6Hv4S90UOBY]
See the Shrinking Arctic Sea Ice
The National Snow and Ice Data Center released preliminary numbers on the minimum extent of Arctic sea ice, calling this year’s minimum the second lowest on record. Other groups relying on slightly different data report this year’s sea ice minimum is a record low. At the end of the day, whether this year goes down as the lowest or the second lowest ice extent isn’t particularly important. The long-term trend is abundantly clear. Sea ice is retreating, and fast. NASA hasn’t weighed in officially with its numbers, but Goddard Space Flight Center’s Flickr page has posted striking video and stills of the 2011 ice loss.
Mars Research Has Earthly Applications
Looks like the time might be coming to trade in that dowsing stick for low-frequency sounding radar. The Jet Propulsion Laboratory announced that its scientists, in conjunction with colleagues from the Kuwait Institute for Scientific Research (KISR), have used sounding radar — developed for a mission to Mars — to successfully locate underground aquifers, probe variations in the water table, and identify locations where water flowed into and out of the aquifers. “This is a critical first step that will hopefully lead to large-scale mapping of aquifers,” said Muhammad Al-Rashed, director of KISR’s Division of Water Resources. Here’s a good video overview of the story.
Look Up: Here Comes UARS
NASA’s bus-sized Upper Atmosphere Research Satellite, or UARS, is poised to reenter Earth’s atmosphere on September 23rd or 24th. Much of the 12,500-pound (5,700-kilogram) satellite will burn up upon reentry, but Johnson’s Orbital Debris Program cautions that some pieces of the spacecraft could survive. Nobody has ever been injured by falling space junk, nor has any significant property damage ever occurred. Still, if you’re worried about being pelted, the Joint Space Operations Center of U.S. Strategic Command at Vandenberg Air Force Base will be posting frequent updates detailing when are where pieces might fall as the reentry date approaches. Meanwhile, read up on the considerable contributions the satellite made to science here.
[youtube a1FpqatXj6w]
Behold the Mesmerizing Flow of Antarctic Ice
The first complete map of the speed and direction of ice flow in Antarctica slid off Science’s presses last month and hit the media with a splash. The BBC, New York Times, Climate Central and dozens of other publications highlighted the news and linked to this striking visualization of Antarctic glaciers flowing thousands of miles from the heart of the continent to its coast. “The map points out something fundamentally new: ice moves by slipping along the ground it rests on,” said Thomas Wagner, NASA’s cryospheric program scientist. “That’s critical knowledge for predicting future sea level rise. It means that if we lose ice at the coasts from the warming ocean, we open the tap to massive amounts of ice in the interior.” The study also uncovered a ridge that runs east to west across the continent.
Faux Controversy of the Week
The web got ahead of the facts in August when a Guardian reporter came across a study in an obscure scientific journal that considered how an alien species would react to life on Earth. The resulting Guardian article – ominously headlined “Aliens may destroy humanity to protect other civilizations, say NASA scientists” – created quite a stir on the web, particularly because the scientists made reference to the possibility that increasing levels of greenhouse gases could attract the attention of hostile aliens. The problem: as NASA headquarters made perfectly clear in a series of tweets, the agency did not fund or any in any way sanction the research.
An Ocean Current Out of the Blue
The discovery that a long-suspected ocean current – the North Icelandic Jet – contributes a large amount of cold, dense water to the global ocean conveyor belt that regulates climate in the Northern Hemisphere has thrown a wrench into scientists’ understanding of how the ocean will respond to climate change. The existence of the current means the North Atlantic may be less sensitive to climate change than previously thought, Reuters reported. “We’ve identified a new paradigm,” said Robert Pickart of the Woods Hole Oceanographic Institution and an author of a new study on the North Icelandic Jet. “We’re hypothesizing a new, overturning loop of warm water to cold.”
Foamy Wakes Deflect Climate Change
Can the foamy wakes left behind ships counteract global warming? A study led by Charles Gatebe of NASA’s Goddard Space Flight Center suggests the answer could be yes. Boats create fleeting trails of foamy water that can reduce global temperatures by reflecting sunlight more than the darker ocean water nearby, New Scientist reported. That said, don’t expect ship wakes to serve as a trump card against climate change. The cooling wakes produce is just a fraction of the warming caused by shipping’s carbon emissions. And, to complicate matters even further, the particles of ship exhaust can influence cloud development in ways that can also affect the climate.
Happy 20th, Alaska Satellite Facility
Satellites high in space tend to get the lion’s share of attention, but the data they collect mean little until they’ve gone through one of a network of eight ground-based data processing centers scattered across the country. NASA’s distributed active archive centers, or DAACs, transform raw data into sets that all Earth scientists can access and study. One of the DAACs, the Alaska Satellite Facility, just celebrated its 20th anniversary, the News Miner reported. According to that paper, the Fairbanks facility receives data that allows scientists to monitor volcano activity, sea ice coverage, deforestation, and glacier retreat.
Carbon Emissions on the Rise
The economy may feel like its ailing, but that hasn’t stopped carbon dioxide emissions in the United States from shooting up, the U.S. Energy Information Administration reported. In 2010, energy-related carbon dioxide emissions went up 213 million tons or 3.9 percent – the largest increase since 1988 when emissions rose by 218 metric tons or 4.6 percent. What’s behind the growth? Population went up, manufacturing (particularly energy intensive manufacturing) bounced back after the 2008-2009 recession, and a hot summer led to increased air-conditioning demand. Since 1990, Forbes reported, CO2 emissions in the U.S. have grown at an average annual rate of 0.6 percent.
Arctic Ice Update
It’s good fun to follow the progress of our ship full of scientists cruising the Arctic Ocean and scrutinizing the health of marine ecosystems, but what do satellites show is happening to the central part of that ecosystem – the sea ice? The National Snow and Ice Data Center released an update noting that Arctic sea ice extent for June 2011 was the second lowest in the satellite record since 1979. Stay tuned: weather over the next few weeks will determine whether Arctic sea ice cover reaches record lows.
Coasts-a-Crumbling?
Pacific storms with waves 20 percent stronger than normal hammered the West Coast of North America in 2009-2010, causing coastal erosion rates to spike, the U.S. Geological Survey announced this week. Ocean Beach in California saw some of the most vigorous erosion, with its shoreline retreating 184 feet – 75 percent more than a typical winter. The cause: an El Niño-like phenomenon called El Niño Modoki. Warm water pooled in the central Pacific instead of the eastern equatorial Pacific, bringing stronger waves and higher sea levels to the West Coast.
A Bit of Good News
Writing about climate science can get grim: melting ice, warming temperatures, rising sea levels. But the weather is nothing if not variable, so there’s often good news to share as well. One hydrology example: The water level at Lake Mead, the nation’s largest freshwater reservoir, has been rising since February. Water levels are still modest, but after nearing a record low last November, it’s a welcome relief for the 35 million people who rely on the lake’s water in the short-term. The long-term, as Climate Central reports, is a whole other matter…
Thirteen Years of Aerosols
NASA’s What on Earth blog reports that measurements from a now defunct satellite called SeaWiFS have allowed researchers from NASA’s Goddard Space Flight Center to develop the longest single-satellite global record of aerosols. (Not sure what an aerosol is or what it has to do with climate? Read this.) Why does a long aerosol record matter? Two other important records from satellite instruments — one from MODIS and the other from MISR — don’t agree well over land, so scientists hope that data from other other sensors like SeaWiFS might help resolve some of the discrepancies and reduce the overall uncertainty about aerosols in climate models.

Lost Something?
Nope, this isn’t from a sci-fi movie. This is a real picture of a Russian Orlan spacesuit – stuffed with old clothes and set free to orbit Earth. Why exactly the Russians decided to toss the suit – also known as SuitSat 1 – into space is rather mystifying, but this Wikipedia article suggests it was a commemorative gesture for the 175th anniversary of Moscow State Technical University, and this Science@NASA piece from 2006 hints it was an engineering test of some sort. Regardless of intent, one thing is certain: the pictures make fabulous computer wallpaper.
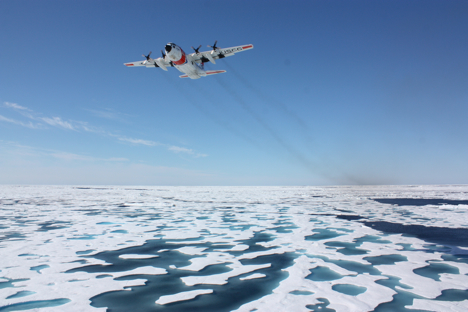
No Ordinary Sight
If you’re driving along Interstate 95 between Washington and Baltimore this July, don’t be alarmed if you see a large aircraft hurtling toward you from above. It’s not a a terrorist attack or a pilot dozing at the stick; it’s just NASA’s P-3B doing air quality research. The 117-foot plane is the workhorse for a field experiment that kicked off this week. The plane will fly along heavily-traveled roadways and make conspicuous spirals over ground stations in northeastern Maryland. “We’re trying fill the knowledge gap that severely limits our ability to monitor air pollution with satellites,” said James Crawford, the experiment’s lead scientist.

Still Warming Folks
The more things change, the more they stay the same. NOAA released its annual State of the Climate Report (PDF) this week, and the findings won’t surprise anybody who has cracked a newspaper open in the last decade. Last year was the second warmest on record since official record-keeping began. The world’s glaciers lost mass for the 20th year in a row. Arctic sea ice shrank to its third smallest area on record. I could go and on – NOAA offers details on a total of 41 global climate indicators in the report — but The Washington Post already has it covered.
Near Misses
Asteroid 2011 MD offered a reminder last week that catastrophe could strike unexpectedly. The asteroid arrived out of the blue – er, black – and buzzed within 7,500 miles of Earth. The good news, as the Christian Science Monitor reported, is that the asteroid was small enough that it would have burned up in the atmosphere even if it had been headed for Manhattan. Meanwhile, in other space flotsam news, the crew of the International Space Station had a close call with a hunk of debris this week.
Sea Ice Today, Gone Tomorrow
After reading this post from the “Open Mind” climate blog, I have a feeling that after regaling my future grandkids with stories of life before cell phones and Facebook, I’ll be telling them about the days when we actually had summer sea ice in the Arctic. Tamino’s post walks through what scientists know about the rapid decline in sea ice extent and volume due to satellite, aircraft, and submarine research. In sum, the trends are pretty grim. “The phrase ‘death spiral’ comes to mind,” the blogger noted.
Never a Dull Day for Science
Every field expedition has its hiccups, and this time they’ve come early and often for the Healy, the Coast Guard icebreaker conducting NASA-sponsored research in the Arctic. While still in port in Alaska, a magnitude-7.2 earthquake and subsequent tsunami warning sent the crew and scientists scrambling for high ground. A few days later, a distress signal from a sinking tugboat sent the Healy off its planned route to conduct a search-and-rescue mission. A Coast Guard helicopter rescued the tugboat’s stranded crew, and now the icebreaker is back on course. Science writer Kathryn Hansen is on board blogging about the drama.
A Mesmerizing View
The simplicity, beauty, and calming voice of the narrator in this video of Earth from the vantage point of the International Space Station makes me want to watch it again and again. And it appears I’m not alone – the clip had already registered more than a million views when this post went live in late June. Meanwhile, Popular Science reported that a Canadian company has plans to stream a high-definition video feed from the space station later this year. “The system will work as a sort of mashup between Google Earth and YouTube,” the founder of the company said. Sign me up…
[youtube rj18UQjPpGA]
Maunder’s Return
This sounds like a straight-to-DVD sci-fi title. But the National Solar Observatory announcement last week that the Sun could be entering a grand minimum should probably be filed with cable TV’s “What Would Happen If…” documentaries. The last time the Sun went quiet for a long stretch – dubbed the Maunder Minimum — the world plunged into the “Little Ice Age.” But this time, there will probably be very little impact because of the long-term warming that is already underway, says Georg Feulner of the Potsdam Institute for Climate Impact Research.

Where is Aquarius?
While we are waiting to get the first bits of data from Aquarius, NASA’s latest Earth observing satellite and first to measure ocean salinity, you can check out where the Aquarius/SAC-D spacecraft is orbiting at this site. Aquarius successfully reached orbit on June 10, after a launch from Vandenberg Air Force Base.
Predicting Climate Changes
Timothy Lenton of the University of Exeter (UK) argues that significant climate tipping points – when earth systems pass a point of change that is large and largely irreversible – are more predictable than scientists have thought. “Recent work shows that early warning of an approaching climate tipping point is possible in principle,” Lenton writes in Nature Climate Change, “and could have considerable value in reducing the risk that they pose.”
Wallowing in Fire
The Wallow Fire in Arizona became the largest wildfire in the state’s history last week. Discussion of the role a warming climate will play in increased wildfire began spreading like…nevermind. New West wrote about the future of the Rockies and fires, based on some recent and fascinating paleo-fire research from NASA; The Washington Post’s Capital Weather Gang dug through a National Academies of Science report from 2010 that also delved into topic.
Plankton on Ice
A team of 47 scientists will take an icebreaker, the Healy, to the extreme environment of the Arctic Ocean for about six weeks this summer, as the second and final leg in a NASA field campaign called ICESCAPE. The cruise is designed to study how ongoing climate changes are affecting ocean chemistry and physics and marine life. Check out science writer Kathryn Hansen’s blog from the ship beginning this week and lasting throughout the research cruise. (The blog updates will begin as soon as Kathryn gets aboard ship in the ironically named Unalaska, Alaska.)
A Plate of Water
And we thought we would share this from our friends at Earth Science Picture of the Day as a bit of solstice joy…
