Eighty five years ago today, Wilson Alwyn Bentley died of pneumonia. It was December 23, 1931, and outside his home in Jericho, Vermont, the sky was ripe for snow. His final diary entry read: “Cold north wind afternoon. Snow Flying.” It was the sort of weather he had lived for.
Bentley began to observe snow at 15 years old, when his mother bought him a microscope. It consumed his days, he later recalled:
When the other boys of my age were playing with popguns and sling-shots, I was absorbed in studying things under this microscope: drops of water, tiny fragments of stone, a feather dropped from a bird’s wing, a delicately veined petal from some flower. But always, from the very beginning, it was snowflakes that fascinated me most. The farm folks, up in this north country, dread the winter; but I was supremely happy.
Over the subsequent decades, Bentley photographed more than 5,000 snowflakes, and created the first photomicrograph of an ice crystal, combining a microscope and an accordion-shaped bellows camera. A professor of natural history who became known as “the snowflake man,” he demonstrated what is now a common adage: no two snowflakes are alike.

Photos: Snowflakes circa 1902 by Wilson Bentley. Courtesy of Wikimedia Commons.
The snow Bentley observed at a microscopic scale, satellites now see at the size of whole continents. The subject matter that fascinated him still provides fodder for heaps of scientific papers today.
December 2016 has brought a flurry of Bentley-esuqe weather to the U.S. East Coast, including snow and biting winds. But long before winter kicked into full gear in cities like Washington and New York, it painted landscapes around the world white. From Japan to Kazakhstan, NASA satellites observed snow from space. So if you’re dreaming of a white Christmas or waiting for the gingerbread cookies to bake, here are several images—some we previously published, and others that are quite fresh.

Image: NASA Earth Observatory/Joshua Stevens, using Landsat data from the U.S. Geological Survey.
December 19: ‘Gateway to the Desert’ Gets First Snow in 37 Years
Snow fell in the town of Ain Sefra for the first time in nearly four decades this December. Satellites show a thin, white veil covering the orange sand dunes of the northern Sahara. The Enhanced Thematic Mapper Plus (ETM+) on the Landsat 7 satellite captured this natural-color image of snow on December 19, 2016. On the ground, Photographer Karim Bouchetata captured the snow before it melted.

Image: NASA Earth Observatory/Joshua Stevens using VIIRS day-night band data from the Suomi National Polar-orbiting Partnership.
December 14: The Great Lakes Don a White Cloak
An Arctic air mass brought more snow to communities around the Great Lakes on December 14, 2016. The lake-effect snow comes on the heels of an earlier accumulation that piled up to several feet of snow in some areas, according to reports. Officials issued weather warnings and advisories from northeast Ohio to upstate New York.

Image: NASA Earth Observatory/Jeff Schmaltz, using MODIS data from LANCE/EOSDIS Rapid Response.
December 2: Snow and ash above Katmai
A plume of volcanic ash hangs over the Gulf of Alaska in this natural-color image. The plume is not the product of an active volcano; it contains re-suspended ash from the 1912 eruption of Novarupta, according to the Alaska Volcano Observatory.

Photograph: Astronaut photography from the Expedition 48 crew.
November 27: Snow 2.0
The white hills sprawling in every direction look like mounds built by snow plows, or massive hills of sugar. In fact, they’re the world’s largest gypsum dune field: the White Sands National Monument, located in southern New Mexico.
During the last Ice Age, melting snow and ice from the San Andres Mountains (west of the dunes) and the Sacramento Mountains (to the east) eroded minerals from the hillsides and carried them downhill to the basin below. As the climate warmed and the water evaporated, the basin remained full of selenite (the crystalline form of gypsum) and created the Alkali Flats. Over time, winds broke the crystals into sand grains, which built up into the dunes.

Image: NASA Earth Observatory/Joshua Stevens, using MODIS data from LANCE/EOSDIS Rapid Response.
November 25: Rare November snow in Tokyo
On November 24, 2016, Tokyo received its first November snowfall in more than half a century. The snow fell in and around the Japanese capital, coating the metropolitan area.
The Moderate Resolution Imaging Spectroradiometer (MODIS) on NASA’s Terra satellite captured this natural-color image the same day. Central Tokyo is gray-brown in color, suggesting less accumulation or faster melting. Urban centers tend to shed snow faster than surrounding countryside because they are often hotter, a result of the urban heat island effect.

Image: NASA Earth Observatory/Pola Lem, using MODIS data from LANCE/EOSDIS Rapid Response.
November 20: White hills appear amid green in England
Snow arrived in parts of northern England before a satellite took this image on November 20. According to reports, the same storm brought high winds and lashing rain farther south, in Kent and Sussex.

Image: NASA Earth Observatory/Pola Lem, using MODIS data from LANCE/EOSDIS Rapid Response.
November 17: White Kazakhstan
Broad swaths of Kazakhstan turned white before this Visible Infrared Imaging Radiometer Suite (VIIRS) image was taken on November 17, 2016. Parts of the country saw temperatures dipping well below freezing, with extreme wind chills. That’s not a surprise for locals; the country’s capital, Astana, often experiences frigid days in winter months.

Image: NASA Earth Observatory/Jesse Allen, using EO-1 ALI data provided courtesy of the NASA EO-1 team.
November 5: Snow meets lava in Iceland
More than a year after the latest eruption at Iceland’s Holuhraun lava field, the newly-formed lava may still be toasty underneath. Although the basaltic rock formed a hard crust, according to volcanologists, the flow is probably still hot enough to prevent snow from building up atop it.
“You’re not going to freeze the lava flow,” said Erik Klemetti, a volcanologist at Denison University and author of the Eruptions blog at Wired magazine. “You need to wait for the soil to freeze to get snow to accumulate in temperate latitudes.”

Image: NASA/Jeff Schmaltz.
October 7: Early snow blankets Nebraska
Snow dusted parts of Nebraska on October 6, 2016. This natural-color image, acquired by the Moderate Resolution Imaging Spectroradiometer (MODIS) on NASA’s Terra satellite, shows a white blanket covering about 40 square miles (more than 100 square kilometers). Photos taken by highway cameras showed snow falling along parts of U.S. Route 83 on the afternoon of October 6.
The science team behind the Multi-angle Imaging SpectroRadiometer (MISR) on NASA’s Terra satellite frequently publishes special images called stereo anaglyphs. For example, you might have seen our recent series of anaglyphs celebrating the centennial of the National Park Service. But what exactly is an anaglyph, and how is one made from MISR data?

All methods of viewing images in three dimensions rely on the fact that our two eyes see things at slightly different angles; this is what gives us depth perception. As a simple demonstration, hold a finger at a short distance from your face, and close one eye at a time. You will notice that your finger appears to be in a different place with each eye. The horizontal distance between the two versions of your finger is called the parallax. Your brain interprets the amount of parallax to tell you how far away your finger is from your face—the greater the parallax, the closer your finger!
However, your brain can also be tricked into thinking that a perfectly flat picture is actually a three-dimensional object by presenting each eye with a slightly different version of the picture. The first 3D viewing technology was the stereoscope, originally invented by Sir Charles Wheatstone in 1838. The stereoscope takes two images viewed from slightly different angles and mounts them next to each other. The photos are viewed using fixed lenses that fool the brain into thinking that it is looking at one picture. Stereoscopes worked well, but their major drawback was that they could only be used by one person at a time.
In 1858, Joseph D’Almeida, a French physics professor, invented a method of showing stereoscopic images to many people at once using a lantern projector equipped with red and blue filters. The viewers wore red and blue goggles. Later, Louis Du Haron adapted this technique to allow anaglyphs to be printed and viewed on paper. In 1889, William Freise-Green created the first anaglyphic motion picture. These early 3D movies were nicknamed “plastigrams” and were very popular by the 1920s.
At the most basic level, anaglyphs work by superimposing images taken from two angles. The two images are printed in different colors, usually red and cyan. The viewer needs glasses with lenses in the same colors. The lenses are needed to filter out the unwanted image for each eye. So, if the image for the right eye is printed in red, the image can be seen through the cyan lens placed over the right eye, but not through the red lens over the left eye, and vice versa. The brain, seeing two different pictures through each eye, interprets this as a three-dimensional scene.

The reason why the MISR instrument can be used to make anaglyphs is because it has nine cameras, each fixed to point at a different angle. Therefore, as MISR passes over a particular feature on Earth, it captures nine images spanning a range of 140 degrees (diagram above). Any two of these images can be combined to make an anaglyph. The greater the angular difference between the images, the greater the resulting 3D effect; however, if the angular difference is too great, the brain will be unable to interpret the image.
Anaglyphs made with MISR must be rotated so that the north-south direction is roughly horizontal. Though this is inconvenient — we are used to viewing the Earth with north at the top — it is necessary because Terra flies from north to south, and MISR’s cameras are aligned to take images along that track. Therefore, the angular difference between the images is in the north-south direction. Since our eyes are arranged horizontally, the angular difference between the anaglyph images must be horizontal as well.
You can see this by comparing two versions of an anaglyph of Denali, Alaska (below). In the version with north upwards (left), the 3D effect does not work. But when the image is rotated so that north is to the left, suddenly the mountains pop out.

Anaglyphs are useful for science because they allow us to intuitively understand the three-dimensional structure of things like hurricanes and smoke plumes. For example, examine the three-panel image of Typhoon Nepartak below. (All three images have been rotated so north is to the left).

In the top, single-angle image, the eye of the storm appears to be quite deep due to the shadows, but otherwise it is difficult to determine how high the clouds are. Compare this to the middle image, which shows the results from MISR’s cloud top height product; it uses a computer algorithm to compare the data from multiple cameras and determine the geometry of the clouds. Now we can tell that clouds in the central part of the storm are very high (except for the eye), while the spiral cloud bands are slightly lower and there are very low clouds between the arms. However, understanding this data set requires us to interpret the color key and have at least a rudimentary idea of how 16 kilometers compares to 4 kilometers.
Now put on your red-blue glasses* and look at the anaglyph in the third image. All of the features are immediately understood by our brains. While it takes a few minutes (or paragraphs) of explanation to introduce a first-time viewer to MISR datasets, the red-blue glasses make it possible to enjoy the same experience with a simple image. This is why anaglyphs make great tools for scientists as well as for sharing unique views of Earth’s features with the public.
Editor’s note: If you don’t have a pair of red-blue glasses, this page lists companies that sell them. Or if you can find some red and blue plastic wrap, you can make your own. The instructions are here.
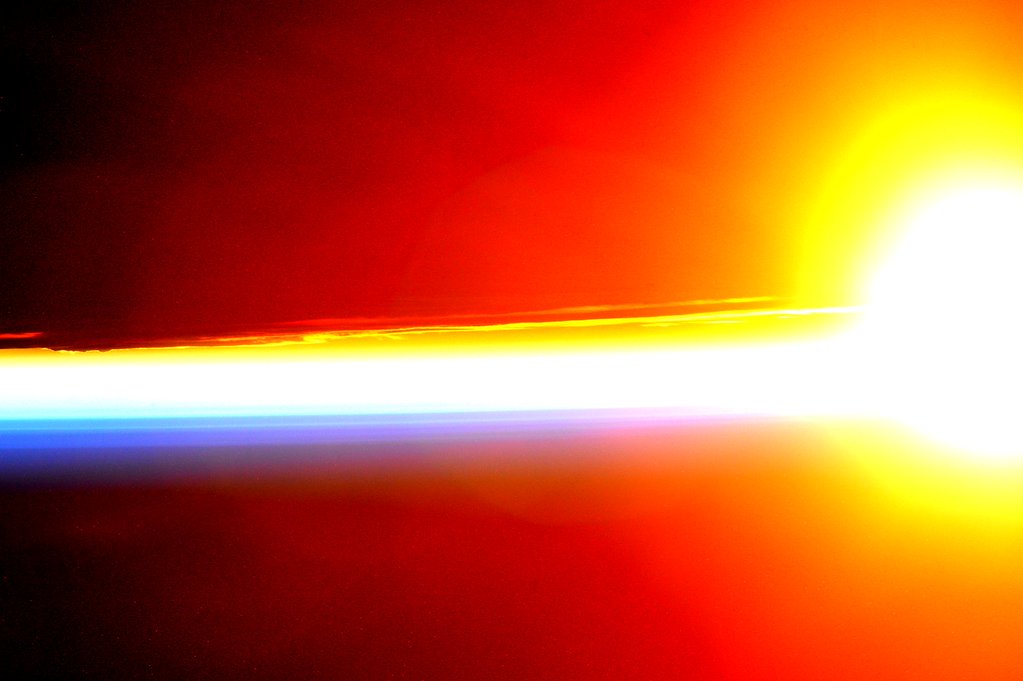
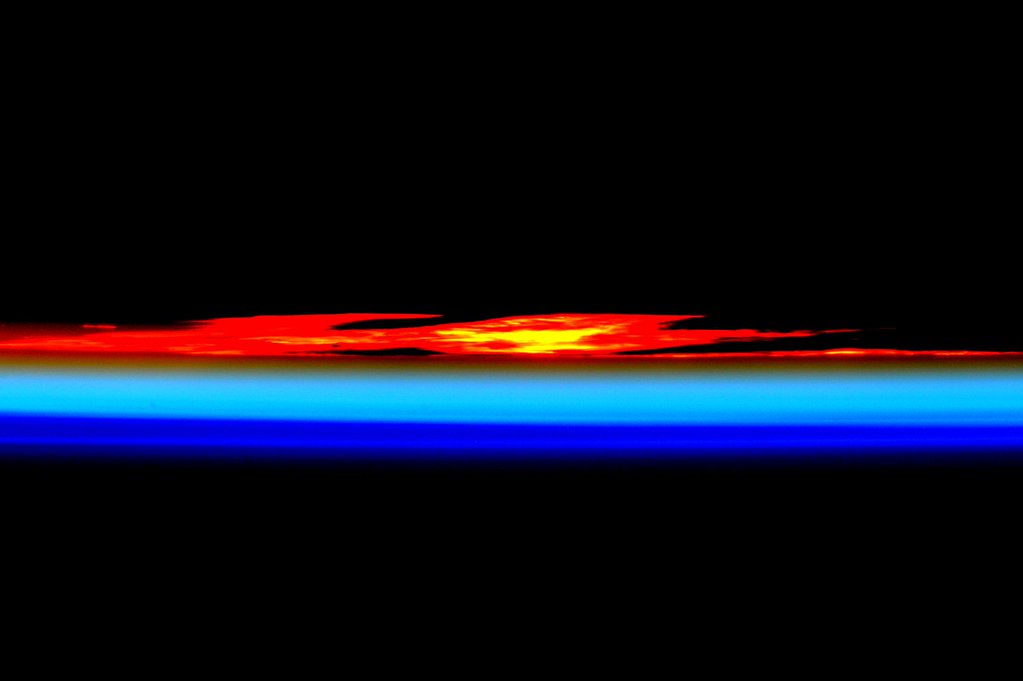
Photographs by Scott Kelly/NASA. Sunrise (upper); sunset (lower).
My colleagues and I spend most of our time looking for stories, images, and data related to the latest and greatest remote sensing science at NASA and beyond. This often leads us to rather technical scientific journals and obscure websites that are hardly known for their artistry.
But every now and then during the course of a workday, we stumble across an image that is simply so gorgeous that we can not resist sharing it. The first image above, tweeted from the International Space Station by astronaut Scott Kelly on January 13, captures the intense, raw beauty of a sunrise with an unforgettable gradient of yellow to red. About eight hours later, he tweeted the second image. “Day 292. Colors of #sunset. #GoodNight from @space_station! #YearInSpace,” Kelly said of the orange, teal, and blue horizontal lines that fade to black.
This was probably not Kelly’s only chance to capture a spectacular sunset and sunrise on January 13.
“The sun truly ‘comes up like thunder,’ and it sets just as fast,” said Joseph Allen, an astronaut who logged more than 300 hours in space on the Space Shuttle in the 1980s. “Each sunrise and sunset lasts only a few seconds. But in that time you see at least eight different bands of color come and go, from a brilliant red to the brightest and deepest blue.”
Curious to see more sunsets and sunrises from space? In the image below, see how a sunset reveals different layers of the atmosphere. Learn more about the image here. See several more of Kelly’s sunrise and sunset photographs featured by The Atlantic here. And if you still want more space sunrises and sunsets, check out our archives.

