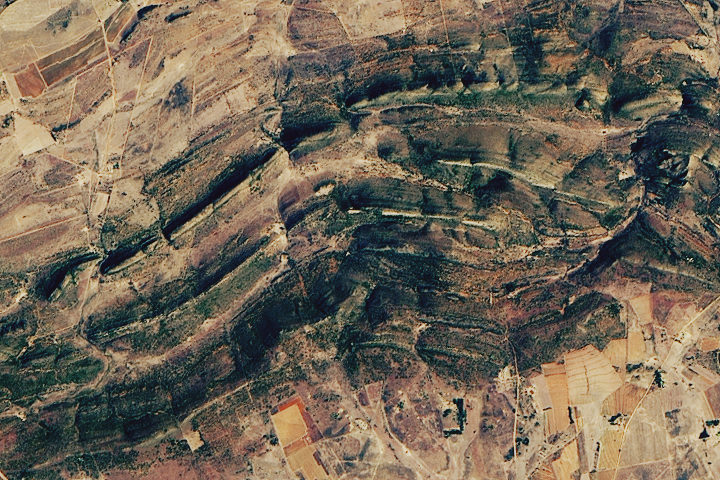
Every month on Earth Matters, we offer a puzzling satellite image. The August 2018 puzzler is above. Your challenge is to use the comments section to tell us what we are looking at and why this place is interesting.
How to answer. You can use a few words or several paragraphs. You might simply tell us the location. Or you can dig deeper and explain what satellite and instrument produced the image, what spectral bands were used to create it, or what is compelling about some obscure feature in the image. If you think something is interesting or noteworthy, tell us about it.
The prize. We can’t offer prize money or a trip to Mars, but we can promise you credit and glory. Well, maybe just credit. Roughly one week after a puzzler image appears on this blog, we will post an annotated and captioned version as our Image of the Day. After we post the answer, we will acknowledge the first person to correctly identify the image at the bottom of this blog post. We also may recognize readers who offer the most interesting tidbits of information about the geological, meteorological, or human processes that have shaped the landscape. Please include your preferred name or alias with your comment. If you work for or attend an institution that you would like to recognize, please mention that as well.
Recent winners. If you’ve won the puzzler in the past few months or if you work in geospatial imaging, please hold your answer for at least a day to give less experienced readers a chance to play.
Releasing Comments. Savvy readers have solved some puzzlers after a few minutes. To give more people a chance to play, we may wait between 24 to 48 hours before posting comments.
Good luck!
Answer: About two billion years ago, an asteroid hit Earth southwest of what is now Johannesburg, South Africa, and formed Vredefort Crater—the world’s oldest and largest known impact structure. Layers of upturned rock eroded at different rates and produced the concentric pattern visible in the image above. Congratulations to Felix Bossert and Tom for correctly identifying the feature. Read more about the image in our September 1, 2018, Image of the Day.
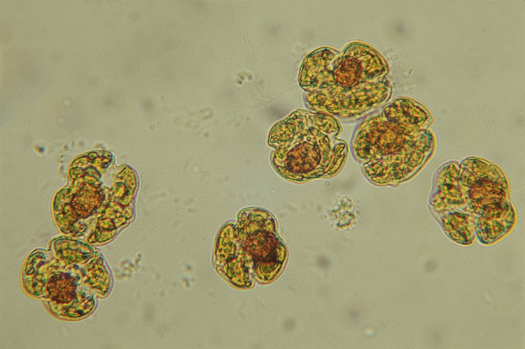
Karenia brevis cells. Image credit: Mote Marine Laboratory
Put a sample of water from the Gulf of Mexico under a microscope, and you will often find cells of Karenia brevis swimming around. The microscopic algae—the species of phytoplankton responsible for Florida’s worst red tide outbreaks—produce brevetoxin, a compound that in high concentrations can kill wildlife and cause neurological, respiratory, and gastrointestinal issues for people.
Under normal conditions, water quality tests find, at most, a few hundred K. brevis cells per liter of water—not enough to cause problems. But in August 2018, in the midst of one of the most severe red tide outbreaks to hit Florida’s Gulf Coast in a decade, water samples regularly contained more than one million K. brevis cells per liter.
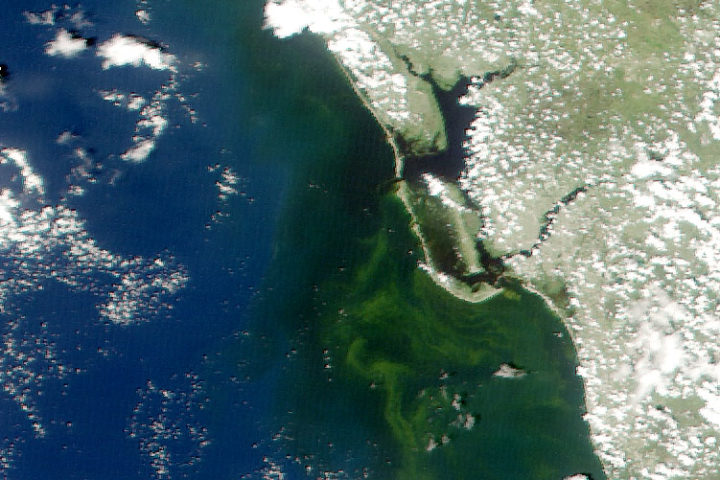
Natural-color MODIS satellite image of algae staining the water off the coast of Fort Myers on August 19, 2018. Image from the University of South Florida Near Real-Time Integrated Red tide Information System (IRIS).
That was enough to stain large swaths of coastal waters shades of green and brownish-red and leave beaches littered with rotting fish carcasses. Roughly 100 manatees, more than 200 sea turtles, and at least 12 dolphins have been killled by red tides, according to preliminary estimates. For much of August, the toxic bloom stretched about 130 miles (200 kilometers) along Florida’s Gulf coast, from roughly Tampa to Fort Myers. Though the bloom has been active since October 2017, it intensified rapidly in July 2018. The damage grew so severe and widespread that Florida’s governor declared a state of emergency in mid-August.
One of the best ways to test for the presence of K. brevis is to analyze water samples collected from boats or beaches. State environmental agencies do this on a regular basis, but understanding the full extent and evolution of fast-changing blooms, or predicting where they will move with ground sampling alone is a challenge.
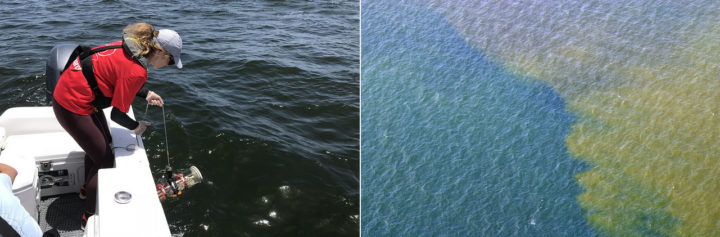
Sampling red tide in 2018 (left). An aerial view of red tide in 2005 (right). Photo credits: Florida Fish and Wildlife Conservation Commission.
That’s why key red tide monitoring systems, such as the National Oceanic and Atmospheric Administration’s (NOAA’s) Harmful Algal Bloom Forecast System and the Near Real-Time Integrated Red Tide Information System (IRIS) from the University of South Florida, make use of satellite data from the Moderate Resolution Imaging Spectroradiometer (MODIS) sensors on NASA’s Aqua and Terra satellites. These sensors pass over Florida’s Gulf Coast twice a day, acquiring data at several wavelengths that can be useful for identifying and mapping the spatial extent of algal blooms. Other satellite sensors such as the Visible Infrared Imaging Radiometer Suite (VIIRS) on Suomi NPP and the Ocean and Land Color Instrument (OCLI) on Sentinel-3 collect information that can be used to monitor red tides as well.
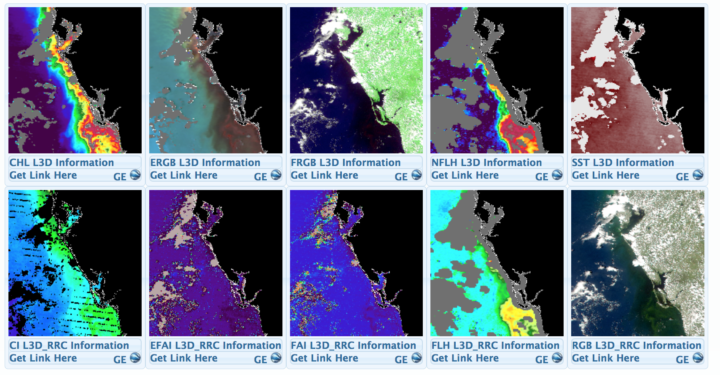
A screenshot from the University of South Florida’s Near Real-Time Integrated Red tide Information System (IRIS). The image shows various types of data captured by MODIS sensor on Terra on August 19, 2018. Solar-stimulated fluorescence data (NFLH) is particularly useful for locating algal blooms. Image Credit: USF/IRIS
Despite the utility of satellite observations, there are some significant challenges to interpreting satellite data of algal blooms in shallow, coastal waters, explained oceanographer Chuanmin Hu of the University of South Florida. Chief among them: it can be quite difficult to distinguish between algal blooms, suspended sediment, and colored dissolved organic matter (CDOM) that flows into coastal areas.
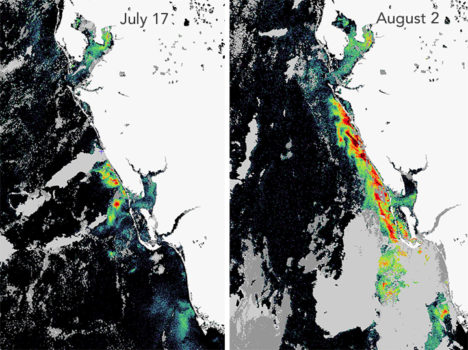
The Karenia brevis bloom expanded and intensified in late-July. This fluorescence data comes from the OCLI sensor on Sentinel 3. Image courtesy of Rick Stumpf, NOAA.
To get around this problem and make satellites better at pinpointing algal blooms, Hu and colleagues at the University of South Florida have developed a red tide monitoring system that makes use of MODIS observations of fluorescence, which algal bloom emit in response to exposure to sunlight. “If we have fluorescence data to go along with a natural-color image from MODIS, we can say with a high degree of confidence where the algal blooms are and where the sensor is just detecting sediment or CDOM,” he said. When fluorescence data is available, the Florida Fish and Wildlife Commission pushes it out to the public as part of its red tide status updates (see the August 21 update below).
Likewise, NOAA has combined a fluorescence method with a long-standing technique that identifies recent increases in chlorophyll concentration, the combination improves the identification of likely K. brevis blooms — information that then gets incorporated in NOAA’s HAB Forecast System, noted Richard Stumpf, an oceanographer with NOAA.
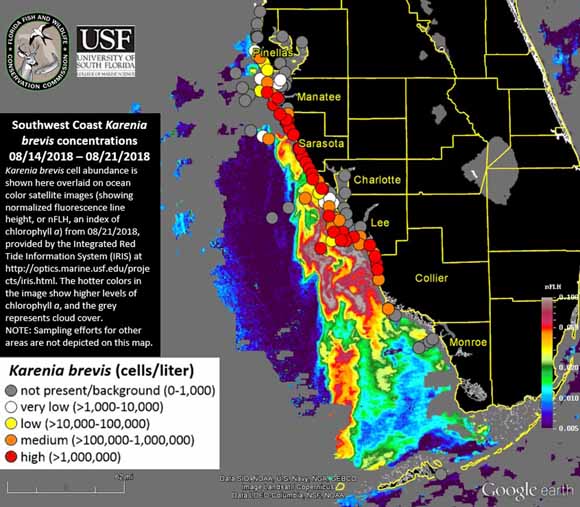
K. brevis cell abundance shown on an ocean color satellite image from the IRIS system. Warmer colors indicate higher levels of chlorophyll a, an indicator of algae. Cloudy areas are gray. Circles indicate locations where officials tested water samples on the ground. Image Credit: FFW/USF/IRIS.
However, that still leaves some big problems—only about ten percent of MODIS passes collect usable fluorescence data. The rest of the time images are marred by either sunglint or clouds. And the algorithm that scientists use to detect algal blooms with MODIS does not work well within one kilometer of the coast—the part that is of the greatest interest to beachgoers and boaters.
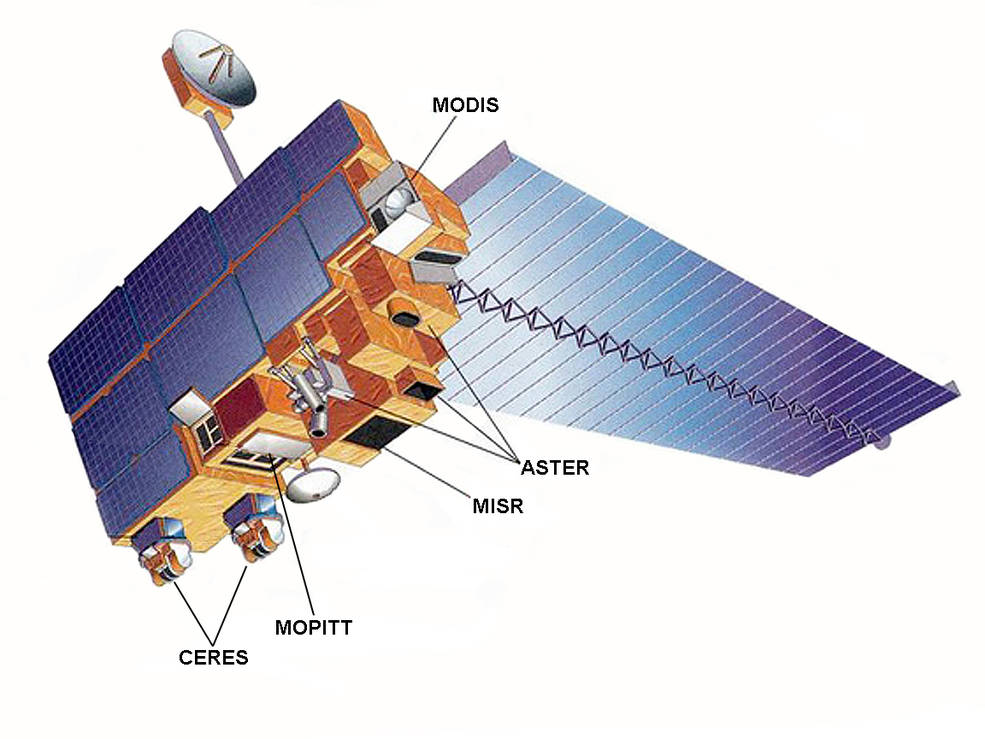
The Terra satellite. Image Credit: NASA
To help fill in the gaps, NASA’s Applied Science program is working with several partner institutions on a smartphone app called HABscope. The app, developed by Gulf of Mexico Observing System (GCOOS) researcher Robert Currier, makes it possible for trained water samplers (typically lifeguards who participate in Mote Marine Laboratory’s Beach Conditions Reporting System) to collect video of water using microscopes attached to their smartphones.
After recording, HABscope uploads videos to a cloud-based server for automatic analysis by computer software. The software rapidly counts the number of K. brevis cells in a water sample by using technology similar to that found in facial recognition apps. But rather than focusing on facial features, the software looks for a particular pattern in the movement of K. brevis cells.
K. brevis are vigorous swimmers, often using a pair of long, whip-like flagella to migrate vertically about 10 to 20 meters (33 to 66 feet) each day. They chart a zig-zagging, corkscrew-shaped path that allows the software to easily pick them out amidst the cast of other phytoplankton found in Gulf of Mexico water samples.
The data about K. brevis abundance at various locations along the coast is then fed into a respiratory distress forecasting tool managed by NOAA. “Respiratory distress forecasts can now be produced 1 to 2 times per day for specific beaches along the Florida Gulf Coast,” said Stumpf. “Previous to this project, these forecasts were issued at most twice a week, and only as general statements about risk within a county. The combination of earth observations with rapid field monitoring will increase the accuracy and usefulness of the forecasts.”
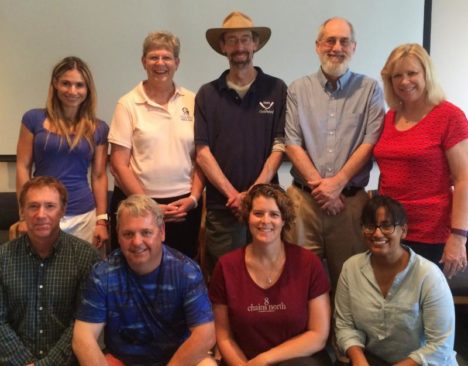
The research team that developed the HABscope app included oceanographers, ecologists, computer application developers, and public health experts. Photo Credit: Mote Marine Laboratory.
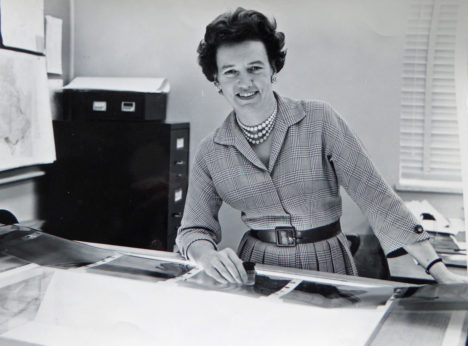
Betty Fleming, a cartographer, helped discover tiny Landsat Island with satellite imagery in the 1970s. Photo courtesy of Betty Fleming.
At age 86, Betty Fleming was on a cruise along the Labrador Coast of Canada. The ship was approaching an area all too familiar to her: a small island she helped discover when she was a cartographer for the Surveys and Mapping branch in Canada’s Department of Energy, Mines, and Resources.
“I want to tell you about a small off-shore island that we will be passing as we round the top end of Labrador on this trip,” wrote Fleming in her notes, which she used to deliver a presentation to her 90 fellow passengers on her leisure Adventure Canada cruise. “Landsat Island has garnered quite a bit of attention since it was first mapped in 1976. Don’t expect to see it though, as it is in the middle of an area of reefs and shoals.”
More than 45 years ago, Fleming was surveying the same waters, but via satellite imagery from the Landsat 1 satellite. Earth Resources Technology Satellite 1, later named Landsat, was an early Earth-sensing satellite launched by the United States. Before the satellite even launched, Canada built a receiving station to receive the satellite data for the orbits over Canada.
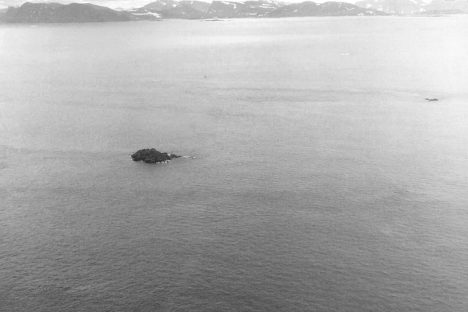
Aerial image of Landsat Island taken by David Gray on August 2, 1997.

This satellite image of Landsat Island captured on July 15, 2014, by the Operational Land Imager (OLI) on Landsat 8. The island spans no more than a pixel or two. Image credit: NASA Earth Observatory/Joshua Stevens
The 1970s was an exciting time for Fleming, as acquiring and analyzing satellite imagery was new and thrilling. As Canada received imagery from Landsat roughly every two weeks, Fleming had the task of seeing where the Department of Energy, Mines and Resources might use the imagery for mapping Canada, particularly for mapping wilderness areas and building new roads. At the time, the hydrographic charts for the northern coast of Labrador were also quite old and based on surveys by the British Navy in 1911 and on questionable notes made by passing sailors.
In those early Landsat days, Fleming was inspecting imagery of the coast from Landsat 1 when she spotted several small white specks. At first, she assumed they were icebergs, but some of the specks kept appearing in the same position over several images. She knew some of them had to be permanent features.
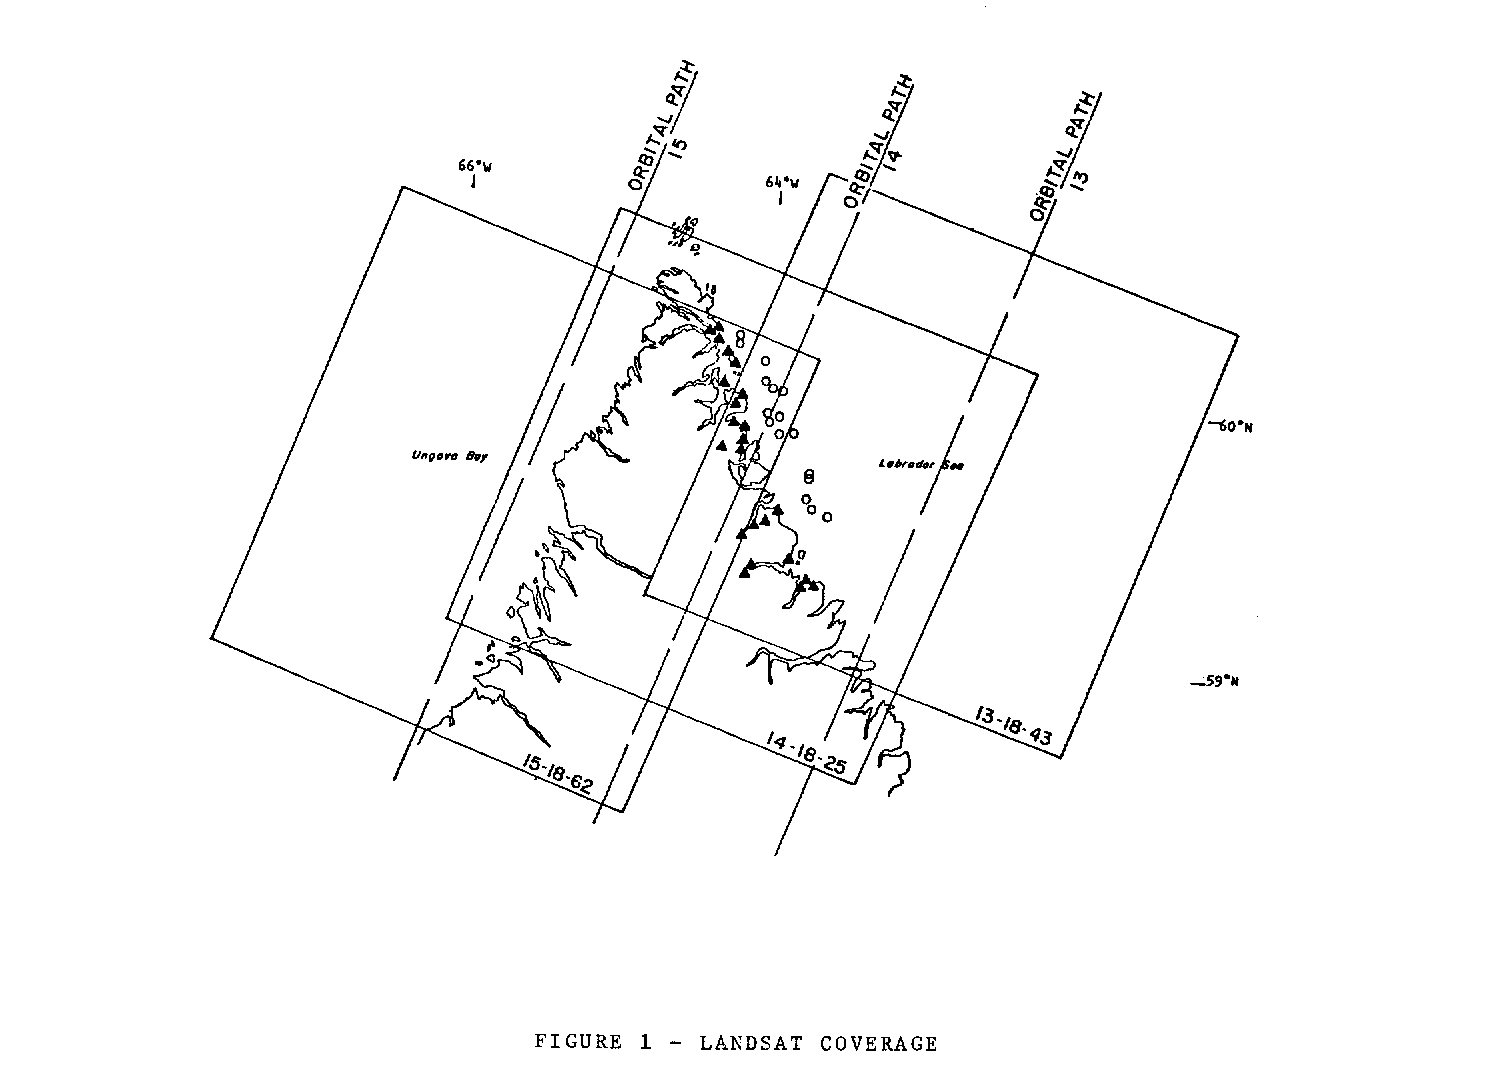
Landsat coverage of the survey area showing the overlap of the satellite images. The land area tended to be cloud-covered, forcing the selection of control points to the narrow coastal band as shown. Image courtesy of Betty Fleming.
She passed the information to the Canadian Hydrographic Survey Division, which sent the CCS Baffin to visit about 20 such locations in the following summer. Most of the locations were insignificant rocks partly submerged in the sea—Fleming called them “rocks awash”– but one of the spots was actually an island. Fleming and the Landsat satellite had discovered an uncharted Canadian island. It eventually became known as Landsat Island.

CSS Baffin survey of the coast of Labrador from 59°15’N to 60° 25’N during 1976 to chart offshore features and check reported rocks. Image courtesy of Betty Fleming.
Landsat Island was not too spectacular. It was rocky and only about half the size of a football field. From a satellite perspective, though, this island was notable because of its size – or rather lack of it. Earth science researchers were impressed that a satellite could detect such a small feature. The island was also interesting, says Fleming, because it had a bearing on the international boundary: it was the most easterly point of land at that part of the coast.
Fleming has never seen Landsat Island and does not expect to. She never went out on the ships or helicopters that were sent to verify the existence of the island. That section of the Labrador coast is “very dangerous,” and her tourist cruise in 2011 is probably the closest she is going to get to the place she discovered.
But that doesn’t faze her. Her accomplishments go beyond one island. Before her stint analyzing Landsat data, she was a pilot and camera operator. She studied at the newly formed Netherlands International Training Centre for Aerial Photography and Earth Sciences and became a specialist on the application of aerial photography to photogrammetric mapping—using photographs to measure and map areas. She also instituted a index map where images could be ordered by orbit number and image number, which was used in Canada.
Then there was simply being a working woman from the 1950s to 1980s, which Fleming says is a story in itself. As a married woman, she too-often ran into people who told her “You’ll leave to have a baby,” or “You’ll take a job from a man.”
When she chose to enter the all-male Surveys and Mapping Department, she had an entry level job at which they hired boys out of high school—despite the fact she had a university degree, post-graduate training, and experience in the aerial survey business. She always used the name “E.A. Fleming” when she prepared a technical paper because “using the name Elizabeth on any technical paper would have been a kiss of death. It would immediately be dropped in the editor’s waste basket without opening it.” She won several awards for her published papers, much to the chagrin of one man who did not find out she was a woman until she accepted an award.
“It took me 20 years to get to the level I should have been hired at, but that doesn’t change the fact that I really enjoyed my work,” wrote Fleming.
After a 30 year-long career in aerial photography and mapping and two happy marriages, Fleming is now retired at the age of 93 and resides in Ottawa, Canada.
Read more at:
The Island Named After a Satellite (NASA Earth Observatory)
Landsat Island (NASA Landsat Science)
A boatload of scientists headed out to sea this week. Actually, two boatloads. Both the R/V Salley Ride and the R/V Roger Revelle are taking part in a mission called Export Processes in the Ocean from Remote Sensing (EXPORTS).
Their plan: track what happens to carbon as it sinks from the well-lit surface of the ocean down to the dimmer “twilight zone” (between 650 feet and 3300 feet below the surface) using floats, gliders, and other scientific equipment. Then they’ll try to do the same thing using satellites.
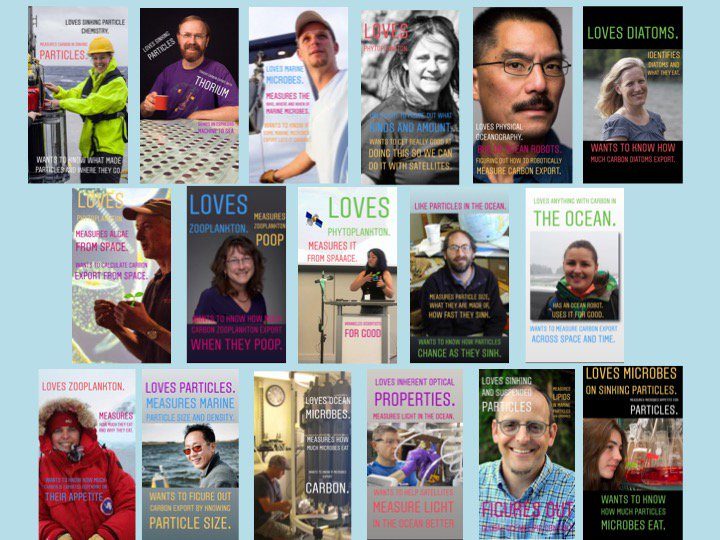
To help spread the word about the scientific work the team will be doing, oceanographer and blogger Kim Martini put together a fun set of #sciencetradingcards that people have been passing around on social media. Maybe she’ll roll out phytoplankton and zooplankton trading cards next?
Read more about the project from the mission website, a NASA Goddard press release, and the videos below. See a sample of the trading cards at the bottom of the page.
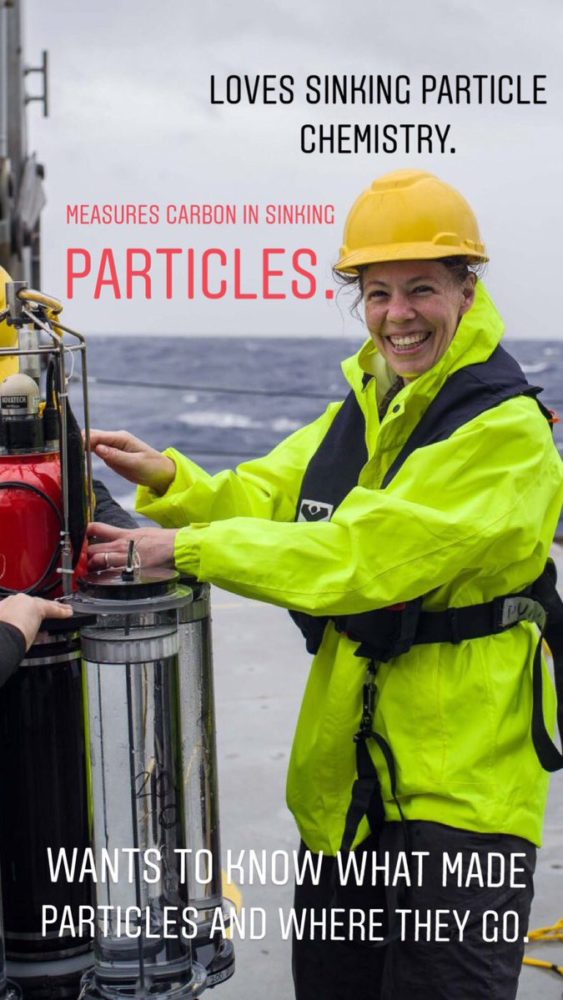
Project Title: Linking sinking particle chemistry and biology with changes in the magnitude and efficiency of carbon export into the deep ocean Project Lead: Margaret Estapa, Skidmore College
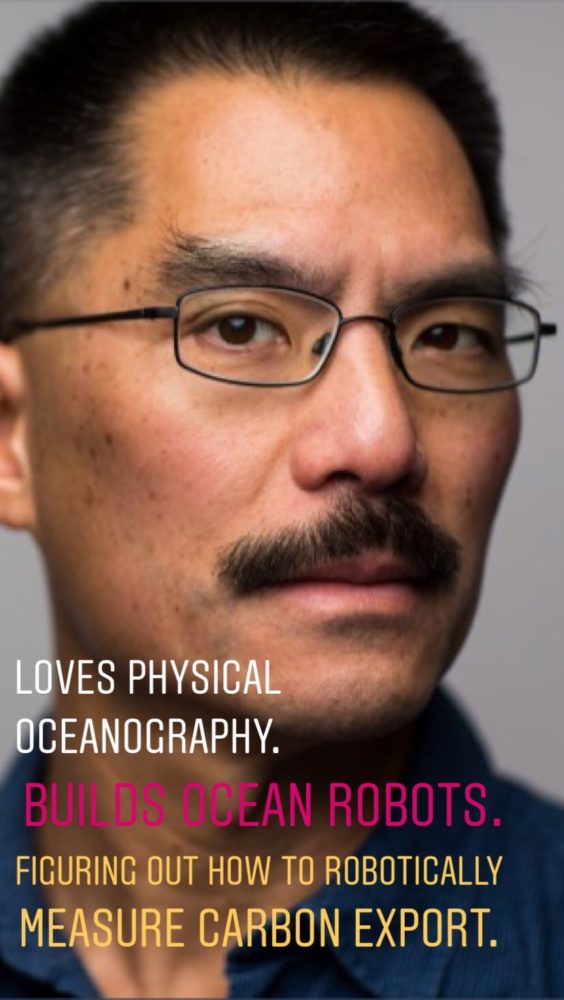
Project Title: Autonomous Investigation of Export Pathways from Hours to Seasons
Project Lead: Craig Lee – University of Washington
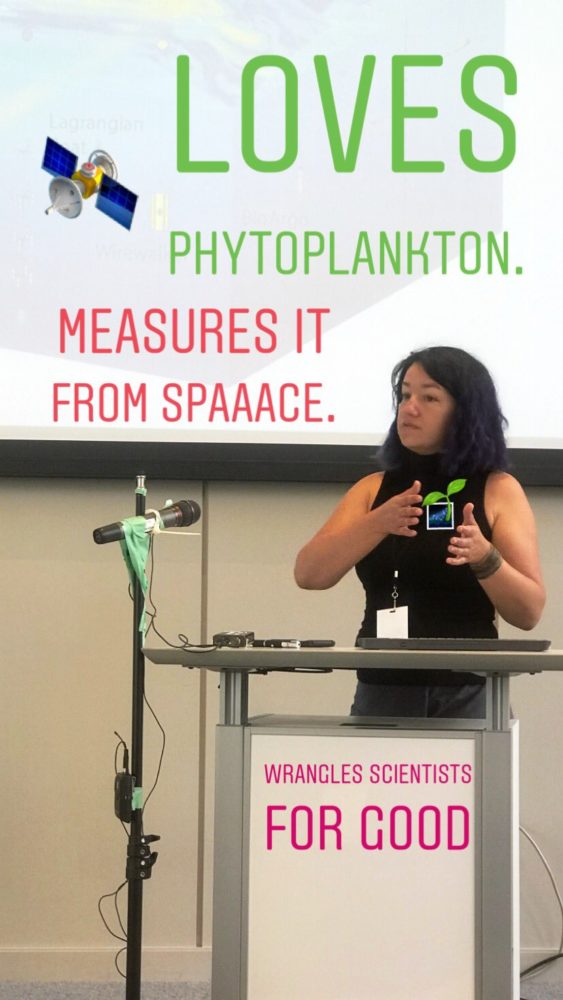
Ivona Cetinic – EXPORTS Project Scientist
NASA Goddard Space Flight Center/USRA
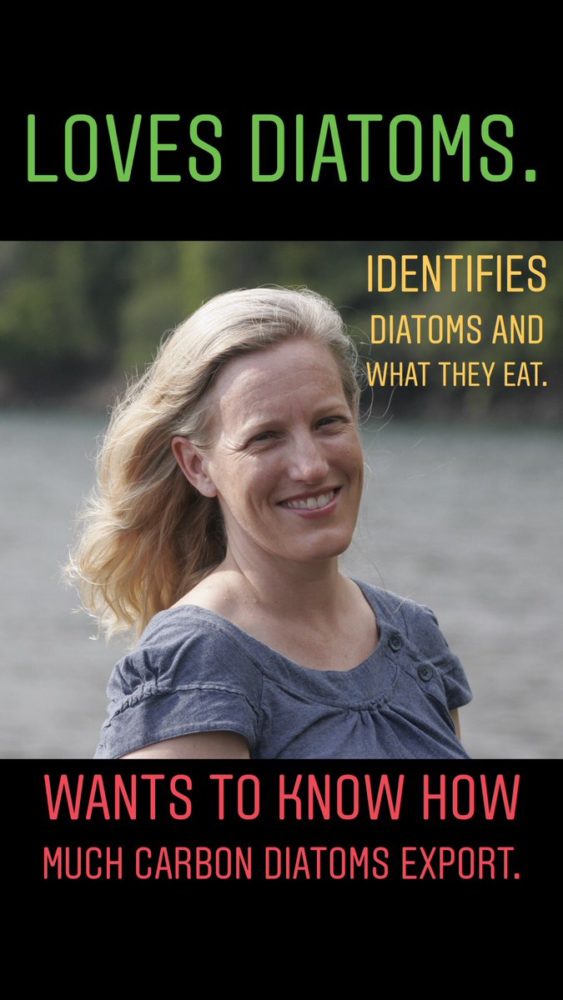
Project Title: Diatoms, Food Webs and Carbon Export – Leveraging NASA EXPORTS to Test the Role of Diatom Physiology in the Biological Carbon Pump Project Lead: Bethany Jenkins, The University of Rhode Island
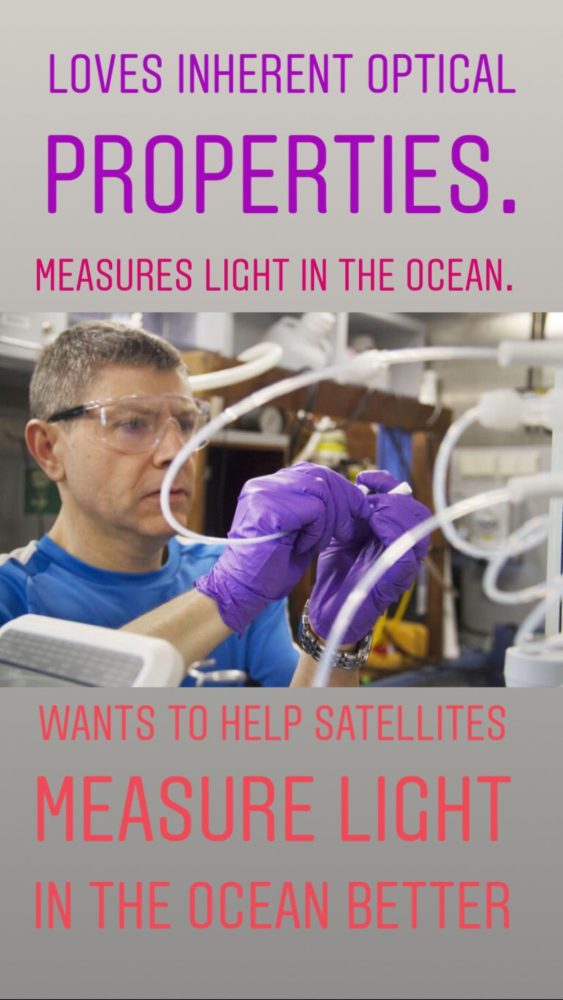
Project Title: In Situ Optics and Biogeochemistry in Support of EXPORTS Science Project Lead: Antonio Mannino, NASA Goddard Space Flight Center
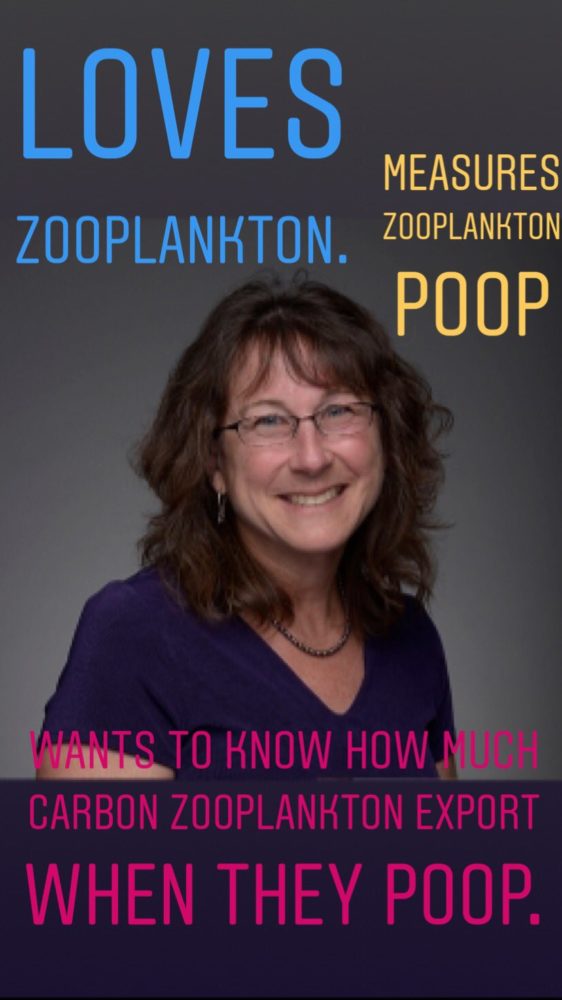
Project Title: Zooplankton-Mediated Export Pathways: Quantifying Fecal Pellet Export and Active Transport by Diel and Ontogenetic Vertical Migration in the North Pacific Project Lead: Deborah Steinberg, Virginia Institute of Marine Science
The Multi-angle Imaging SpectroRadiometer (MISR) team at NASA has opened its 30th Where on Earth? quiz.
Visit http://climate.nasa.gov/quizzes/misr_quiz_30
Here’s how it works: When you press “start,” you will be presented with nine multiple-choice questions (one question for each of MISR’s nine cameras) about the area shown in the image below. You are encouraged to research the answers using any websites or reference materials you like. You cannot go back to previous questions, so make sure of your answer before proceeding to the next one. If you answer all of the questions correctly, you will have a chance to enter for a prize. The deadline for entries is 4:00 p.m. Pacific Daylight Time on August 8, 2018.
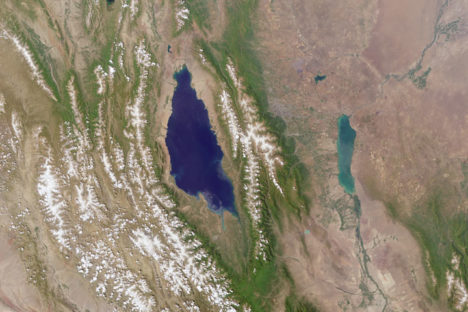
This natural color image was acquired by the vertical-viewing camera of the MISR instrument in July 2017 and represents an area of about 290 miles by 210 miles (470 kilometers by 340 kilometers). Note that north is not necessarily at the top.
The official quiz can be found at http://climate.nasa.gov/quizzes/misr_quiz_30
