
Really busy this week, so I’ll just post this slightly off-center satellite view of Mount St. Helens:
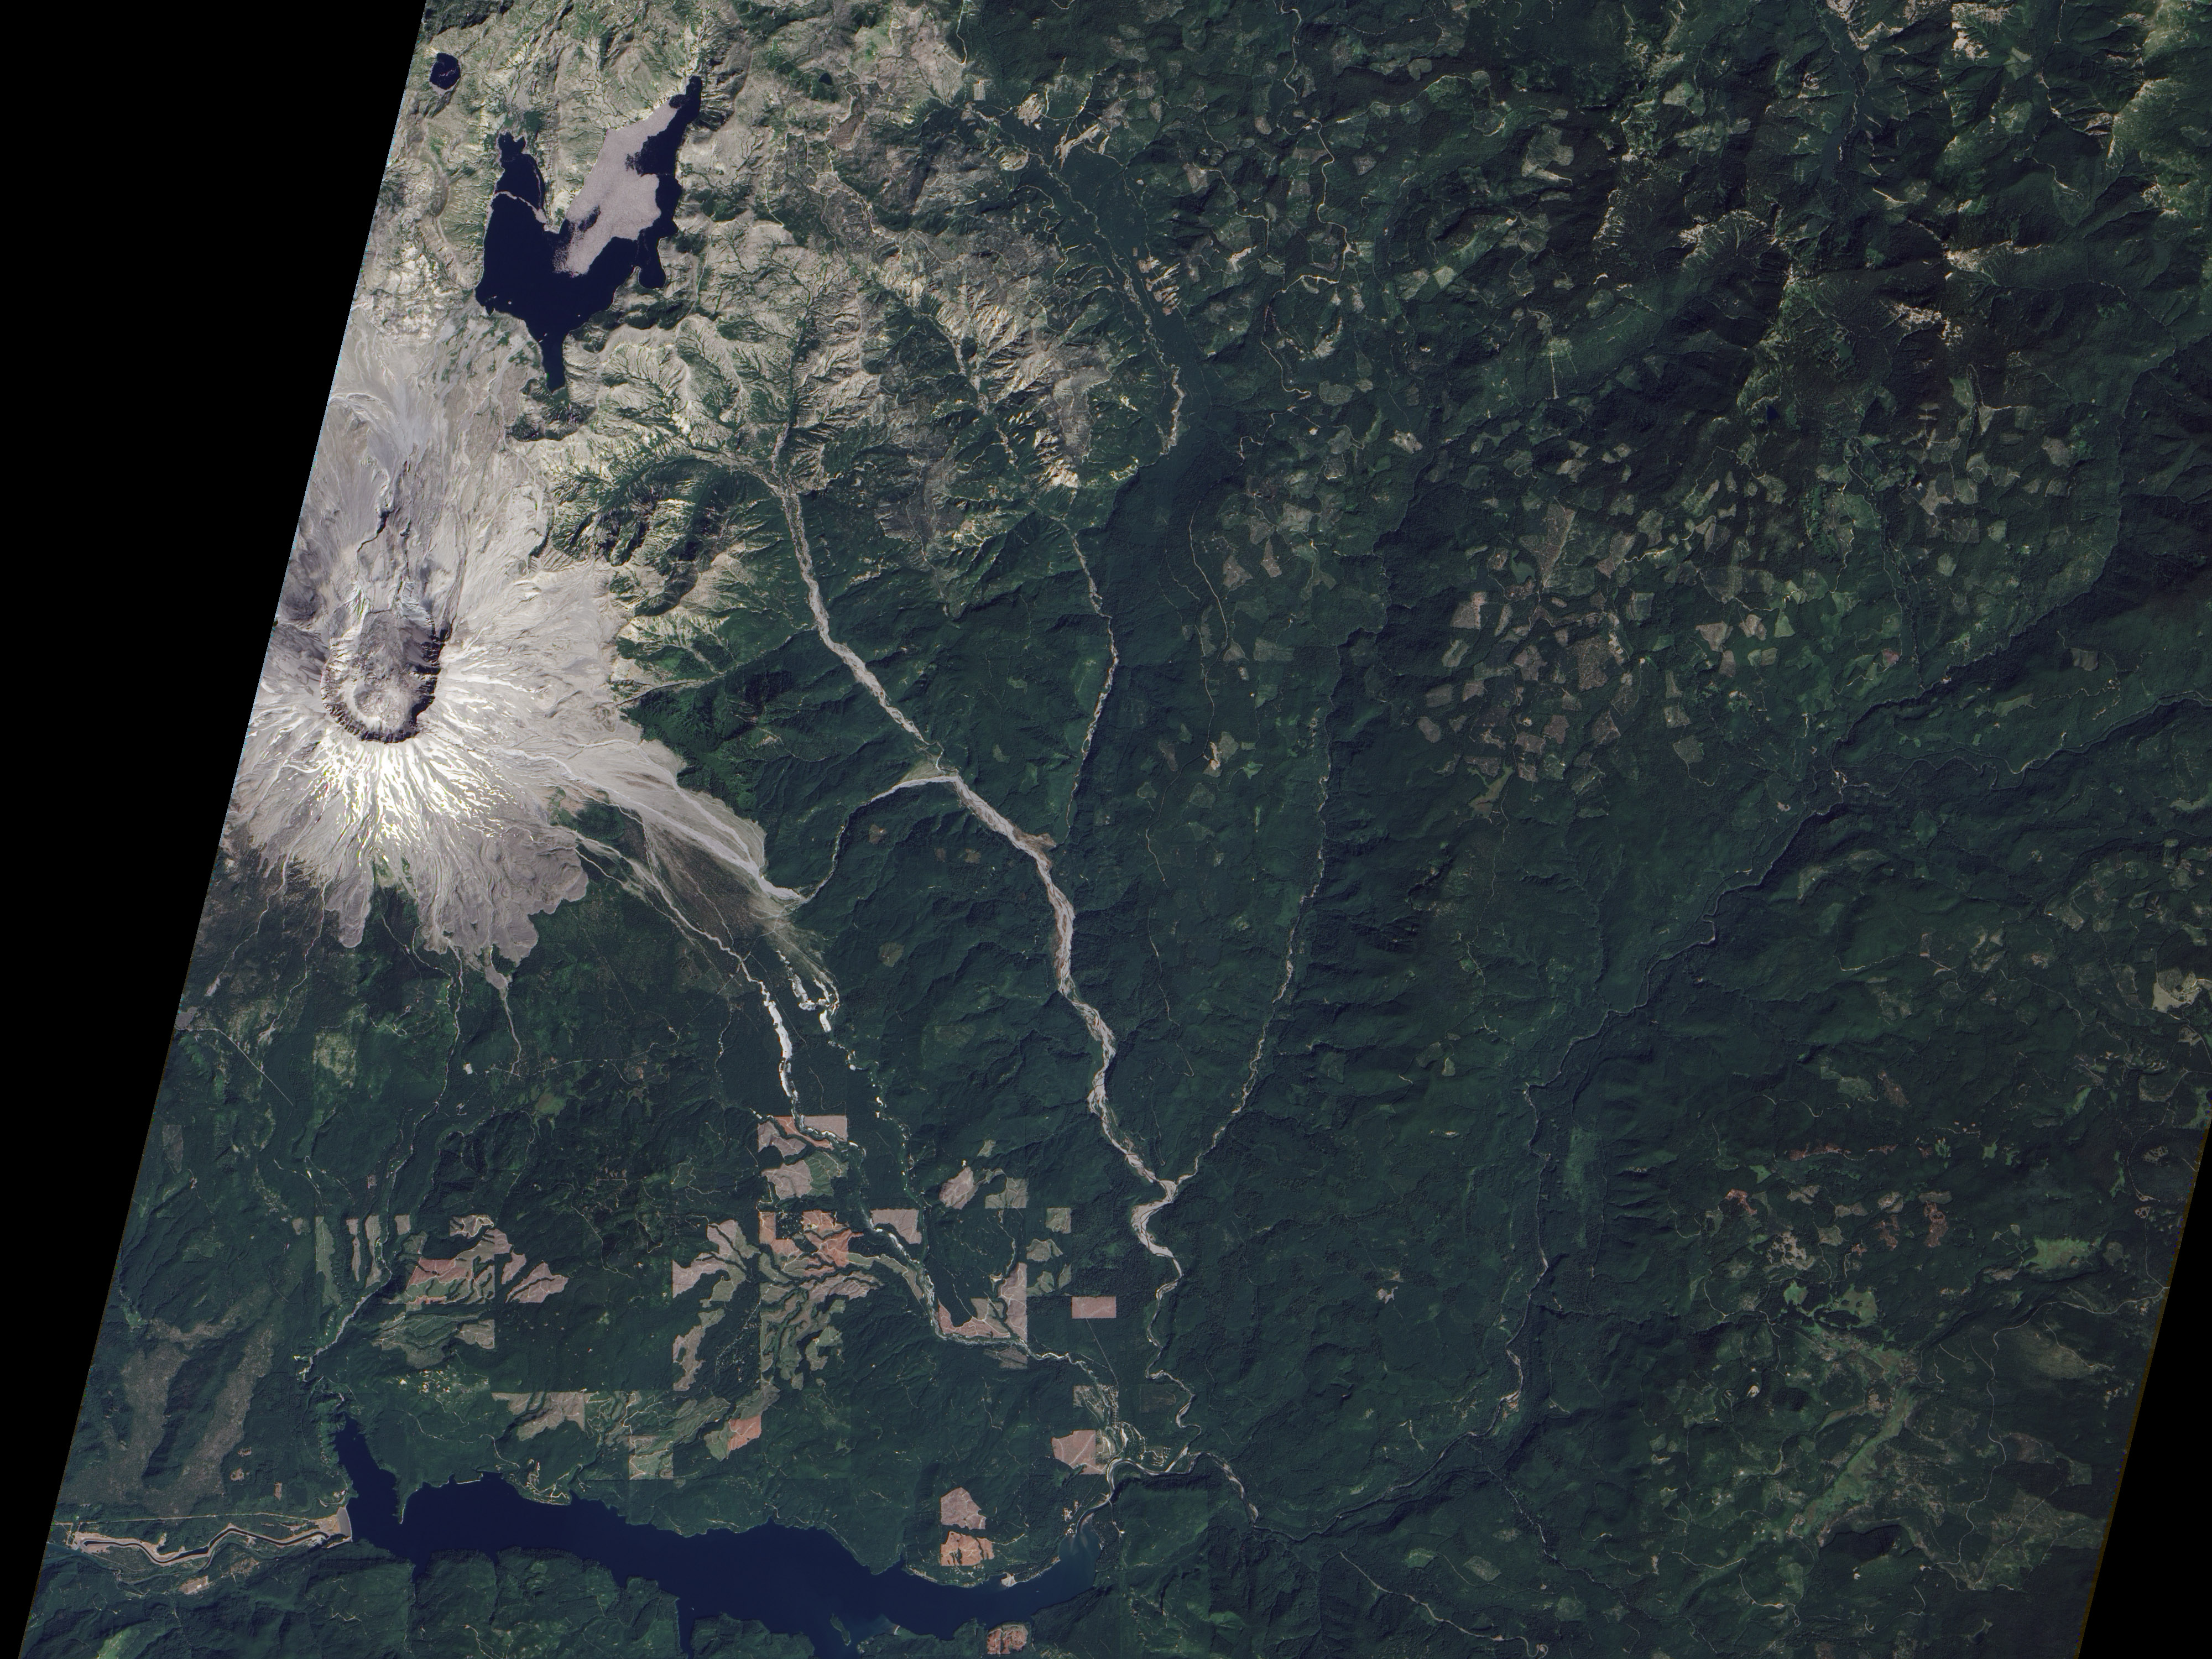
Click for the large version, and be sure to check out Devastation and Recovery at Mt. St. Helens to see the volcano and its surroundings every year from 1979 to 2009, including the immediate aftermath of the 1980 eruption. 2010 coming soon. (Image acquired by the Advanced Land Imager on board Earth Observing-1 on August 23, 2010.)
I’m looking for the earth observatory “ipcc 4th assessment projected temp rise” graph that EPA reprinted on here, citing you guys –
http://www.epa.gov/climatechange/science/futuretc.html
and I can’t find it.
Where can I find the Earth Observatory “useful images” repository (akin to globalwarmingart.com but updated regularly)?
Anna:
The graph is included in our Global Warming fact sheet on page 5: How Much More Will Earth Warm?
We make imagery to accompany specific stories, so we don’t really have a library of graphics of climate indicators like Global Warming Art (which is an excellent site, by the way).
(As a side note, this sort of request should really go through our comment form.)
I remember when she blew her top. I lived in Yelm, WA at the time and we only got about 1/4″ of ash. Just to give you an idea, Yelm is north and a little west of the mountain between Olympia and the cascades. Now for the power of the eruption, the prevailing winds are westerly off the coast and pushing things eastward, we could not even see the mountain on a clear day and we still got ash. My uncle lived about 45 minutes from us in Rochester and he got 3 inches of the ash.