Going to sea slows one down from the hectic sprint of modern city life and car travel. We travel slowly (~12 mph) over the vast Pacific Ocean. It is a five-day journey to get to our “office” in the Inter-Tropical Convergence Zone (ITCZ). The “work day” will change from 8 hours per day to 24 hours per day. There are no weekdays and weekends, only workdays and off-hours. As your blogger, I look into all the projects aboard ship and fill my day with writing, photographing action, and fact-finding for my reporting. I aim to provide a new blog four days-per-week (Tuesday-Friday). If needed I serve on a shift where extra hands are required.
A highlight of our departure from San Diego was being greeted by a large pod of small toothed-whales (porpoise/dolphin family). They seemed as curious of the ship as we were curious of them. We had slowed the ship as we passed the Coronado Island group (off northern Baja, Mexico) to deploy a 42-foot boom off the starboard bow. This is the support structure for Julian Schanze’s “salinity snake” that provides a “clean” intake of surface water outside the wake of the ship. I imagine the whales had never seen such an operation before!
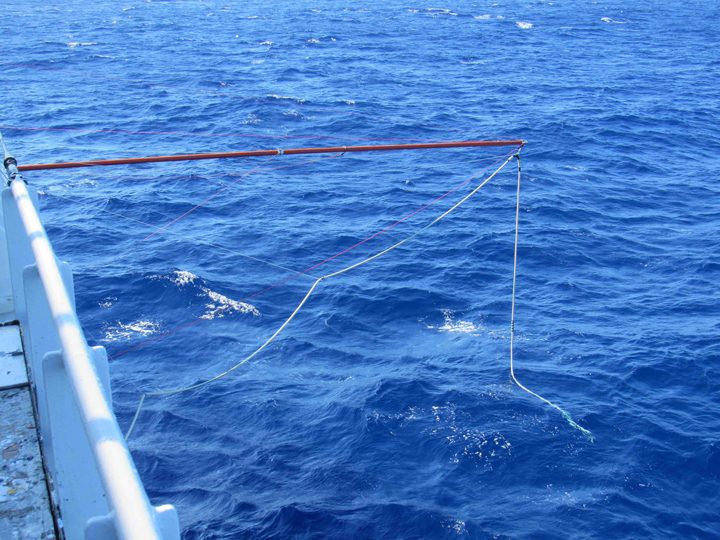
The 42-foot boom for the salinity snake.
The first two days at sea have been calm and sunny. This has been great for the newbies to get their sea legs. As far as I know no one has suffered severe sea sickness.
In the midst of our five-day commute we stop or slow down for training on occasion. Everyone needs to learn or refresh their knowledge on how instruments are deployed from the ship and safely recovered. This is the time to make sure all gear and personnel are ready for action. I will tell you more about the instruments and projects over the next month. Shipboard life is best when everyone is busy and every project is assisted to full success. During these initial days at sea there is much “cross-training,” you come to sea for one project, but you immediately train to assist on other projects.
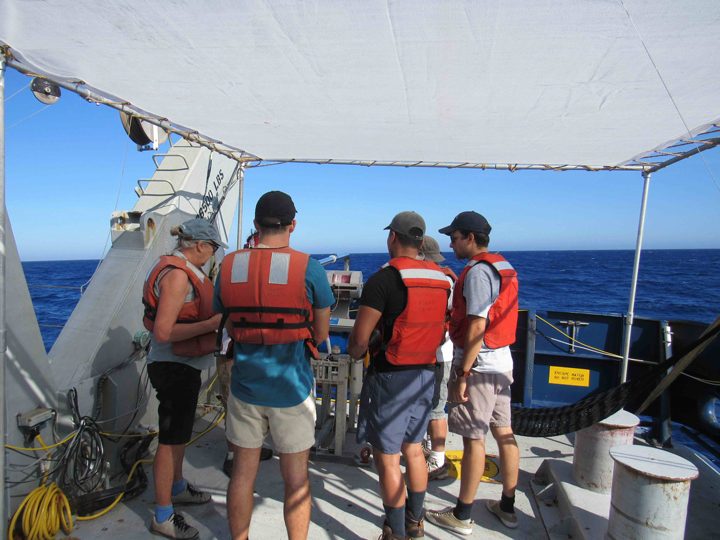
Training class at the underway CTD winch.
As we move slowly south to the tropics we also have some small assignments to accomplish on behalf of the oceanographic community. We will deploy some Argo floats along the 125W meridian. These temperature and salinity profiling devices join a global array of nearly 4000 floats that monitor the upper 2000m of the ocean.
We know our 24/7 work begins when we reach 11N, 125W and begin the process of recovering the NOAA mooring that has been there for the last 13 months. There are three moorings in the SPURS-2 array and all will be recovered on this voyage. Generally, these moorings become teeming islands of life in the open ocean environment, attracting their own ecosystem of fish. So, fishing gear will also be at the ready and we can expect tuna and mahi-mahi for dinner the day of a mooring recovery.
Finally, it looks like there will be some Halloween celebration aboard R/V Revelle. The Captain has brought pumpkins for a carving contest. I hear that some people have costumes at the ready. I am sure some unique nautical and oceanographic twists can be brought to Halloween. We shall see. Never underestimate the imagination of people confined to a ship for five weeks!
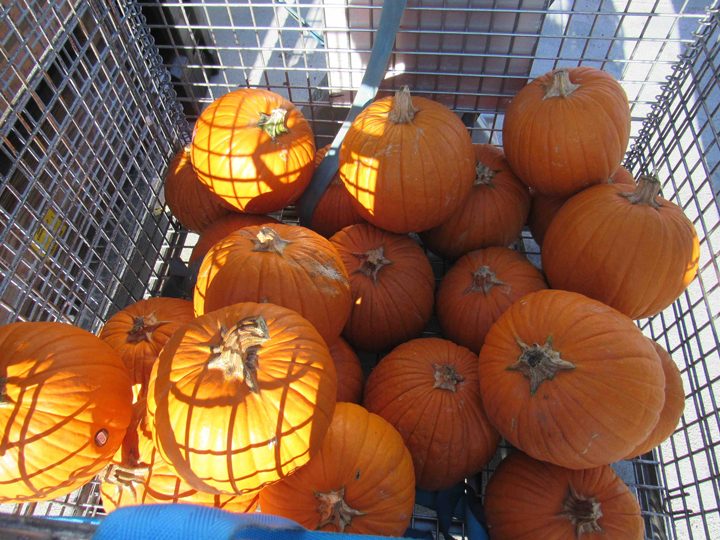
Pumpkins at the ready for the Halloween pumpkin carving contest.
Muffin O’Clock
Through Einstein’s Theory of Relativity, it was discovered that time is not a static measurement, rather it is relative to the observer. Somewhat similarly, time becomes both integral and meaningless while on a boat, completely relative to the scientist’s schedule. Time is integral to the individual with their stopwatch waiting for the precise second in which they can stop their experiment. On the other hand, we have been on a ship for 22 days where weekends are only a fleeting memory and days of the week hold no meaning. How can one keep track of the day?
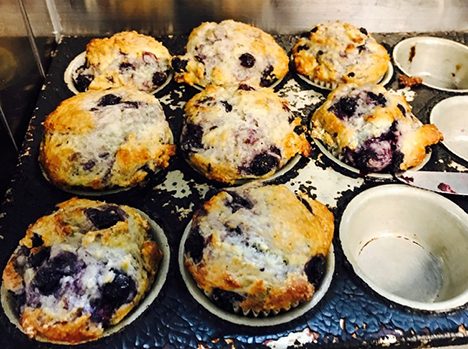
A fresh tray of blueberry muffins serve on board the R/V Atlantis
Food. While some view meal times solely as a source of nourishment, meals provide one of the only consistent ways we can keep track of our day on the ship. For example, at approximately 6:00 am every day, the cooks will place a freshly baked pastry of some kind in the galley. This is deemed muffin o’clock and you will often hear excited whispers and guesses around 5:30 a.m. on what could they be cooking up next. Biscotti, muffins, coffee cake, and scones are just a few of the impressive things the cooks on the Atlantis, Mark and Carl, have served at muffin o’clock. This is followed by breakfast at 7:30, lunch at 11:30, cheese o’clock at 3:00, and dinner + dessert at 5:30. For clarification, cheese o’clock is when cheeses, crackers, and sometimes smoked fish are placed in the galley where scientists and crew can feast together.
Food alone can not keep a ship full of sleep deprived scientists being productive. One of the most cherished traditions on the ship, in my humble opinion, is Coffee Club. I can not trade mark this, for there are a variety of coffee clubs on the ship that meet in a variety of locations and at various times. Science, politics, and religion are all fair game at these times of replenishment and all are welcome. When you see an individual with incredibly dark bags under their eyes but a little pep in their step, you can trust they just finished with coffee club and are about to be productive.
Living and working on a ship for 25 days straight is an incredible, rewarding, and often strange experience. Thankfully, the amazing scientists, crew, and cooks work together to create a fantastic environment so that exciting discoveries can be made in the air and sea.
P.S. If I didn’t make it clear enough, special thanks to Mark, Carl, and Tanzy for the amazing meals and clean-up!
Written by Savannah Lewis
I had the good fortune to join the crew of the NOAA P-3 “hurricane hunter” plane that flew into Harvey on 25 Aug 2017 shortly before it made landfall in Texas. We made six pairs of eyewall penetrations. The maximum surface level winds continued to grow with each successive one as we witnessed Harvey’s rapid intensification from a Cat 2 to Cat 4 hurricane. We were able to capture much of that dynamic transition, using continuous radar and radiometer remote sensing measurements plus frequent in situ measurements by dropsondes. These will be used to help calibrate and validate our measurements by CYGNSS, which have been ongoing since Harvey first started to develop earlier in the week. Following is a description of my experience that day.
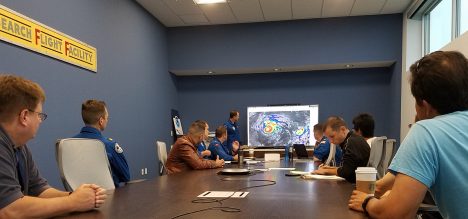
Pre-flight briefing about an hour before take-off at 10:00 EDT.
The flight out to Harvey started ominously, with a detailed safety briefing before take-off for first timers like myself about things like the difference between what to do if we have to ditch in the ocean with more than 3 minutes of warning vs. less. The hurricane hunters have been flying for decades and have never had to ditch, so this gives you some idea of how thorough and detail oriented the crew is. After the safety briefing, the flight director mustered the full crew to discuss some last minute mission logistics and concluded with this: “Harvey is currently a Cat 2 hurricane and is expected to undergo RI (rapid intensification) while we are in the air, then head for landfall tonight near a major population center. Days like today are why we are here. Now let’s go do our jobs.” We were “wheels up” 15 minutes later at 10:00 EDT.
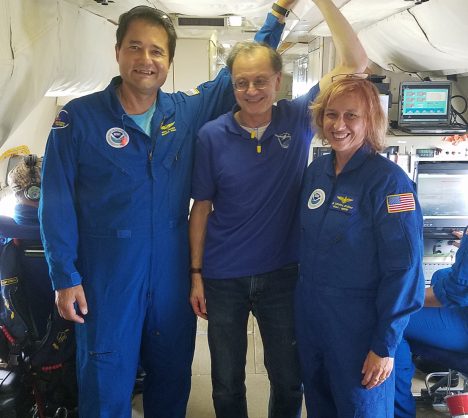
Me with two of the CYGNSS science team members, Dr. Paul Chang (left) and Dr. Zorana Jelenak (right), who were airborne mission scientists on the flight.
The two hour ferry flight from Florida across the Gulf of Mexico wasn’t much different from any commercial flight. But as we approached Harvey’s outer rain bands, things changed. Everyone strapped into their seat with four-point restraints across their chest and lap. Headsets were on and a steady chatter began between the flight director and the crew operating the various remote sensing equipment and dropsondes. A real time display from one of the radars showed the rain distribution within a 200 mile radius around us. Heavy rain spiraled out in bands from a bright circle to the south of us at the edge of the image. The plane banked to the south and headed toward that circle – the eyewall. The flight became more turbulent as we approached it. Occasionally, the bottom would drop out from under the plane and I would find myself lifted up off my seat, held down only by the straps. The flight director called it “sporty plus”. The worst of the turbulence occurred out in the spiral rain bands. Flying conditions became smoother as we approached the eyewall, but the skies grew progressively darker and, flying at 8000’ altitude and well below the freezing level, heavy rain streaked across the windows. A second real time display, from a microwave radiometer, showed the surface wind speed directly below the plane. It had been increasing steadily since we headed south into the inner core of the storm. Then we entered the eyewall. The rain became even more intense, the surface wind spiked above 51 m/s (~115 mph), and the skies darkened even more. Then, in the next minute, the interior of the plane grew suddenly brighter and the turbulence disappeared. Looking out the window, I could see the ocean below us and blue skies above. The radiometer showed that the surface wind speed had dropped below 10 m/s and the radar image drew a bright circle of intense rain all around us with nothing in the middle. We were in the eye of Harvey.
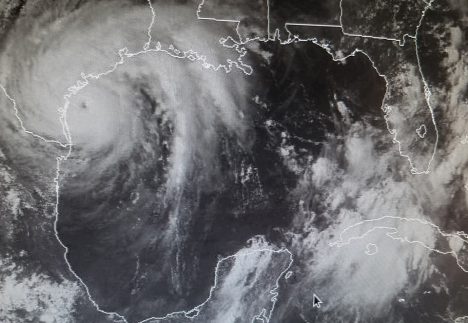
A visible image taken by the GOES satellite at 15:15 CDT as we were flying through the eye.
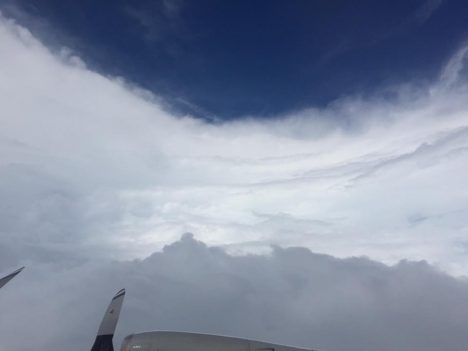
Looking out the window at 8000’ in the eye of Harvey (photo by Brad Klotz).
Over the next few hours, we conducted a total of six pairs of eyewall penetrations, each time circling to a new azimuth angle before entering the eye again in order to map out as complete an image of the storm structure as possible. With each successive penetration, the maximum winds encountered in the eyewall kept growing. We were experiencing firsthand Harvey’s rapid intensification phase as it strengthened all around us.
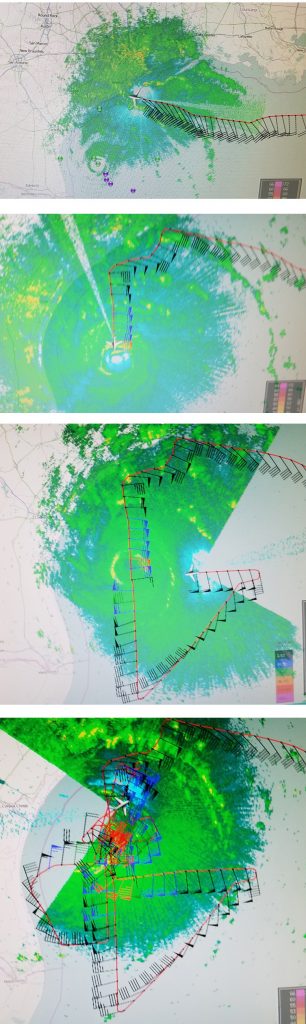
Screen captures of the flight line of the mission: (top) As we were ferrying out to the storm, when we got our first look at the eye (toward the south) with the airplane’s radar. (next) Starting our first (north-to-south) eyewall penetration. (next) Lining up for our second (east-to-west) penetration. (bottom) After our last (sixth) penetration, as we prepare to ferry back to FL.
Our measurements were radioed back to the National Hurricane Center in Miami as they were made, to be fed into their forecast models and to be forwarded to the media and emergency responders to let them know what Harvey had become and to help them prepare for what was headed toward Texas. Finally, as our fuel began to run low, we left the storm and returned back across the Gulf to our base at the NOAA Airborne Operations Center in Lakeland, FL. Minutes before landing, we received confirmation from the NHC that Harvey had been officially classified as a Cat 4 hurricane.
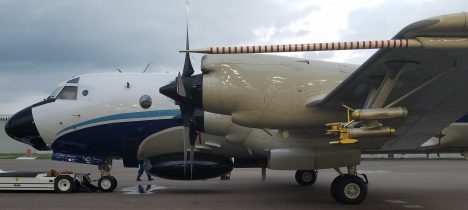
The P-3 right after we landed. Lots of hurricane remote sensors are visible on the wing and underside of the fuselage. She took very good care of us.
Trying to sleep on a trampoline while somebody is jumping on it – this is how it feels during many nights at sea as the ship zig-zags in an imaginary box around our drifting instruments in the North Pacific during winter. This is when biological activity is lowest, but clearly there is no absence of physical forces, such as waves. Clearly.
The aim of this expedition is to find phytoplankton and measure their characteristics using light detectors, cameras and microscopes. From my perspective as an oceanographer who uses satellite data to explore large scale physical forcing of biology, this is a great chance to think about the smaller-scale forcing mechanisms that supply nutrients to the phytoplankton. And I am glad to get acquainted with the optical and biological instruments and methods being used and tested here at sea.
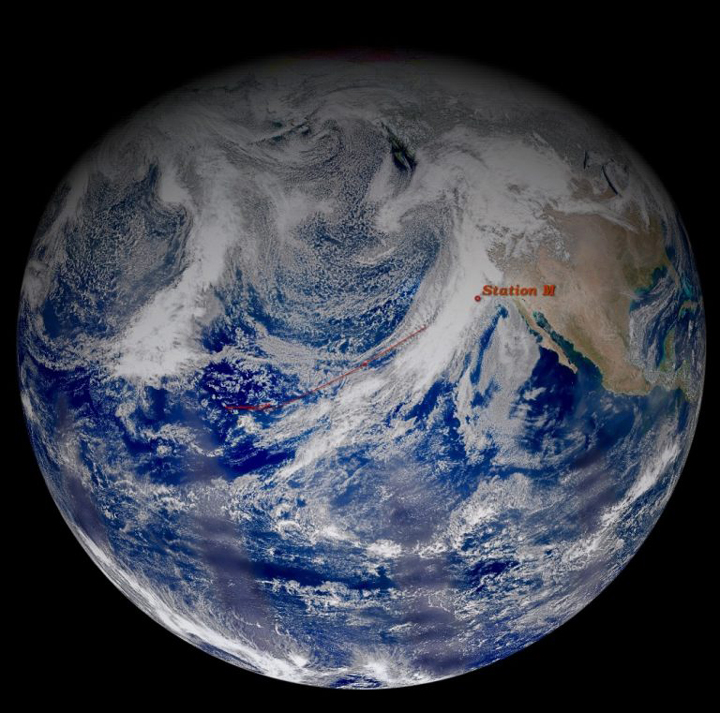
Hemispheric view by Suomi-NPP VIIRS on Feb 9, 2017 in true color. Clouds and airborne particles are white; ocean, blue. The ship’s track is shown in the red line. Station M is our last sampling site. NASA/ Norman Kuring
We began the campaign near Hawaii at the end of January in the North Pacific subtropical gyre, which has a predominate slow-moving circulation pattern that causes nutrient-depleted surface water. We experienced plenty of swell from distant storms – lab equipment had to be tied down, and chairs slid across the galley. Still, nutrient-rich deep water remained far below the well-mixed surface waters.
The water was exceptionally clear. Sunlight penetrated deeper than 150 meters (500 feet). In spite of the dearth of nutrients, our imaging systems revealed some phytoplankton! They appeared malnourished, but surprisingly diverse nonetheless.
In the absence of strong currents or other flow patterns, the Wirewalker instrument drifted westward making daily clockwise loops with the Earth’s rotation. I was excited to see its path mapped with inertial oscillations so clearly visible. Although they are always present, it is rare to see them this obviously as they are usually hidden by stronger forcing.
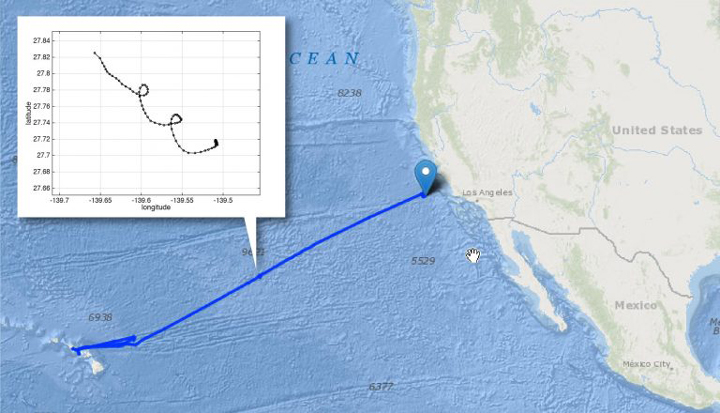
A plot of the Wirewalker’s track as it drifted freely at our second site for three days. Each point in the plot represents one hour. SOI/ Melissa Omand
The end of our sampling campaign is approximately 250km (150 miles) west of central California over a site called ‘Station M.’ This location is typically more productive, being in the California Current that brings cooler water southward from the subpolar gyre.
Additionally, we arrived between low pressure frontal systems that have been pummeling the west coast with strong winds, rain and snow over the past month. These strong weather systems cause wind-mixing at the surface of the ocean, bringing nutrients up from depth. Sampling revealed a warmer, fresher top 30 meters (100m) above cooler, nutrient-rich water.
Immediately, the instruments monitoring phytoplankton and nutrients began registering significantly higher quantities than anything we saw earlier in the expedition: even more diverse and even more abundant. Collectively, this team has gathered an amazingly rich data set of measurements and images that makes the discomfort of sleeping on a trampoline all worth it.
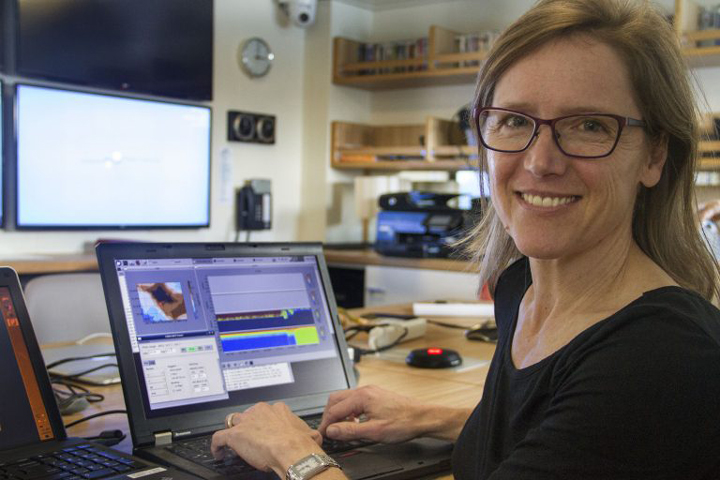
Stephanie Schollaert Uz monitors the speed and direction of water flowing under the ship with the Acoustic Doppler Current Profiler. SOI/ Monika Naranjo Gonzalez
At the unholy hour of 0400, I find myself on the aft deck of the world-class research vessel Falkor, bubbling with excitement stemming from a unique combination of four shots of espresso, generally being a morning person, and, most importantly, preparing to test an experimental device that I have put my blood, sweat, and tears into. As I bear-hug my newly collected bucket full of seawater on the rocking transit back to the wet lab, I take a moment to silently congratulate myself on the superb display of stamina and posture; it appears that my sea legs have finally decided to make an appearance. The sun will be coming up soon. It’s a Bob Dylan kind of day. Time to turn up the music and get to work.
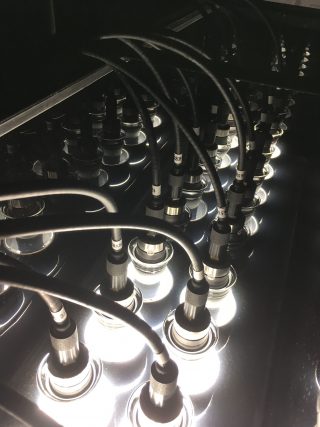
Ryan Vandermeulen, optical oceanographer, is testing this instrument at sea for the first time. The experimental “photosynthetron” (a.k.a. electro-squid 4000) serves as an incubation chamber for seawater samples. SOI/ Vandermeulen
In addition to being an eclectic lab DJ, one of my roles as a scientist aboard this righteously amazing research vessel is to investigate the rates of biological activity among microscopic communities within the ocean. The invitees to this epic microbial festival include bacteria, viruses, zooplankton, larval fish, and phytoplankton (algae). The photosynthetic members of this microscopic plankton community (PHYTO-plankton) are the base of a complex ocean food web, and have a large cascading ecological impact on the abundance and diversity of fisheries that we depend on. In addition, phytoplankton play a significant role in the global cycling of carbon, as well as the production of oxygen we breathe. Just like the plants in your garden, phytoplankton utilize carbon dioxide and micronutrients in the seawater – along with various light harvesting pigments which capture sunlight at different wavelengths – to create new cell bodies.
A byproduct of this magnificent life-giving process of photosynthesis is the production of oxygen, which we measure with great precision as a proxy for the amount of carbon that has been fixed into organic matter. The remaining (non-photosynthetic) members of this microbial party are not particularly polite dinner guests and have a tendency to exploit the kindness of our fearless photosynthetic community by eating the food that the phytoplankton have dutifully prepared, namely themselves (phytoplankton bodies) along with their subsequent secretion of dissolved organic matter (zooplankton are quite the sloppy eaters). We measure this microscopic massacre in the form of oxygen consumption, because, like us, these microbial heterotrophs need oxygen and organic matter that phytoplankton produce in order to live. Collectively, the ocean acts as one breathing organism as this process plays out, silently taking in copious amounts of carbon dioxide from the atmosphere and giving us oxygen that we breathe. This balance (or lack thereof) of carbon/oxygen uptake versus production lends us insight into the overall health or metabolic status of an ecosystem, in a way similar to taking the pulse of your body.
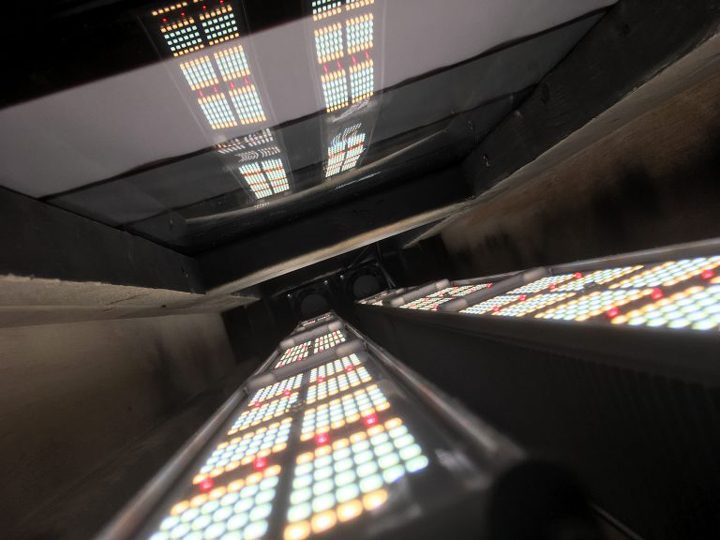
The Various light levels of the photosynthetron simulate different light conditions through the day, and the subsequent oxygen production/consumption is measured using optical sensors. SOI/ Vandermeulen
One of the more confounding elements of studying oceanography is dealing with the fact that many measurements only tell us something about one very specific time and place in a very large and dynamic ocean. So, in addition to these experiments, we are monitoring the “color” of the ocean with continuous underway measurements of the reflectance of sunlight from the water. As sunlight hits the ocean, phytoplankton are capturing some of this light for photosynthesis, and they imperceptibly change the color of the water as light scatters back from the sea. Out in this near-barren desert of photosynthetic activity, we use a very precise radiometric measurement of over 100 wavelengths across the ultraviolet/visible spectrum to detect these subtle changes. As a NASA scientist, my other research life consists of using data from ocean-observing satellites that monitor changes in the color of the ocean over the entire globe every day. By understanding more about the link between biological activity that I’m measuring in the lab, the types of phytoplankton in the water, and how this changes the color of the ocean, we can refine how we monitor these processes from space, and thus increase our understanding of carbon cycle dynamics on a global scale. Just to re-iterate, we are literally monitoring the activity of microscopic organisms that are too small to see with the naked eye with a telescope orbiting our planet at over 15,000 mph to study climate scale processes. I think that’s pretty neat.
It’s been a long day, so I am going to wind down, grab my guitar, and serenade the sunset. They say if you sing to plants, they grow better, so there is some scientific merit to this ritual, mind you. Incidentally, our artist-at-sea, Kirsten, has inspired me through one of her onboard art + science seminars to try and take a more careful and purposeful look at the world around me. I will temporarily suspend the thought of Rayleigh scattering and radiative transfer equations as I watch the sun’s rays extend across the horizon. For now, I’ll just listen and observe.
