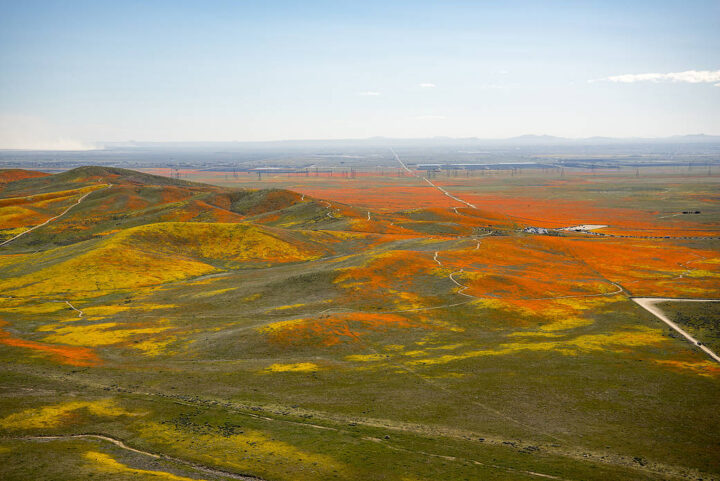
When we published a few Landsat images of wildflower super blooms in California in March 2019, you may have had to squint a little to find the flowers. From 705 kilometers (438 miles) above Earth’s surface, at the 15-meter-per-pixel resolution of the Operational Land Imager on Landsat 8, the flowers tend to blend with the hues of the desert.
Not so with this colorful photograph of poppies and other wildflowers in Antelope Valley that was taken from a T-34 airplane. The picture was shot by NASA Armstrong aerial photographer Jim Ross, who may have one of the coolest jobs at NASA. Watch the video below to find out how he got it.
Meanwhile, remote sensing scientist Iban Ameztoy was inspired enough by the aerial photos to pull Sentinel-2 satellite imagery of the same bloom and share them on Twitter.
Want more satellite imagery and aerial photography of the super bloom in California? NASA Earth Observatory and NASA Armstrong have you covered.
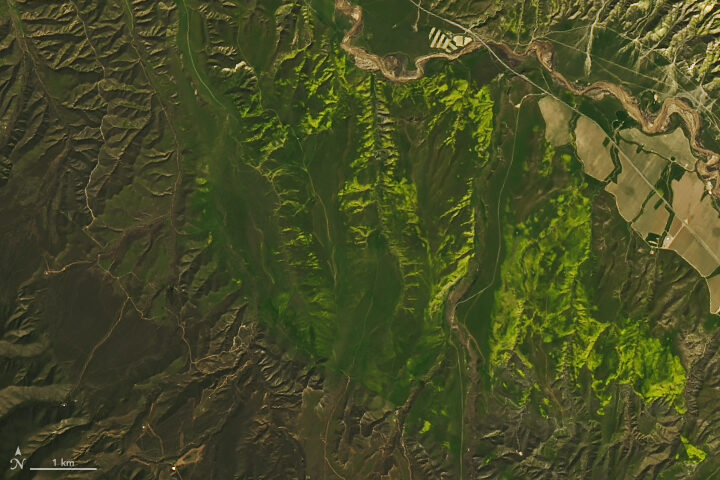
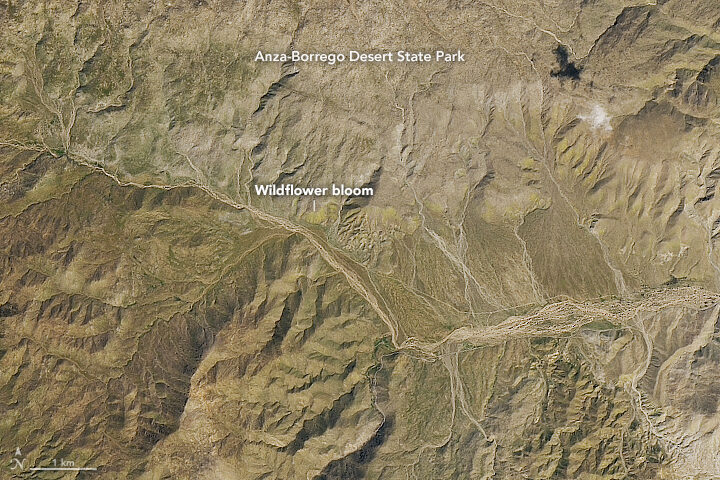
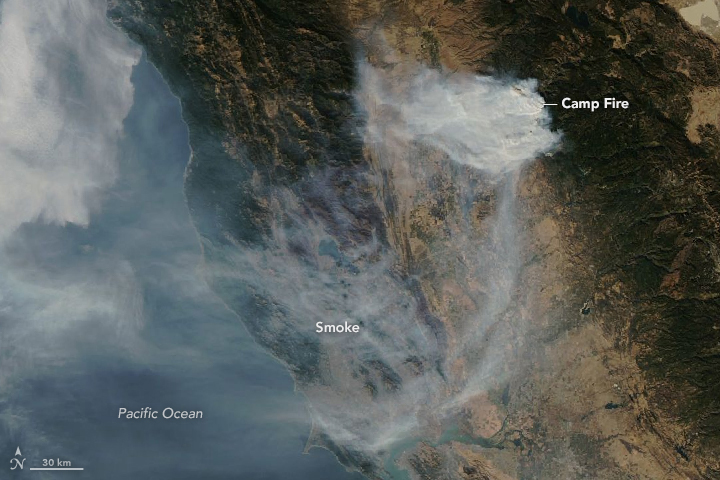
Image Credit: NASA Earth Observatory/Aqua/MODIS
As powerful downslope winds sent the deadly Camp Fire raging through bone-dry vegetation in northern California on November 8, 2018, sensors on the ground and in space began to detect sharp increases in air pollution downwind of the inferno.
From space, the Moderate Resolution Imaging Spectroradiometer (MODIS) and Visible Infrared Imaging Radiometer Suite (VIIRS) sensor observed expansive smoke and aerosol plumes over California’s Central Valley and coast soon after the fire began. Likewise, the Ozone Mapping Profiler Suite (OMPS) on Suomi NPP observed unusually high aerosol levels, and the Measurement of Pollution in the Troposphere (MOPITT) on Terra picked up strong carbon monoxide signals from the fire.
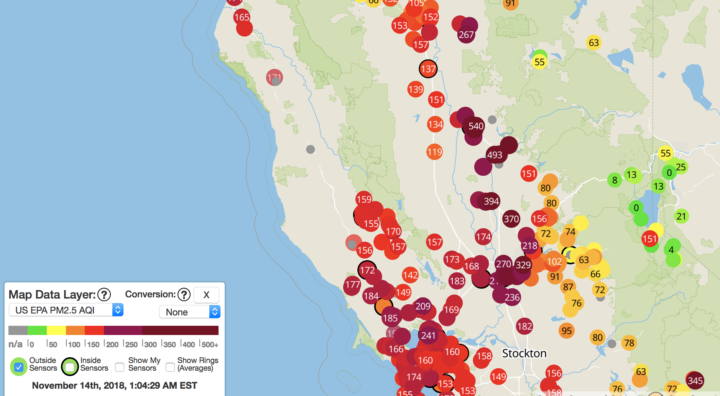
Image Credit: Purple Air
Meanwhile on the ground, atmospheric scientists Pawan Gupta, Robert Levy, Prakash Doraiswamy, and Olga Pikelnaya have been keeping a close eye on air quality data from a network of low-cost sensors distributed throughout the region. These sensors measure the mass concentration of fine particulate matter (PM2.5). Some stations measured PM2.5 values higher than 500 micrograms per cubic meter, which is about 40 times higher than the level considered safe to breathe.
#fires and #smoke in CA continue deteriorating air quality in the region – satellite images from @NASA_NPP #VIIRS #OMPS and low-cost sensor network @purpleairq shows hazardous conditions @NASA_HAQAST @NASAEarthData @iccialtopenburn @Open_AQ @R5_Fire_News @USRAedu @SanGasso pic.twitter.com/lhO08wUg4i
— Pawan Gupta (@pawanpgupta) November 11, 2018
“On November 9th, due to favorable wind direction, most of the smoke was confined to a smaller region north of San Francisco, but the wind direction changed on the 10th, and smoke spread over a much larger region,” noted Gupta, who is based at NASA’s Marshall Space Flight Center and works with NASA’s SERVIR and ARSET programs. “On the 11th and 12th, the wind direction again changed, and most of the smoke blew over the ocean.”
Gupta is involved in an ongoing effort to deploy and test low-cost commercial air quality sensors to see how well their measurements compare with standard EPA measurements and NASA satellite observations. The ground-based sensors that are part of official state and federal government observing networks cost several thousand dollars each, but the new generation of sensors cost just a few hundred dollars—cheap enough that Gupta thinks they could proliferate and potentially be used to help fill in crucial gaps, particularly in countries with few air quality sensors.
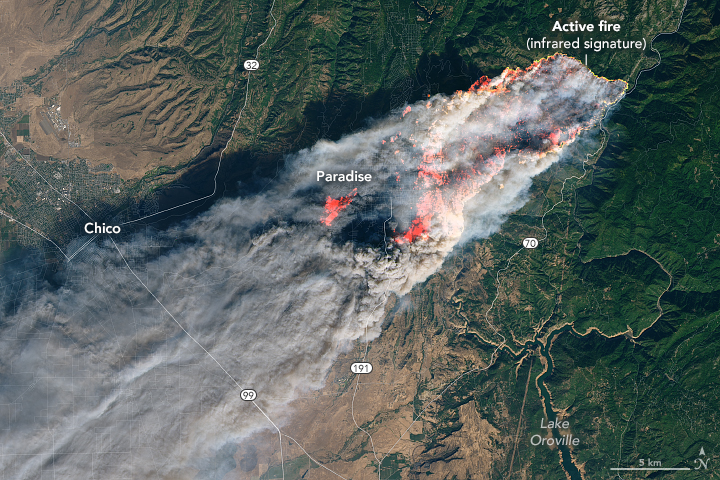
Image Credit: NASA Earth Observatory/Landsat 8/OLI
“The low-cost sensors have performed as expected, though with varying accuracy for certain types of particles,” said Gupta. “Going forward, we hope to use what we learn from them to improve the techniques scientists use to derive levels of particulate matter at the surface from the entire column aerosol measurements observed by satellites.”
So far, Gupta and his colleagues have deployed about 40 low-cost sensors in California. Next summer, they plan to add hundreds of additional sensors in New Delhi, an area that regularly gets hit with dust storms and smoke from agricultural burning. They also plan to deploy sensors in North Carolina, an area with relatively clean air.
Citizen scientists interested in air quality can get involved in the project. Gupta and colleagues from RTI International, South Coast Air Quality Management District, NASA, and other institutions are recruiting volunteers to host the low-cost sensor and share the results with the experts.
Further Reading:
Air Quality Citizen Science, Project Goals and Overview
EOS, New Strategies to Protect People from Smoke During Wildfires
KVPR, NASA’s JPL Using Fresno As A Test Bed For Air Quality Research
Geohealth, Impact of California Fires on Local and Regional Air Quality: The Role of a Low‐Cost Sensor Network and Satellite Observations
NASA Earth Observatory image by Joshua Stevens, using MODIS data from LANCE/EOSDIS Rapid Response.
With thousands of homes threatened by intense wildfires burning in southern California, NASA Earth Observatory checked in with Jet Propulsion Laboratory scientist Natasha Stavros to learn more about the destructive blazes.
Earth Observatory (EO): Why have these fires been so fast-moving and destructive? Are fierce Santa Ana winds the key factor? Are anomalous temperatures, rainfall, ENSO conditions, bark beetle activity, or other factors playing an important role?
There are absolutely other factors. Santa Ana winds definitely played a role in spreading the fires, but the late fire season is a more complex story. Last year, we had a lot of heavy rains, and this increased fuel connectivity by enabling grasses and annual shrubs to flourish (hence the green hills last spring). However, we had a lot of record-breaking heat waves this year.
In fact, a recent study we conducted with NASA DEVELOP and the National Park Service in the Santa Monica Mountains showed that the number of days over 95 degrees Fahrenheit stressed established vegetation and contributed to massive die-off. Even though the drought is over, the trees are still recovering from the stress of reduced water availability for such an extended period. They are in a fragile state and their defenses are down. This means that they are even more susceptible to infestation, mortality, and ultimately fire danger.
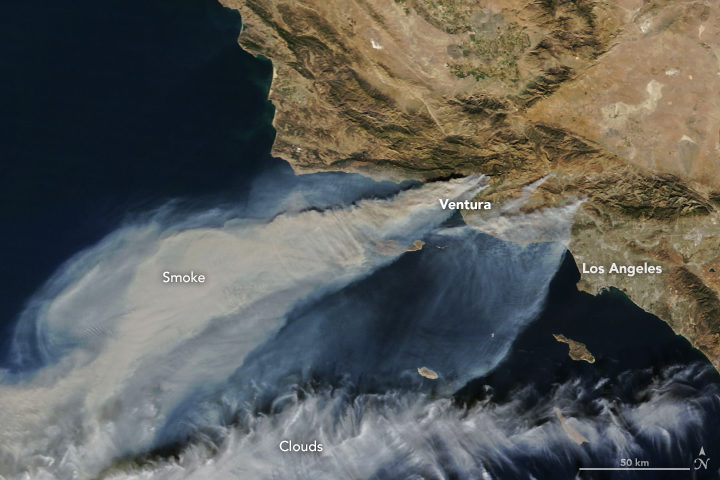
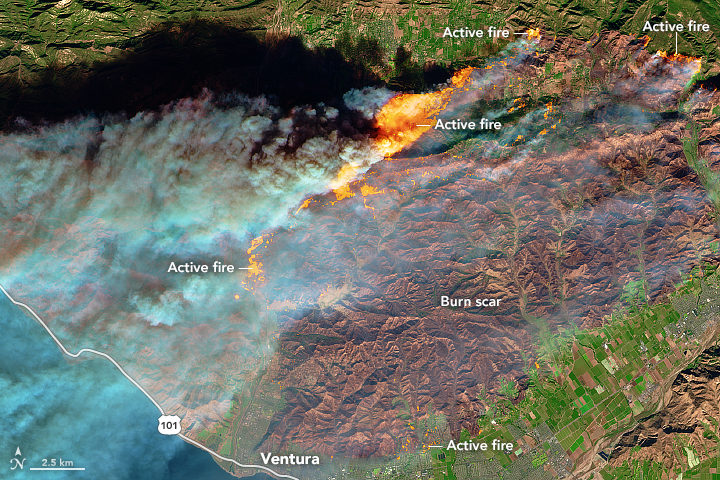
EO: We have published MODIS (top of the page), Sentinel-2 (below), and nighttime VIIRS (bottom of the page) satellite imagery of these fires. Is there anything that you find particularly interesting or notable about these images?
To me, the noteworthy thing is that the plume is going over the ocean and not the continental United States (as we saw earlier this year). This has to do with the Santa Ana winds coming from the desert and pushing particulates, ozone, carbon monoxide, and other toxic pollutants away from where people live.
NASA Earth Observatory image by Joshua Stevens, using modified Copernicus Sentinel data (2017) processed by the European Space Agency.
As for the Sentinel-2 image, this is a great shot in that it really shows the value of remote sensing in monitoring fire. Flames that look like that are tens of meters tall. The flame length is proportional to the heat released from the flame, so these fires are very hot. Just like you would not want to stand too close to a bonfire with flames tens of meters tall, fire management does not want to put personnel in the path of those flames.
Images like these and fire behavior models help inform how we think the fire will move across the landscape. There is still a lot we do not know; our models are based on what we do know, so as fires become more intense, the models do not work as well, so this is an area of active research.
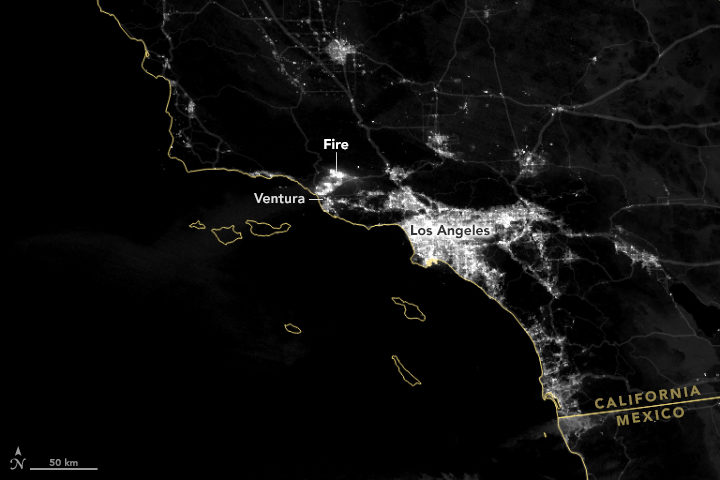
NASA Earth Observatory images by Joshua Stevens using VIIRS day-night band data from the Suomi National Polar-orbiting Partnership.
EO: Is there anything to say about how these fires fit into longer term trends and/or changing climate patterns?
Fire regimes are changing. There is no question about that, and there are a lot of things contributing to it: climate change, a century of fire exclusion, and a growing wildland urban interface (WUI). As we move into the future, we expect there to be an increase in very large fire events. Also, and this is relevant for the events happening now, there will be longer fire seasons. Also, note that many of the fires that ignite close to where people live are actually caused by people. This is particularly true in Southern California.
As we move forward, we need to think about how to support smart fire management practices. By that I mean: what can we proactively do to reduce fire risk (i.e. the threat to valuable resources)?
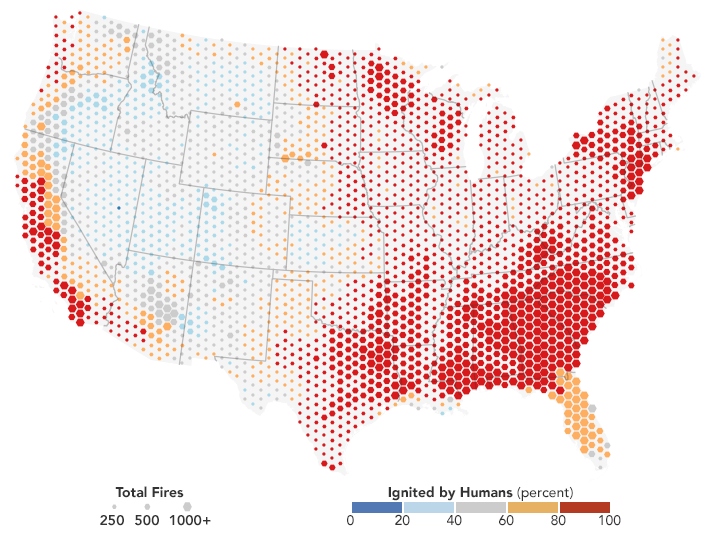
Most fires on the coasts are lit by people. NASA Earth Observatory map by Joshua Stevens, using fire data courtesy of Balch, J. et al. (2017).
EO: What about JPL’s response to these fires? I was intrigued by the megafire project described here. Will your group be responding to this fire in any way?
We just received approval from NASA Headquarters to fly the Airborne Visible/Infrared Imaging Spectrometer (AVIRIS) over these fires. This sensor has been useful for investigating fuel load type and subsequent effects on emission types, fire behavior, and post-fire analysis (e.g., safety, erosion, area burned, fire severity or the amount of environmental change caused the fire, etc.) and is often analyzed in interagency and federal-academic coordination to improve our understanding of fire.
Another effort to support fire management includes work being done from JPL in coordination with the National Interagency Fire Center (NIFC) to help them develop metrics of fire danger using NASA satellites that provide hydrologic variables (e.g., soil moisture and vapor pressure deficit—the difference between the amount of moisture in the air vs how much it can hold). These metrics have a one-month forecast to help allocate fire management resources nationally, which is particularly important as our fire seasons extend throughout the year in multiple places at the same time.

Natasha Stavros. Image courtesy of N. Stavros.
A June snowstorm just topped off the already thick layer of white stuff atop the Sierra Nevadas. California’s snow water equivalent rose to a heaping 170 percent of normal. But not so long ago, the state was in the midst of a deep drought; its mountains were bare and brown, and water levels plummeted in reservoirs.
Throughout, satellites were watching. Check out the California drought and its aftermath in a video from NASA Earth Observatory:

Credit: NASA Earth Observatory/VIIRS/Jesse Allen. More details about the image here.
In the past two months, weather reports in California, Oregon, and Washington have been filled with news of “atmospheric rivers” bringing copious amounts of rain and snow to the western United States. Atmospheric rivers are long, thin fingers of moisture that develop in the tropics and flow into higher latitudes. If one of them makes landfall, huge of amounts of rain and snow can fall in a short period.
Much of this moisture, of course, eventually finds its way back to the sea through rivers. When waterways are swollen and flowing rapidly, they also become rivers of suspended sediment, full of clay, mud, sand, and other debris. Though the flooding from atmospheric river events can be devastating, the enormous amount of sediment they send rushing into the sea can also be surprisingly beautiful.
For instance, on February 11, 2017, the Visible Infrared Imaging Radiometer Suite (VIIRS) on Suomi NPP acquired this remarkable view of rivers and streams spewing sediment into the Pacific Ocean. Close to the outlets of streams and rivers, sediment-rich waters appear brown. As the sediment dissipates and mixes into the ocean, the water appears teal.
Duane Waliser, a scientist at NASA’s Jet Propulsion Laboratory, recently tallied just how damaging atmospheric rivers can be for coastal areas. In a study published in Nature Geoscience, Waliser and a colleague showed that atmospheric rivers are among the most damaging storm types in the middle latitudes. Of the very wettest and windiest storms (those ranked in the top 2 percent), atmospheric rivers were associated with nearly half of them. Waliser and colleagues also found that atmospheric rivers were associated with a doubling of the typical wind speed compared to all storm conditions.

Image originally published by NOAA.
