The Earth Observatory has published its last Image of the Day on this website. Please join us on our new home at science.nasa.gov/earth/earth-observatory.
Humans—not lightning—trigger most wildfires in the United States. According to a study published in February 2017 in the Proceedings of the National Academy of Sciences, 84 percent of the blazes that firefighters were called to fight between 1992 and 2012 were ignited by people. Some common ways that people start fires include discarding cigarettes, leaving campfires unattended, and losing control of prescribed burns or crop fires. Sparks from railroads and power lines, as well as arson, also routinely cause wildfires.
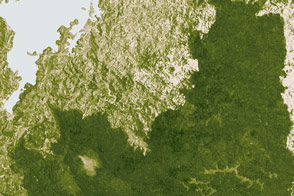
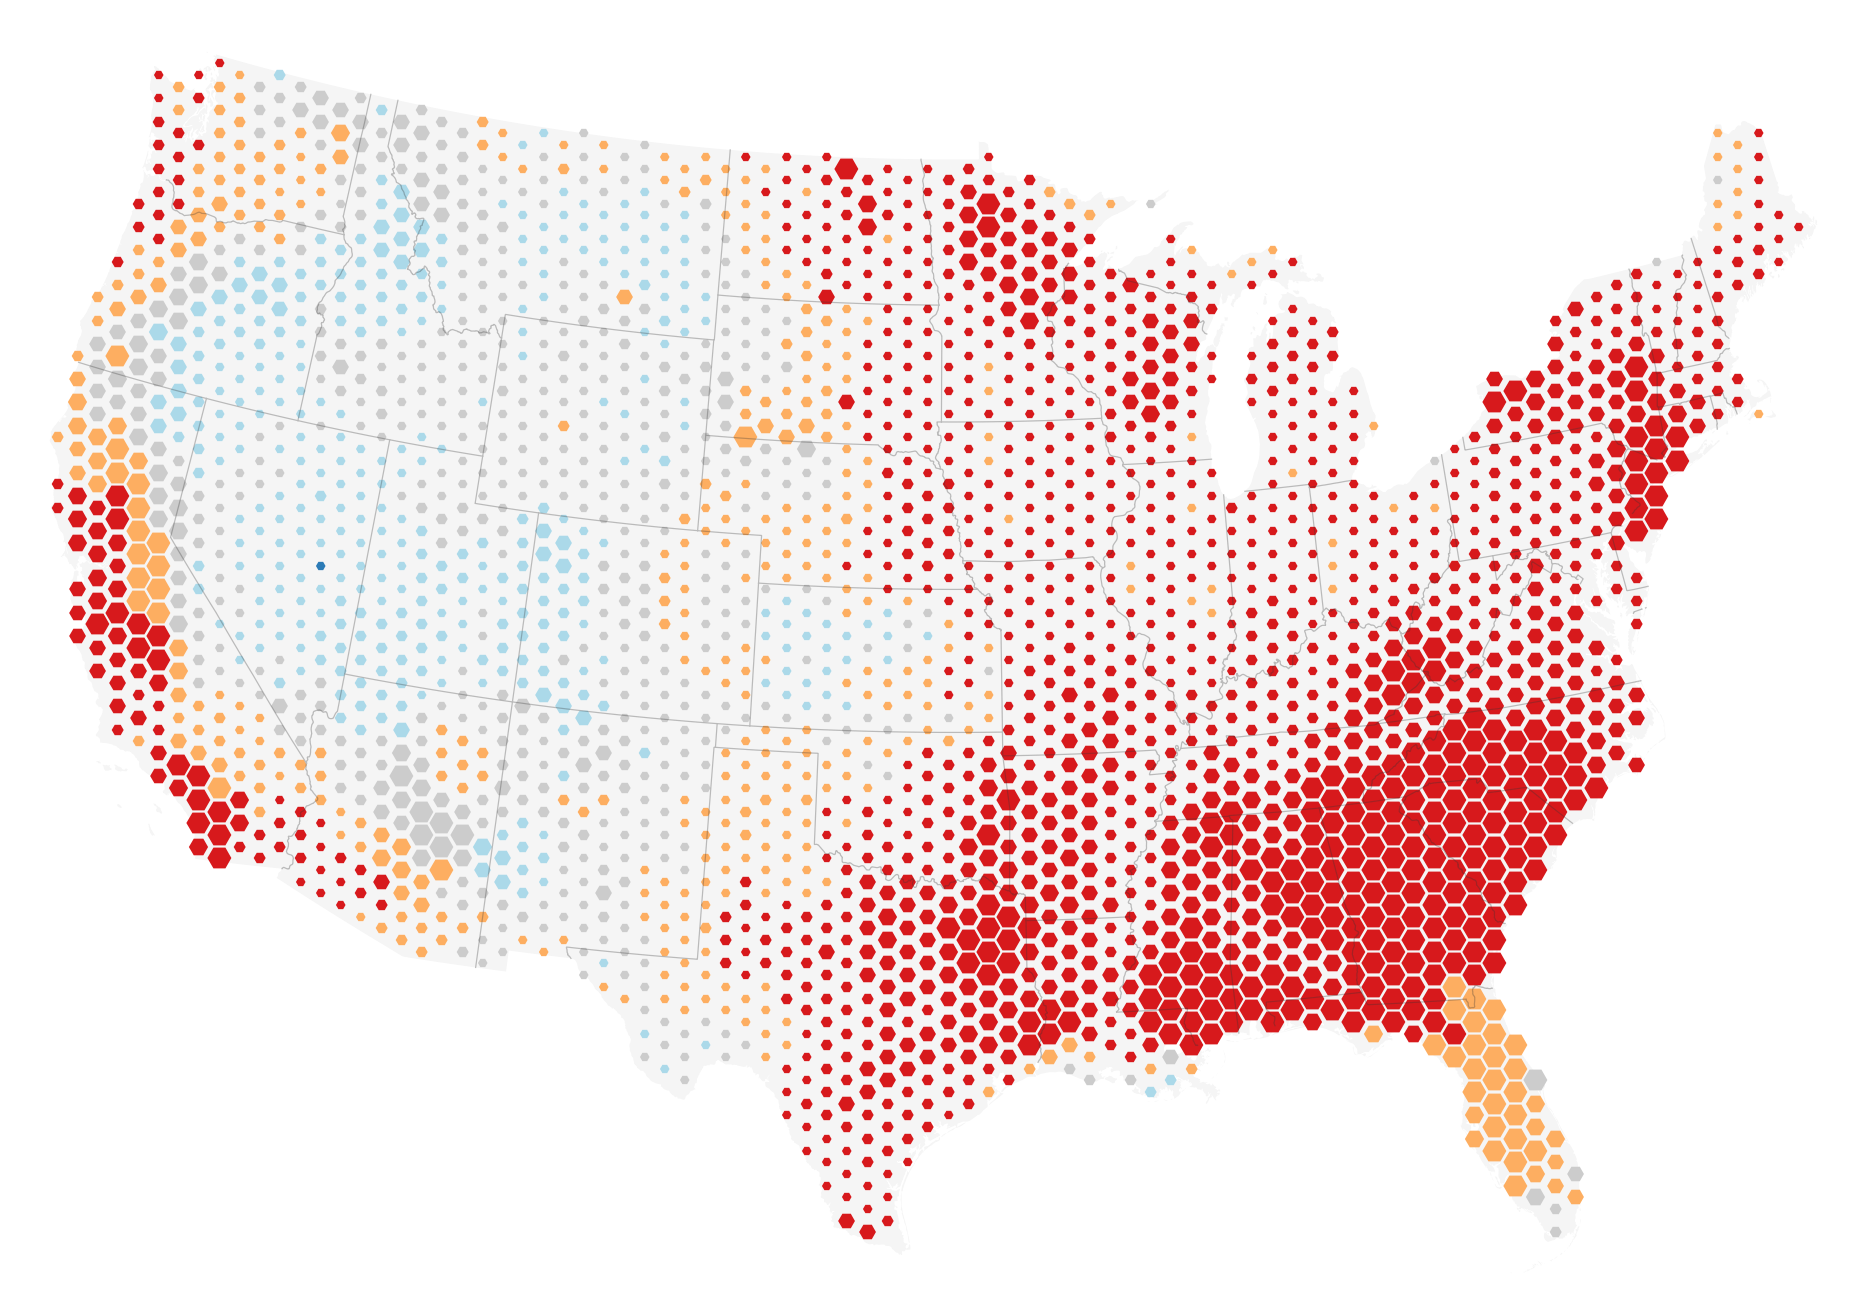
University of Colorado scientist Jennifer Balch and several colleagues came to their conclusion after analyzing reports of 1.6 million wildfires from a comprehensive’s fire occurrence database maintained by the U.S. Forest Service. As shown by the map above, almost all (80 percent or more) of the fires in the Mediterranean ecosystems of central and southern California, the temperate forests of the eastern United States, and the temperate rainforests of the Pacific Northwest are caused by humans. In contrast, lightning started the largest percentage of fires in the forests of the Rocky Mountains and the Southwest. In Florida, which is moist but has a great deal of lightning, between 60 and 80 percent of wildfires were caused by people.
The researchers also found that human-ignited fires tripled the length of the wildfire season. Though lightning-ignited fires were clustered in the summer, human-ignited fires occurred in the spring, fall, and winter as well, times when forests tend to be moist. During these seasons, people added more than 840,000 fires—a 35-fold increase over the number of lightning-started fires. In the eastern United States, fire activity became more extensive in the spring; in the West, human-ignited fires tended to extend the fire season in fall and winter. Despite the high number of incidents, human-ignited wildfires accounted for just 44 percent of the total area burned because many of them occurred in relatively wet areas and near population centers, where firefighters likely could quickly extinguish the fires before they spread.
The researchers also compared the wildfire reports to other satellite-based measurements of fire activity and forest health. For instance, by comparing to a Landsat-based record of burn scars—known as the Monitoring Trends in Burn Severity (MTBS) project—they showed that both human-ignited and lightning-ignited wildfires have grown larger and more severe since 1992. For lightning fires, burning increased in mountainous parts of the West—not because there was more lightning, but because a warmer climate dried out forests. Among human-caused fires, there was an increase in large fires in the spring months in the Great Plains, possibly because climate change has prompted agricultural activities earlier in the year, Balch said.
Note that the new study does not suggest that 84 percent of all fires in the United States are caused by humans—just wildfires. Other research has shown that by raw numbers alone, most of the active fires that MODIS and other satellite sensors detect in the United States are prescribed fires and crop fires lit intentionally by land managers and farmers.
“Ignitions caused by human activities are a substantial driver of overall fire risk to ecosystems and economies,” Balch and the coauthors of the study pointed out. “Actions to raise awareness and increase management in regions prone to human-started wildfires should be a focus of the United States policy to reduce fire risk and associated hazards.”
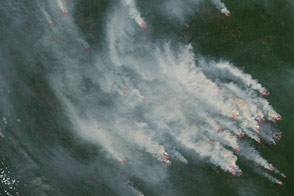
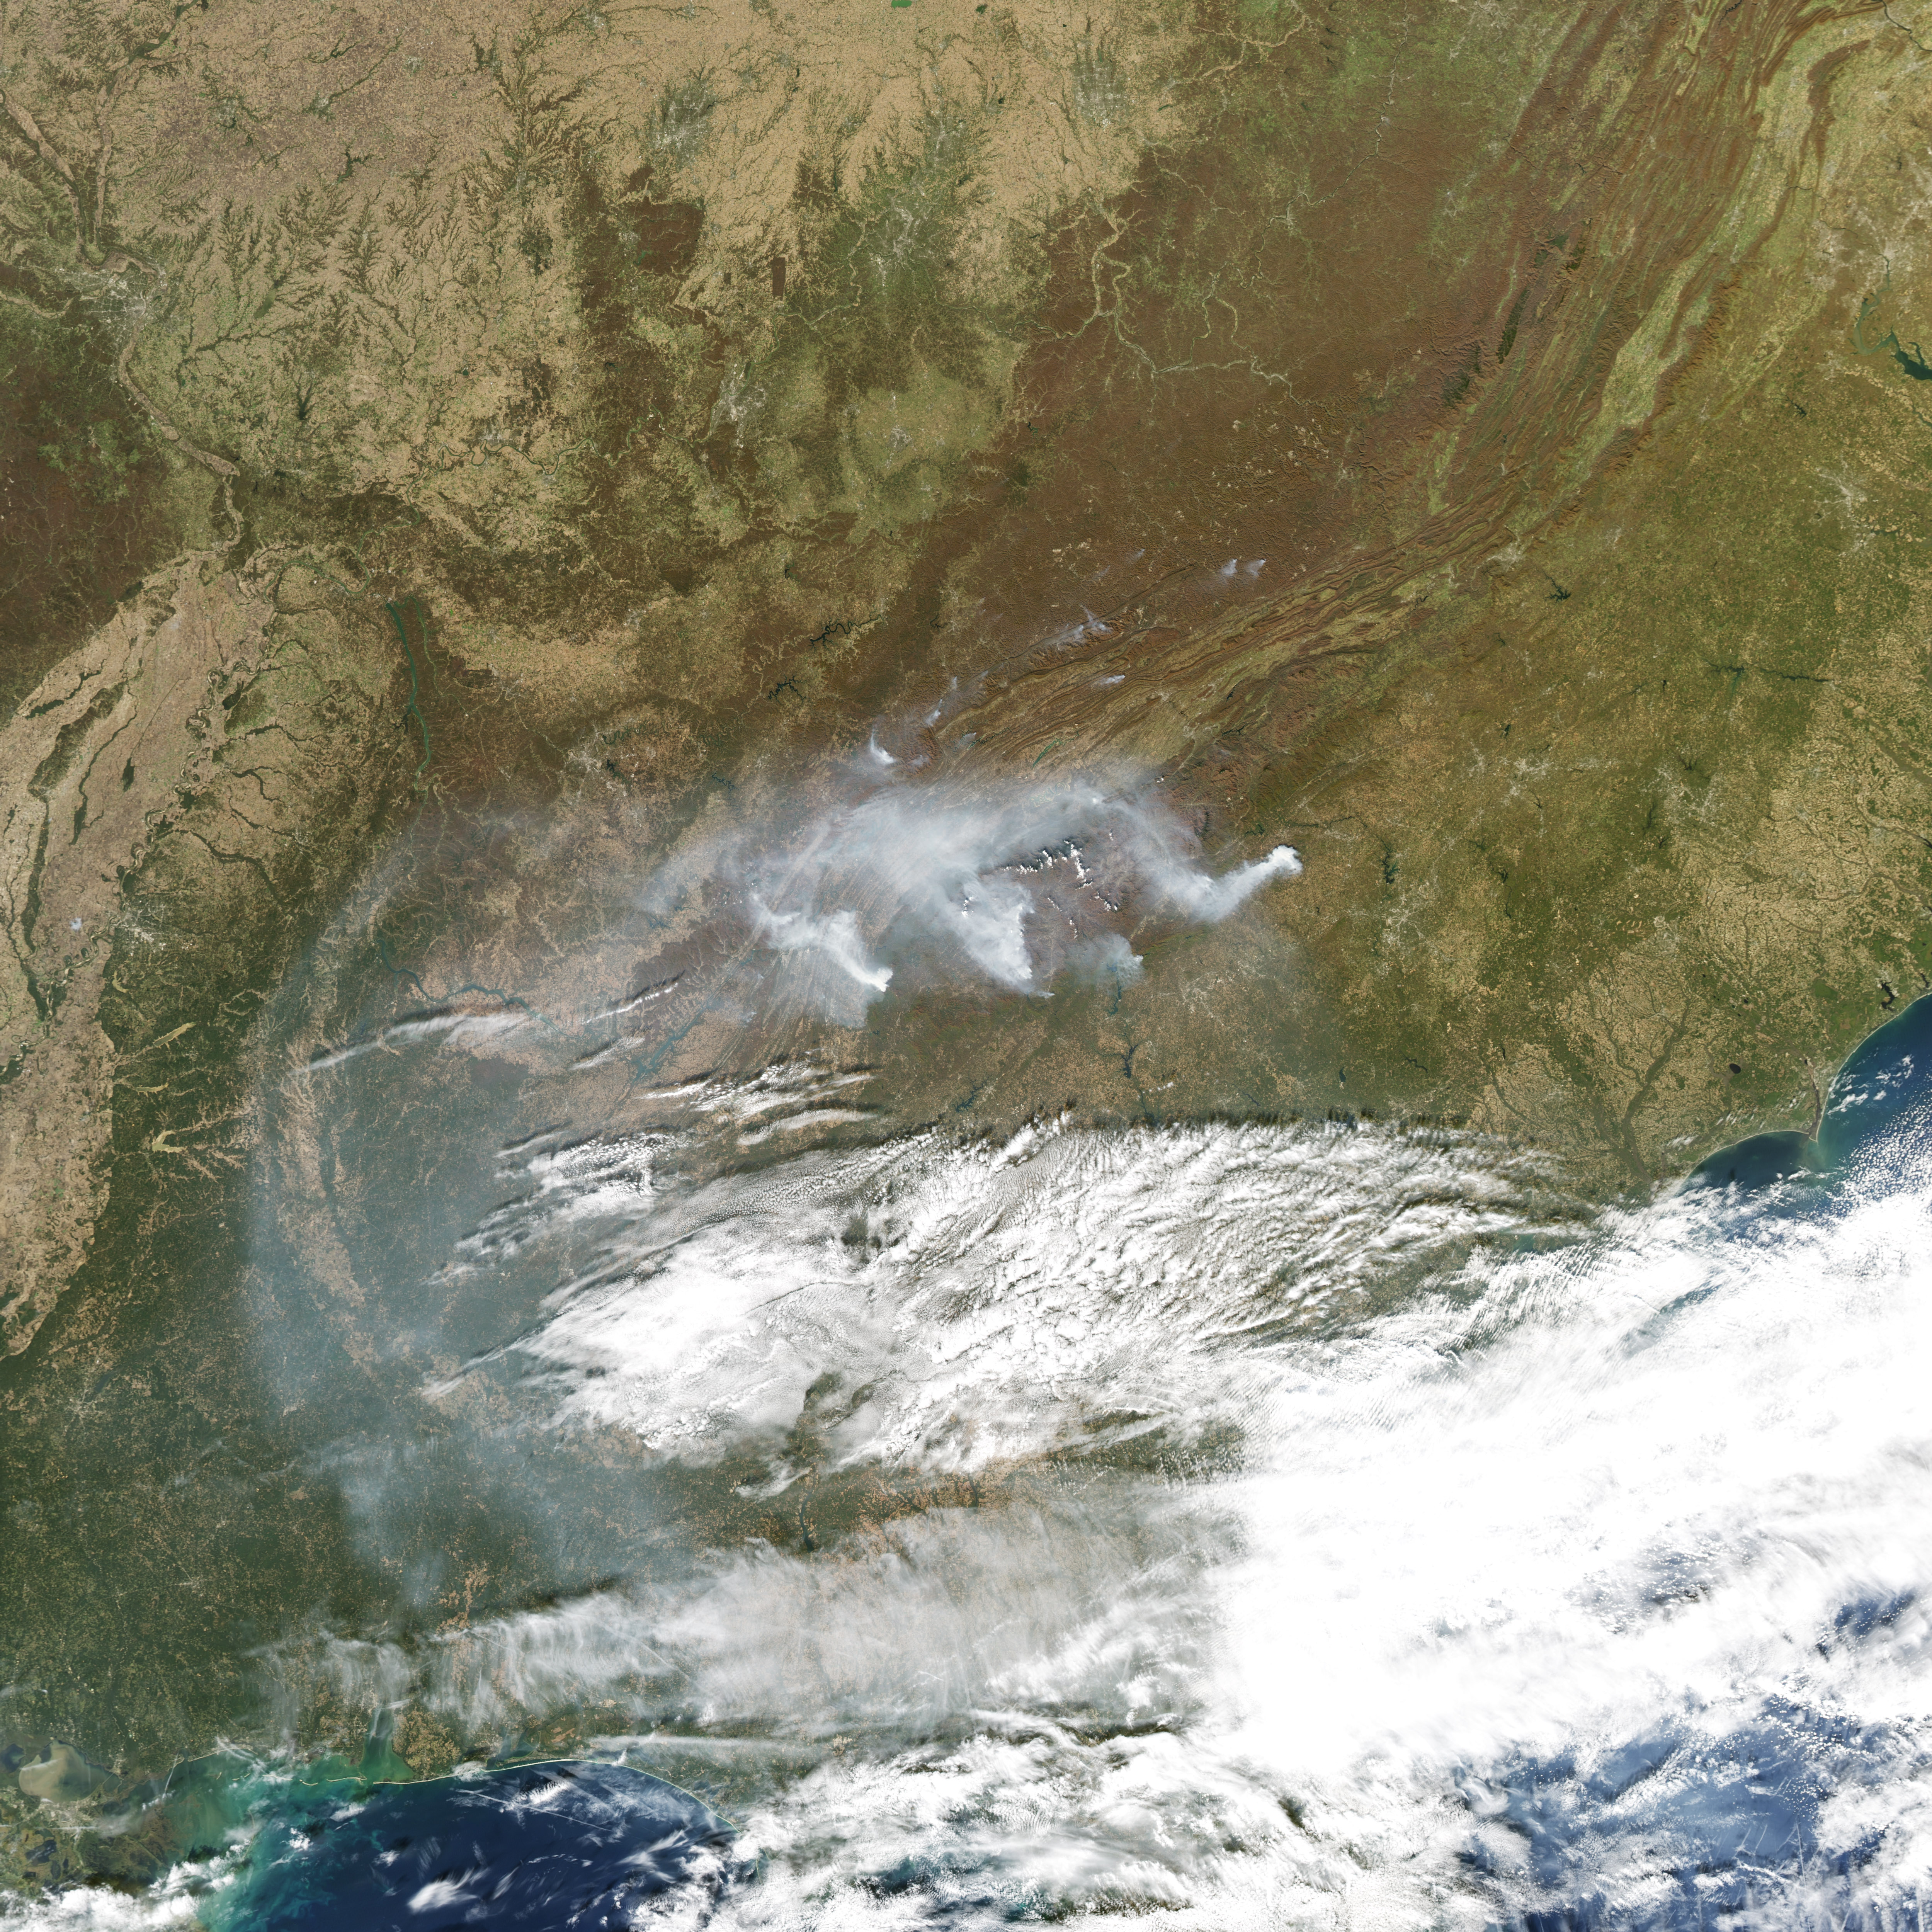
The image above, captured by the Moderate Resolution Imaging Spectroradiometer (MODIS) on NASA’s Aqua satellite, shows smoke streaming from several fires in Tennessee and North Carolina on November 12, 2016. People ignited most of the fires that raged in Tennessee and North Carolina in November 2016, including a destructive fire that tore through Gatlinburg, Tennessee, and killed 14 people.
This research was funded by NASA’s Terrestrial Ecology Program, the Joint Fire Science Program, and the University of Colorado’s Grand Challenge Earth Lab.
NASA Earth Observatory map (top) by Joshua Stevens, using fire data courtesy of Balch, J. et al. (2017). NASA Earth Observatory image (bottom) by Jesse Allen, using data from the Level 1 and Atmospheres Active Distribution System (LAADS). Caption by Adam Voiland.