

It might seem unlikely that vegetation can survive in a sandy coastal environment that receives little rain, but plant communities along Peru’s southern coast have found a way.
In December 2016, we published the top image showing a unique perspective of fog. From space, you can see the vast expanse of marine stratocumulus sweeping inland to fill some of Peru’s deep valleys. It is the visible outcome of unseen atmospheric circulation and ocean currents.
From the ground, visibility would be limited (assuming the cloud layer is reaching all the way down to the ground). Depending on your location, experiencing fog might not be too unusual. In coastal Chile and Peru, it’s most common to get fog like this during the austral winter (June through August) and early spring. Plant communities called “lomas” depend on it for their survival. Instead of relying on rainfall, the plants get much of their water by combing droplets out of the air as dense fog passes by.
Ralf Hesse, a scientist at the State Office for Cultural Heritage in Germany, has used remote sensing to study Peru’s lomas. He provided the second image above, which shows the view from a study site located about 80 kilometers (50 miles) northwest from the top-left corner of the satellite image. The loma pictured is composed of the species Tillandsia. But depending on the location, lomas can contain anything from grasses and shrubs to small trees.
Three thick layers of cake and frosting sat atop Jeff Schmaltz’s kitchen counter. The programmer had completed a 3-D model of a GIBS tile pyramid; it was his entry into a collegial science bake-off at NASA’s Goddard Space Flight Center. But there was more to this cake than flour and eggs and sugar.

This tile pyramid cake shows a view of the world with Antarctica represented as the largest continent on the map. Credit: Susan Schmaltz.
If you have ever browsed Earth science imagery and data using the online tool Worldview, then you have also used GIBS, Global Imagery Browse Services. GIBS is like a gear behind a clock face, a mechanism that keeps the hands moving. Schmaltz and his colleagues rely on it daily as they assemble images of our dynamic planet. (Worldview is a free and publicly available Earth science browser used by scientists and non-scientists, including the NASA Earth Observatory team.)
How It Works
GIBS ingests and organizes satellite data to create a global mosaic. Then, it chops down the data into digestible bits—like that image tile pyramid that Schmaltz recreated with cake—so that users can quickly view Earth as seen from space.
Zoomed out in a broad view, you see just the top tile, the whole Earth in low resolution (like the top layer of the cake). Zoomed in, you see one tile covering a smaller region of the earth but in more detail (like a square from the bottom layer of the cake). On an interface like Worldview, which allows users to scroll and view daily images from the entire surface of Earth, an architecture like GIBS is necessary to keep the site running quickly.
“It’s very fast, and there’s not a lot of computing going on,” Schmaltz said. GIBS does the same thing that Google Maps does: it summons only the data the user requests. By dealing in tiles, the program can serve many people at once without getting bogged down.
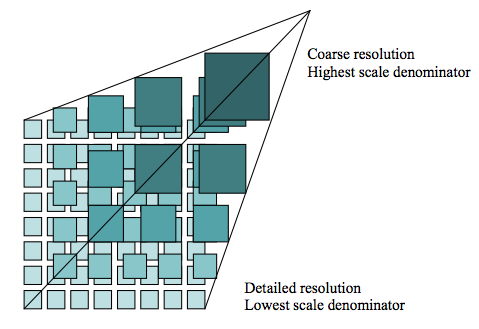
GIBS uses tiles (512 x 512 pixels) to speed up data processing. Credit: The Open Geospatial Consortium (OGC).
Way Back When
Not long after NASA launched the Terra satellite in late 1999, the U.S. experienced a record fire season: A record 8.4 million acres burned in the year 2000. At the time, it could take weeks for data from Terra’s MODIS instrument to be processed into images. Scientists hoped that a quicker turnaround might translate into a more informed response to fires. As result, NASA created a near-real time fire pixel product.
Seventeen years later, scientists can visit Worldview to see roughly 150 near-real time data sets from different satellites and sensors as the clouds and snow cover change each day. Air pollution, vegetation cover, dust, smoke are just a few of the data layers users can view.

Credit: NASA.
P.S. To make Jeff’s satellite cake, follow his grandmother’s recipe below:
Ingredients:
Directions:
Mix dry ingredients together. Measure oil, water, egg yolks, and vanilla into a measuring cup and mix; then add to dry ingredients and beat until smooth.
Beat 2 egg whites + ¼ tsp. cream of tartar until stiff. Fold into batter. Slowly mix in grated chocolate.
Bake in ungreased 8×8 pan at 350 degrees for 20-25 minutes. Check with toothpick when done. Cool on a rack. Goes best with chocolate frosting. (Schmaltz uses the recipe on the side of a Hershey’s can.) Alternately, you can top the cake with an edible print of a satellite image.

Credit: Adam Voiland.

Image Credit: NASA Earth Observatory/Aqua/MODIS/Jeff Schmaltz
In August and September 2015, a massive dust storm swirled across the Middle East. After reporting on the storm, I read a fair amount of speculation — but no clear answers — as to what kicked up such an unusually large amount of dust. Several reports made the case that the ongoing war in Syria was a contributing factor. The war, some scientists speculated, had increased the military traffic over unpaved roads and had led farmers to abandon their land.
Now a new study led by a researcher from Duke University argues that the war was not an important cause. By analyzing satellite data of vegetation cover before the war, the researchers concluded that the conflict did not have much effect on vegetation. (Vegetation helps hold sand and soil in place.) In fact, the satellites observed that agricultural activity was healthy in 2015 in comparison to earlier years.
Rather, the research team found that the key drivers of the dust storm were meteorological. The summer of 2015 was unusually hot and dry compared to the past 20 years, meaning more dust was available and in a condition that winds could easily lift. So when an unusual cyclonic wind pattern developed in late August and persisted for more than a week, a mega dust storm was born.
Read a press release about the study from Princeton University, and read the full study in Environmental Research Letters. To reach their conclusion, the researchers used Aerosol Optical Depth and Normalized Difference Vegetation Index (NDVI) observations from NASA’s Moderate Resolution Imaging Spectroadiomters (MODIS), and meteorological simulations from the Weather Research and Forecasting (WRF) model. You can view several types of satellite imagery of the storm, which began on August 31 and peaked on September 8, on NASA’s Worldview browser.

NASA image by Jeff Schmaltz, LANCE/EOSDIS Rapid Response.
Almost every volcano is interesting from a scientific perspective, but there are just too many eruptions for us to cover every single one. Instead we tend to focus on eruptions that have the potential to affect people. Or, occasionally our satellites return images that simply look so unique that we find the time to cover them. The plume recently ejected from Alaska’s Bogoslof Volcano was noteworthy for both reasons.
Bogoslof, which has been erupting since mid-December 2016, gave rise to a compelling two-tone plume. Are materials being ejected from a vent that is still under water? (Most of the volcano is below the surface of the sea.) The volcano’s interaction with seawater explains the white steam. But if the vent is not yet above water, then how did such a large, dark plume of ash reach so high in the atmosphere? Scientists at the Alaska Volcano Observatory continue to monitor the remote volcano and perhaps answers will be forthcoming as the eruption evolves.
Also intriguing are the swirls of blue visible in the image above. The Visible Infrared Imaging Radiometer Suite (VIIRS) on the Suomi NPP satellite captured the image on January 7, 2017. My first thought was that the color was caused by a bloom of phytoplankton. The milky blue color looked about right. And iron from eruptions have previously been shown to provide the nutrients needed for blooms to flourish. But when I asked the experts, the general consensus was that while you can’t rule out a bloom, there was another more likely explanation for the swirls.
According to ocean scientist Norman Kuring of NASA’s Goddard Space Flight Center:
“Phytoplankton don’t normally bloom in the Bering Sea during winter because there’s not a lot of sunlight and because winter storms deepen the mixed layer which also keeps the plankton more in the dark. Wave action can resuspend bottom sediments, and that may be happening farther east along the Aleutian chain in the January 7 image where the water is relatively shallow. Bogoslof Island is beyond the shelf break, however, so bottom resuspension is less likely. Ash in the water seems most probable…. I wouldn’t expect the Bering Sea to be nutrient limited in the winter, so I don’t expect an ash-based phytoplankton boost.”
In short, the swirls are probably ash in the water. The phenomenon is not unprecedented. We have previously published images of the occurrence here and here. But as Kuring reminds us, “the only way to know for sure would be to sample the water directly.”
In some parts of the world, saline lakes are common features. Take, for instance, the image below, from our January 2017 article about fires in Argentina. But saline lakes are an environment unto themselves.
Lakes cover about 4 percent of the Earth’s land surface. Many of the largest ones (by area) are salty: Utah’s Great Salt Lake, the Caspian Sea (arguably the world’s biggest lake), Iran’s Lake Urmia, and the Dead Sea. Unlike marine and brackish waters, saline lakes typically form inland, and do not connect to the ocean. They tend to be ephemeral, filling with water in periods of increased rainfall, and drying out under the Sun.
In general, the saltier the lake, the fewer animals that can tolerate it. Yet a number of invertebrates call saline lakes home. Brine shrimp, for instance, have evolved to live in the salty, low-oxygen environment of the Great Salt Lake. The shrimp—also called “sea monkeys”—can survive even as water recedes. They are so plentiful, in fact, that fishermen corrale them using oil booms in an annual harvest.

Image: NASA Earth Observatory/Jeff Schmaltz
Just how salty are these lakes? That depends on location and season. The Dead Sea has a salinity of 34 percent, while the Great Salt Lake varies between 10 and 30 percent; the same is true of Lake Urmia. (For comparison, open ocean waters average a 3.5 percent salt content.)
Australia’s scorching hot weather and scant rainfall make it a hotbed for saline lakes—thousands of them. In her story on the colorful salt lakes Down Under, my colleague Kathryn Hansen describes how they formed:
Millions of years ago, declines in rainfall caused river flows to ebb and river valleys to fill in with sediment. Wind then sculpted the loose sediment to form the lake basins that remain today. (The wind also sculpted some of the lighter sediments into parallel dunes that fringe each lake downwind to the east-southeast.) Some of the lakes now fill with runoff directly from the Stirling Range; others are controlled primarily by groundwater.
The lakes below in Western Australia range from pea soup-brown to pinkish in hue. Their color changes based on sediments, aquatic and terrestrial plant growth, water chemistry, algae, and hydrology.

Image: NASA Earth Observatory/Joshua Stevens
At Urmia, the rise and fall of lake also has an effect on water color:
The color changes have become common in the spring and early summer due to seasonal precipitation and climate patterns. Spring is the wettest season in northwestern Iran, with rainfall usually peaking in April. Snow on nearby mountains within the watershed also melts in the spring. The combination of rain and snowmelt sends a surge of fresh water into Lake Urmia in April and May. By July, the influx of fresh water has tapered off and lake levels begin to drop.
The fresh water in the spring drives salinity levels down, but the lake generally becomes saltier as summer heat and dryness take hold. That’s when the microorganisms show their colors, too.
While many salt lakes vary in size according to rainfall, some like Lake Urmia, have been shrinking in recent years.

Image: NASA Earth Observatory/Joshua Stevens
Hot, sunny days help create saline lakes by evaporating massive amounts of water, but salt lakes can also occur in cold climes. For instance, Don Juan Pond sits in Antarctica’s McMurdo Valley, where winter temperatures can drop to -50 degrees Celsius (-58 degrees Fahrenheit). Don Juan is so salty that waters rarely freeze. Its extreme environment resembles that of Mars. While the lake is far too salty and cold for even salt-loving brine shrimp, it does house microorganisms, Brown University geologist, Jay Dickson, told the NASA Earth Observatory.
“There is certainly biology in the vicinity of the pond and some evidence for biologic activity in the pond itself, but this activity could be explained by abiotic processes,” Dickson said. “Mars has a lot of salt and used to have a lot of water.”

Image: NASA Earth Observatory/Jesse Allen

At the time of his death on December 23, 2016, Piers Sellers was the deputy director of the Sciences and Exploration Directorate and the acting director of the Earth science division at NASA’s Goddard Space Flight Center. But he was a lot more than that to his colleagues and to the world. NASA science writer Patrick Lynch (and occasional Earth Observatory contributor) had the unenviable task of trying to capture the essence of Sellers:
“As an astronaut, he helped build the International Space Station. As a manager, he helped lead hundreds of scientists. And as a public figure he was an inspiration to many for his optimistic take on humanity’s ability to confront Earth’s changing climate. But his most lasting contributions will be in the field where he began his career: science.”
Piers came to NASA Goddard from Britain in 1982 as a research meteorologist and climate scientist. His focus was the interaction between the biosphere — the living, breathing plant-life of Earth — and the atmosphere. He helped develop models and wrote several papers that are still widely cited in the field. But he also had another lifelong dream: to become an astronaut. He applied to the astronaut training program in the 1990s, and worked through rigorous screening and training to go into space. He flew to the International Space Station in 2002, 2006, and 2010, participating in six spacewalks and helping with assembly of the station. Upon retiring from the astronaut corps, he came back to Goddard and resumed his place as a leader in Earth science, while also promoting conversations and collaborations with researchers studying planetary science and hunting for life beyond our solar system.
I did not have the chance to get to know Piers well. He was someone I mostly watched from afar and our interactions were sporadic, though always interesting, dignified, and thoughtful. I came to know him mostly through his words — to the media and to my fellow scientific and communications staff of NASA Goddard — and in the ways he inspired people. The more I read, the more I wish I had been able to spend more time with him.

In January 2016, one year ago this week, he wrote a poignant op-ed in The New York Times. The words were a compelling prelude to his final year with us.
I’m a climate scientist who has just been told I have Stage 4 pancreatic cancer. This diagnosis puts me in an interesting position. I’ve spent much of my professional life thinking about the science of climate change, which is best viewed through a multi-decadal lens. At some level I was sure that, even at my present age of 60, I would live to see the most critical part of the problem, and its possible solutions, play out in my lifetime. Now that my personal horizon has been steeply foreshortened, I was forced to decide how to spend my remaining time. Was continuing to think about climate change worth the bother?
You should read the full text of “Cancer and Climate Change” for its insight and inspiration.
*******************************************
In the summer of 2016, Sellers wrote another compelling piece, this time in The New Yorker. In “Space, Climate Change, and the Real Meaning of Theory,” he took on a very sensitive and fundamental facet of science: the accumulation of evidence and observation that leads to truth. Here is my favorite passage:
When we talk about why the climate has changed, and what the future climate is likely to be, scientists use analyses and predictions that rest heavily on results from computer models, which in turn rest on layers and layers of theory. And there’s the rub—a lot of the confusion about what is known and unknown about the changing climate can be traced to people’s understanding of the role of theory in science.
Fundamentally, a theory in science is not just a whim or an opinion; it is a logical construct of how we think something works, generally agreed upon by scientists and always in agreement with the available observations. A good example is Isaac Newton’s theory of gravitation, which says that every physical object in the universe exerts a gravity force field around itself, with the strength of that field depending on its mass. The theory—one simple equation—does a superb job of explaining our observations of how planets orbit around the sun, and was more than good enough to make the calculations we needed to send spacecraft to the moon and elsewhere. Einstein improved on Newton’s theory when it comes to large-scale astronomical phenomena, but, for everyday engineering use, Newton’s physics works perfectly well, even though it is more than three hundred years old.
…Engineering theory, based on Newton’s work, is so accepted and reliable that we can get it right the first time, almost every time. The theory of aerodynamics is another perfect example: the Boeing 747 jumbo-jet prototype flew the first time it took to the air—that’s confidence for you. So every time you get on a commercial aircraft, you are entrusting your life to a set of equations, albeit supported by a lot of experimental observations. A jetliner is just aluminum wrapped around a theory.
The full text is here.
**************************************************
On camera, it is easy to pick up the energy, humor, and dignity of the man. In the past year, he was a frequent interview subject for the television and radio media. He also made an appearance in Leonardo DiCaprio’s documentary Before the Flood. Some of us think Piers stole the show.
But I am most fond of this simple video, posted last month to YouTube. It’s a conversation between Piers and Compton Tucker, one of his best friends, his next-door neighbor, and a fellow NASA scientist. So many people have stilted and distant impressions about scientists, and Hollywood caricatures don’t help. I like this video because it shows bright people having fun, being human, and savoring life, learning, and friendship.
Other interviews worth watching or listening to:
WBEZ Chicago — The Thin Blue Ribbon
HBO Vice News – A New Hope
CNN On GPS: An astronaut on his final mission
**************************************
At the conclusion of his January 2016 piece in The New York Times, Piers offers a thought that inspires us to keep up the good work.
As for me, I’ve no complaints. I’m very grateful for the experiences I’ve had on this planet. As an astronaut I spacewalked 220 miles above the Earth. Floating alongside the International Space Station, I watched hurricanes cartwheel across oceans, the Amazon snake its way to the sea through a brilliant green carpet of forest, and gigantic nighttime thunderstorms flash and flare for hundreds of miles along the Equator. From this God’s-eye-view, I saw how fragile and infinitely precious the Earth is. I’m hopeful for its future.
And so, I’m going to work tomorrow.

NASA Profile – Piers Sellers: A Legacy of Science
NASA Statement – NASA Administrator Remembers Scientist, Astronaut Piers Sellers
Flickr: Piers Sellers
The Washington Post — Piers Sellers, climate scientist turned astronaut, dies at 61

Every month on Earth Matters, we offer a puzzling satellite image. The January 2017 puzzler is above. Your challenge is to use the comments section to tell us what part of the world we are looking at, when the image was acquired, what the image shows, and why the scene is interesting.
How to answer. Your answer can be a few words or several paragraphs. (Try to keep it shorter than 200 words). You might simply tell us what part of the world an image shows. Or you can dig deeper and explain what satellite and instrument produced the image, what spectral bands were used to create it, or what is compelling about some obscure speck in the far corner of an image. If you think something is interesting or noteworthy, tell us about it.
The prize. We can’t offer prize money or a trip to Mars, but we can promise you credit and glory. Well, maybe just credit. Roughly one week after a puzzler image appears on this blog, we will post an annotated and captioned version as our Image of the Day. After we post the answer, we will acknowledge the person who was first to correctly ID the image at the bottom of this blog post. We may also recognize certain readers who offer the most interesting tidbits of information about the geological, meteorological, or human processes that have played a role in molding the landscape. Please include your preferred name or alias with your comment. If you work for or attend an institution that you want us to recognize, please mention that as well.
Recent winners. If you’ve won the puzzler in the last few months or work in geospatial imaging, please sit on your hands for at least a day to give others a chance to play.
Releasing Comments. Savvy readers have solved some of our puzzlers after only a few minutes or hours. To give more people a chance to play, we may wait between 24-48 hours before posting the answers we receive in the comment thread.
Good luck!
Editor’s Note: Congratulations to Brian Kennelly, James Varghese, Stephanie Wurdinger, and Max Packs for being some of the first readers to solve the puzzler on Earth Matters and Facebook. See a labeled version of the January puzzler with a more detailed discussion of Cerro Verde mine here.
