
From Karl et al, 2015.
The first thing to know about the new study authored by NOAA scientists about the global warming “slowdown” or “hiatus” over the past decade is that the new analysis gets pretty deep into the details and will mainly be of interest to specialists who study climate science. In fact, for most casual readers, it doesn’t affect the overall story much at all and shouldn’t change what you think about global warming.
As I see it, interest in climate science is a bit like interest in cars. The vast majority of people couldn’t care less about the details of how their car works. They don’t know the difference between a caliper and a camshaft, and they don’t really care to know. They just want the car to run smoothly. Then there is that small but enthusiastic minority — the aficionados and grease monkeys — who not only can name every part of their engine, but who also want to be able to take it apart and fix it without the help of a mechanic. This latest study is really for the grease monkeys of climate science, the folks who know the difference between GISTEMP, HadCRUT4, and can tell you what ERSST stands for without googling it.
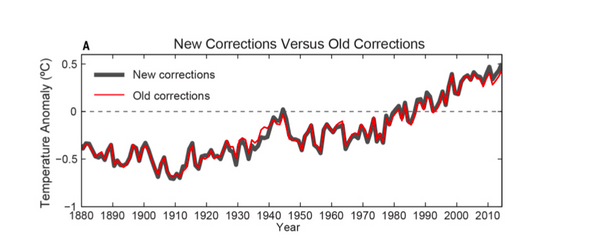
For the casual readers among you, here is the extent of what you’ll probably want to know about the study: the NOAA scientists who assess global temperatures have updated their analysis so that it now includes some new data that they think offers a slight improvement. The key thing to understand — for casual readers and data geeks alike — is that the changes are quite subtle. Don’t believe me? Just look at the figure at the top of this page, which shows how the old version of the NOAA analysis compares to the new one. Their newly corrected global temperature trend is the black line. The earlier version of the trend is the red line.
If you look closely, you will see the changes make the temperatures appear slightly warmer in the last decade, and thus make the idea that there has been a slowdown or “hiatus” in warming less credible. Still, that graph also makes it abundantly clear that the changes are quite minor when you look at the bigger picture. As Gavin Schmidt, director of NASA’s Goddard Institute for Space Studies, put it in a post on the Real Climate blog: “The ‘selling point’ of the paper is that with the updates to data and corrections, the trend over the recent decade or so is now significantly positive. This is true, but in many ways irrelevant.” As he has pointed out many times (as has this blog), it’s the long term trend that matters more than a handful of years here or there.
Still, there is plenty to dig into about the study for climate data geeks. The NOAA team makes the case that they’ve improved their analysis by making some updates to both the sea surface temperature and land surface temperature datasets that are at the core of the analysis. Specifically, they have included the data from the International Surface Temperature Initiative database, which more than doubles the number of weather stations available for the analysis. They have also updated the sea surface temperature by turning to a new version of the Extended Reconstructed Sea Surface Temperature dataset, which does a better job of correcting for differences in temperature measurements collected by floating buoys versus ships. Buoys are known for getting slightly cooler — and more accurate — readings than ships, but ships were the main way data was collected prior to the 1970s. The NOAA team also took a fresh look at how ship-based measurements taken with wooden buckets as opposed to engine intake thermometers compare, and how the differences might affect the overall analysis.
Not enough detail for you? If you want even more info about the study and want to know how the NOAA team came to its conclusion that there has not been a slowdown in warming over the last decade or so, you will find links to a few places where you can start your reading below the chart.

+ The full study as published in Science:
http://www.sciencemag.org/content/early/2015/06/03/science.aaa5632.full
+ Commentary by Gavin Schmidt:
http://www.realclimate.org/index.php/archives/2015/06/noaa-temperature-record-updates-and-the-hiatus/
+ NOAA Press Release about the study:
http://www.ncdc.noaa.gov/news/recent-global-surface-warming-hiatus
+ Doug McNeall (of the UK Met Office) commentary about the study:
https://dougmcneall.wordpress.com/2015/06/04/on-the-existence-of-the-hiatus
+Victor Venema (University of Bonn) commentary:
http://variable-variability.blogspot.com/2015/06/NOAA-uncertainty-monster-karl-et-al-2015.html
+ Nature news article about the study:
http://www.nature.com/news/climate-change-hiatus-disappears-with-new-data-1.17700
+Peter Thorne (International Surface Temperature Initiative) commentary:
http://surfacetemperatures.blogspot.de/2015/06/the-karl-et-al-science-paper-and-isti.html
+ Jay Lawrlmore (NOAA) commentary about the study
http://theconversation.com/improved-data-set-shows-no-global-warming-hiatus-42807
+ Washington Post article about the study:
http://www.washingtonpost.com/news/energy-environment/wp/2015/06/04/federal-scientists-say-there-never-was-any-global-warming-slowdown/
So it’s snake oil, V2.0?
This is the adjusted version of the already adjusted many times revised version. EVERY revision of NASA data has had the effect of producing greater warming in the present and greater cooling of the past (increasing temperature trends where the raw data have none). These latest revisions are simply not justified. Using land based temperatures to infill (create temperature “measurements” where none exist) Arctic sea surface temperatures is especially egregious, as it creates a substantial warm bias that is not present in a largely ice-covered ocean. The temperature dynamics are completely different and unrelated.
The adjustments also completely contradict the satellite sea surface temperature measurements that actually do have global coverage and are not manually manipulated post hoc.
Climate science is the only science of which I’m aware (and my graduate training is in atmospheric science) where the observed data are consistently altered to conform to the theory, rather than the theory revised to conform to actual temperature observations and data.
Human factors contributing to global warming must be controlled ! Global warming is not likely to slow down if we keep harming the environment the way we have in the past.
http://www.greeniesglobe.com/issues.html
Although the corrections did have to be made to the temperature anomoly graph some of the old corrections (red line) is still higher than the grey line or equal. Wouldn’t this still prove that global warming isn’t increasing as fast. If we really want to slow down this global warming we need to start limiting the amount of green house gases and start trying to preserve earth as soon as possible.