[youtube 6yiTZm0y1YA]
These key science points were published on September 27, 2013, as “headline statements” by the Intergovernmental Panel on Climate Change (IPCC) as part of the organization’s fifth assessment report. Background links provided by Earth Observatory.
+Warming of the climate system is unequivocal, and since the 1950s, many of the observed changes are unprecedented over decades to millennia. The atmosphere and ocean have warmed, the amounts of snow and ice have diminished, sea level has risen, and the concentrations of greenhouse gases have increased. Read more about global warming.
+Each of the last three decades has been successively warmer at the Earth’s surface than any preceding decade since 1850. In the Northern Hemisphere, 1983–2012 was likely the warmest 30-year period of the last 1400 years. See maps showing global temperature trends.
+Ocean warming dominates the increase in energy stored in the climate system, accounting for more than 90% of the energy accumulated between 1971 and 2010 (high confidence). It is virtually certain that the upper ocean (0−700 m) warmed from 1971 to 2010, and it likely warmed between the 1870s and 1971. Read more about Earth’s energy budget.
+Over the last two decades, the Greenland and Antarctic ice sheets have been losing mass, glaciers have continued to shrink almost worldwide, and Arctic sea ice and Northern Hemisphere spring snow cover have continued to decrease in extent (high confidence). Read more about Arctic and Antarctic sea ice.
+The rate of sea level rise since the mid-19th century has been larger than the mean rate during the previous two millennia (high confidence). Over the period 1901–2010, global mean sea level rose by 0.19 [0.17 to 0.21] m. Read more about sea level rise.
+The atmospheric concentrations of carbon dioxide (CO2), methane, and nitrous oxide have increased to levels unprecedented in at least the last 800,000 years. CO2 concentrations have increased by 40% since pre-industrial times, primarily from fossil fuel emissions and secondarily from net land use change emissions. The ocean has absorbed about 30% of the emitted anthropogenic carbon dioxide, causing ocean acidification. Read more about the greenhouse effect.
+Total radiative forcing is positive, and has led to an uptake of energy by the climate system. The largest contribution to total radiative forcing is caused by the increase in the atmospheric concentration of CO2 since 1750. Read more about radiative forcing.
+Human influence on the climate system is clear. This is evident from the increasing greenhouse gas concentrations in the atmosphere, positive radiative forcing, observed warming, and understanding of the climate system. Read more about the human fingerprint on the climate system.
+Climate models have improved since the AR4. Models reproduce observed continental-scale surface temperature patterns and trends over many decades, including the more rapid warming since the mid-20th century and the cooling immediately following large volcanic eruptions (very high confidence). Read more about climate models.
+Observational and model studies of temperature change, climate feedbacks and changes in the Earth’s energy budget together provide confidence in the magnitude of global warming in response to past and future forcing. Read more about Earth’s energy budget.
+Human influence has been detected in warming of the atmosphere and the ocean, in changes in the global water cycle, in reductions in snow and ice, in global mean sea level rise, and in changes in some climate extremes. This evidence for human influence has grown since AR4. It is extremely likely that human influence has been the dominant cause of the observed warming since the mid-20th century. Read more about the human influence on climate.
+Continued emissions of greenhouse gases will cause further warming and changes in all components of the climate system. Limiting climate change will require substantial and sustained reductions of greenhouse gas emissions. Read more about greenhouse gases.
+Global surface temperature change for the end of the 21st century is likely to exceed 1.5°C relative to 1850 to 1900 for all RCP scenarios except RCP2.6. It is likely to exceed 2°C for RCP6.0 and RCP8.5, and more likely than not to exceed 2°C for RCP4.5. Read more about global surface temperatures.
+Warming will continue beyond 2100 under all RCP scenarios except RCP2.6. Warming will continue to exhibit interannual-to-decadal variability and will not be regionally uniform. Read more about the NASA GISS tempearture record.
+Changes in the global water cycle in response to the warming over the 21st century will not be uniform. The contrast in precipitation between wet and dry regions and between wet and dry seasons will increase, although there may be regional exceptions. Read more about the water cycle.
+The global ocean will continue to warm during the 21st century. Heat will penetrate from the surface to the deep ocean and affect ocean circulation. Read more about how oceans absorb heat.
+It is very likely that the Arctic sea ice cover will continue to shrink and thin and that Northern Hemisphere spring snow cover will decrease during the 21st century as global mean surface temperature rises. Global glacier volume will further decrease. Read more about sea ice.
+Global mean sea level will continue to rise during the 21st century. Under all RCP scenarios the rate of sea level rise will very likely exceed that observed during 1971–2010 due to increased ocean warming and increased loss of mass from glaciers and ice sheets. Read more about sea surface temperature.
+Climate change will affect carbon cycle processes in a way that will exacerbate the increase of CO2 in the atmosphere (high confidence). Further uptake of carbon by the ocean will increase ocean acidification. Read more about the ocean’s carbon balance.
+Cumulative emissions of CO2 largely determine global mean surface warming by the late 21st century and beyond. Most aspects of climate change will persist for many centuries even if emissions of CO2 are stopped. This represents a substantial multi-century climate change commitment created by past, present and future emissions of CO2. Read more about carbon dioxide.
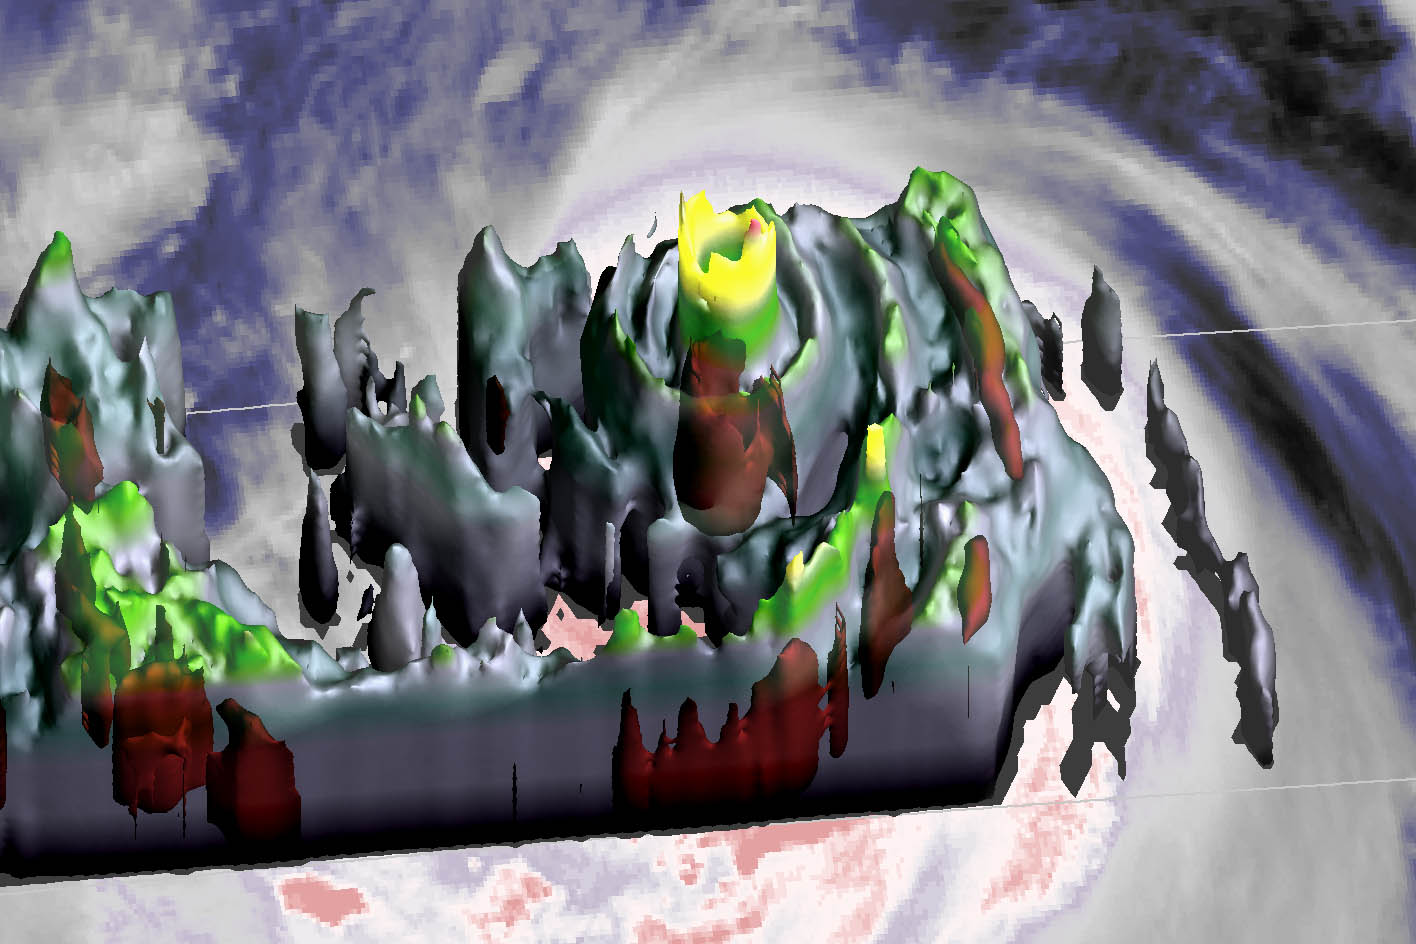
As category 4 Super Typhoon Usagi churned toward Taiwan on September 19, 2013, a satellite orbiting hundreds of miles above used a radar instrument to map the storm’s inner structure. The instrument on the Tropical Rainfall Measuring Mission (TRMM) observed two tall complexes of rain clouds called hot towers in the inner eyewall, a sign that Usagi was a well-organized storm and strengthening.
Tropical cyclone “heat engines” extract heat from the ocean’s surface through evaporation and convert a portion of that energy into destructive winds that circle under the eyewall of the storm. All tropical cyclones have heat engines, but several features detected by TRMM suggested that Usagi’s was running particularly efficiently. Radars almost always see eyewalls in strong tropical cyclones, for instance, but they are rarely as symmetrical as Usagi’s is in the visualization shown above. NASA Goddard Space Flight Center researcher Owen Kelley produced the visualization based on TRMM data from the Precipitation Measurement Missions science team at NASA and from the Japan Aerospace Exploration Agency (JAXA).
In the 3D portion of the image, heavy precipitation is shown in dark red. Light precipitation is gray, green, yellow or light red, with the color reflecting how high the storm has lofted the rain production (higher than 8.5 kilometers is green; above 11.5 kilometers is yellow; and higher than 14 kilometers is red). Note that the underlying image, which shows the temperature of cloud tops, uses a different color scale. In it, cool cloud tops are pink and white, medium temperature cloud tops are gray and blue, and warm cloud tops are dark gray and black.
Even the heavy precipitation at the base of the eyewall is fairly symmetric, which is somewhat unusual according to Kelley. Tropical cyclone eyewalls that are this symmetric are called “annular,” and they have a tendency to maintain their intensity for longer periods than tropical cyclones with more lopsided eyewalls. At two locations in the inner eyewall, updrafts were strong enough to produce hot towers—features that are associated with strengthening cyclones. A few hours after TRMM collected the data visualized here, Usagi intensified briefly into a category 5 storm, the highest category on the scale.
Read this Earth Observatory feature and blog post to learn more about how the late Joanne Simpson pioneered the study of hot towers. The video below, produced by NASA Goddard’s Scientific Visualization Studio, offers another view of how hot towers work.
[youtube kUG4-TEqPYc]
Congratulations to Felix Bossert for being the quickest to solve the September puzzler. The answer is the Chara Sands. See the Image of the Day that published on September 21, 2013, for a second image and details about the area. Also congratulations to Robert Emberson for providing interesting details about the geologic history of the dunes.
It only took Bossert a few hours to get the answer—impressive because we hadn’t even promoted the puzzler through our email newsletter, Facebook page, or Twitter feed. I can’t say I’m surprised because Felix is a veteran of the geology puzzler Where on Google Earth (WOGE). Give WOGE a try, but make sure know the rules and be prepared to host the next WOGE if you win.)

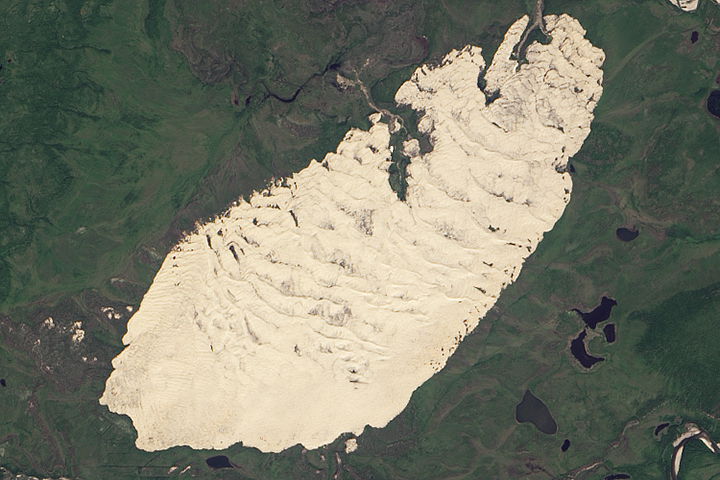
Each month, Earth Observatory offers up a puzzling satellite image here on Earth Matters. The September 2013 puzzler is above. Your challenge is to use the comments section to tell us what part of the world we are looking at, when the image was acquired, and why the scene is interesting.
How to answer. Your answer can be a few words or several paragraphs. (Try to keep it shorter than 300 words). You might simply tell us what part of the world an image shows. Or you can dig deeper and explain what satellite and instrument produced the image, what spectral bands were used to create it, or what is compelling about some obscure speck in the far corner of an image. If you think something is interesting or noteworthy, tell us about it.
The prize. We can’t offer prize money for being the first to respond or for digging up the most interesting kernels of information. But, we can promise you credit and glory (well, maybe just credit). Roughly one week after a puzzler image appears on this blog, we will post an annotated and captioned version as our Image of the Day. In the credits, we’ll acknowledge the person who was first to correctly ID the image. We’ll also recognize people who offer the most interesting tidbits of information. Please include your preferred name or alias with your comment. If you work for an institution that you want us to recognize, please mention that as well.
Recent winners. If you’ve won the puzzler in the last few months, please sit on your hands for at least a few days to give others a chance to play.
Note: See the comment thread for an archive of questions and answers related to this event.
Do you have questions about how NASA measures, models, and visualizes our changing climate?
Here’s your chance to ask them directly. Earth Observatory is hosting a climate Q & A with NASA scientists at 2 pm EDT on Wednesday, September 18. Gavin Schmidt and Benjamin Cook—both climate specialists from NASA’s Goddard Institute for Space Studies in New York City—will be answering questions live via the @NASA_EO Twitter feed. Earth Observatory artists and writers will also be available to answer your questions about how we visualize and communicate climate data.
There’s no such thing as a dumb question. Climate change science can be confusing, complex, and controversial. Our goal is to help you cut through the noise and find out what the science actually says. Need inspiration as you think about your questions? Here are some of the more common questions we’ve received over the years. You can also read through some of our stories about key climate change topics including: warming, aerosols, extreme storms, the water cycle, and the carbon cycle.
Start sending your questions now by posting a comment in the thread below or by sending a tweet tagged #askclimate.
[youtube G0KV2MluelY]
[youtube G0KV2MluelY]
The topic of climate change inspires a lot of debate. At NASA, it has also inspired a lot of science.
NASA scientists examine the Earth’s climate and how it is changing – gaining knowledge (or insight?) through decades of satellite observations, powerful computer models and expert scientific analysis.
Over the course of this month, these NASA climate experts will answer selected questions through the agency’s social media channels – primarily on YouTube, Twitter and Google+.
But first – we need your questions.
Have a question that’s always confounded you about Earth’s climate? Wonder why it matters that the climate is changing now if it has changed before? Or how scientists know changes seen in recent decades are the result of human activities, not natural causes?
Go ahead. Ask a climate scientist.
Here’s how you can take part:
YouTube
NASA scientists will be recording video responses to some of the questions we receive. The responses will be posted to the NASAExplorer YouTube channel.
To submit a question, record a short, 10-15 second video with your question and upload it to YouTube – and be sure to tag the video “#askclimate” so that we can find it. You can also simply post a question on Twitter with the same hashtag, “#askclimate.”
Twitter
NASA scientists will directly answer questions in three separate Twitter chats, covering key climate topics. Again, all these chats will use the hashtag “#askclimate.” You can join in on these dates and at these accounts:
Wed., Sept. 4, 2 p.m. EDT
@NASA_ICE
Wed., Sept. 11, 2 p.m. EDT
@EarthVitalSigns
Google+ Hangouts
On Sept. 27, the U.N. Intergovernmental Panel on Climate Change will release the Summary For Policymakers of its Fifth Assessment Report. This plain-language document, intended for the public, lays out what is a consensus understanding by the scientific community of the state of climate change science.
On Mon., Sept. 30, NASA will host two Google+ Hangouts – one in English, one with Spanish-speaking scientists – to continue the discussion about climate science and answer questions about the IPCC report.
Watch for announcements via NASA’s Google+ and our other social media accounts about the specific times and details for these events.
