
By Alek Petty
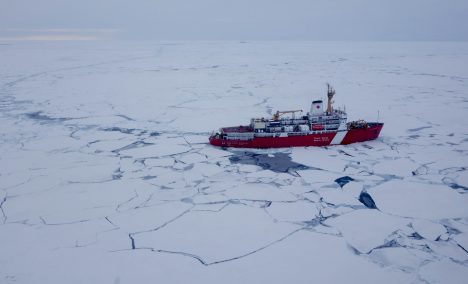
View from a helicopter of our ice breaker, the CCGS Louis S. St. Laurent, taken after Ice Station 1.
The sea ice didn’t last long. We continued the hunt for sea ice suitable enough for another ice station – hoping for something thicker and more stable than last time around. Unfortunately our search was fruitless. The Woods Hole team tried for a quick installation of one of their ice tethered profilers (ITPs) –an ocean surface water profiler- on a thick ice floe that was only around 164 feet (50 meters) in diameter, but the ice was too ridged and porous to be suitable and the operation was quickly abandoned. They instead resorted to deploying two of their ITPs directly into the ocean from the side of the ship (this is less stable than wedging the surface buoy component of the profiler into an ice floe, hence why they’re called ice tethered profilers). Our hopes of getting out onto the ice again quickly vanished.
We were soon back to cruising through the marginal ice edge, which was dominated by newly forming young grey ice with the occasional floe of older, thicker, ice that had survived the summer melt season. We are now back to swaying our way through the high seas – not the kind of scene most people associate with an Arctic expedition. It was with a sense of deep regret that our time within the ice ended with nearly two weeks of the expedition still to go. For me, the expedition just isn’t the same without the sound of ice breaking reverberating around the ship (we’re on an ice breaker after all!)
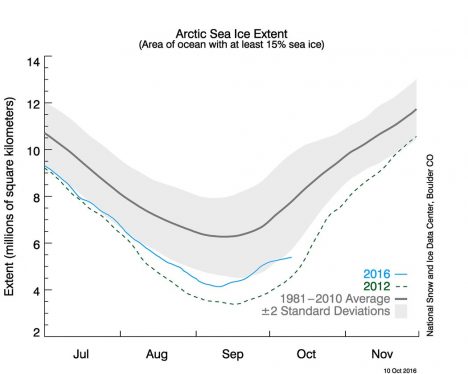
Arctic sea ice extent as of Oct. 10, 2016.
We got a small dose of Internet after leaving the ice (I’m struggling to cope without it!) and I managed to get access to the National Snow and Ice Data Center website, which showed how the Arctic sea ice re-freeze has been really slow this year (see the sea ice extent image above), coinciding with very warm temperatures over much of the Arctic, including the Beaufort Sea. We’ve experienced temperatures only slightly below freezing on this expedition, so my thermals have stayed packed away. In the Beaufort Sea, the ice edge is clearly not heading south at any real speed, although as the temperatures are expected to drop further through the coming weeks and months, a refreeze across the entire Beaufort Sea should be inevitable.
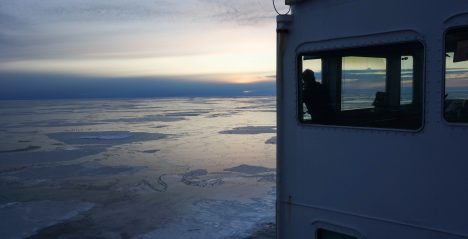
Scientist Adam Monier looks out over Arctic sea ice.
Despite the lack of sea ice (and my associated despondence), the science was still operating at maximum speed. We had a talk from Adam Monier, a French microbiologist from Exeter University (United Kingdom) who talked about his efforts, along with collaborators from Concordia University (Montreal, Canada), to increase our understanding of the microbial communities of the Arctic Ocean. According to Adam, around 90 percent of the global ocean’s biomass is microbial (a mass equivalent to roughly 240 billion elephants!) and this was seriously underestimated as of only a few decades ago. He showed some fascinating results demonstrating how phytoplankton (a micro algae) can cope, and even adapt, to fast changing environmental conditions, like sunlight and access to nutrients – some of which can be linked to the changing Arctic sea ice state. There is still a severe shortage of Arctic data, and this cruise is trying to help fill in those gaps. As phytoplankton are the foundation of the Arctic Ocean’s food webs, understanding how they respond to rapid changes in environmental conditions will be key to understanding how the entire Arctic ecosystem responds to declining sea ice and changes in the Arctic Ocean. The expedition has been a great way for me to learn about the latest developments in Arctic science, and to appreciate how interconnected our various fields of research are.
Tags: Arctic, Beaufort Sea, polar science, sea ice
Pls show / explain what is the actual data being averaged in the plot above. That is, do you have daily aerial imaging data since 1981? If you do not have daily aerial imaging data since 1981, could you pls explain how you construct that plot including which the derivation of the standard deviation shadow shown. Thank-you.
Thanks for the question! We have satellite data of sea ice extent back to 1978. The National Snow and Ice Data Center (NSIDC) produced the plot above, and their website lists more information about the data/figure: http://nsidc.org/arcticseaicenews/. In general we have high confidence in these measurements and the decline in Arctic sea ice extent over the last few decades.
Dear Alek:
Just read all your postings and find them interesting/educational.
Safe travels to you and all involved in this very important research.
Our planet needs you all!
Thank you for your brave efforts – Ann