By Alek Petty
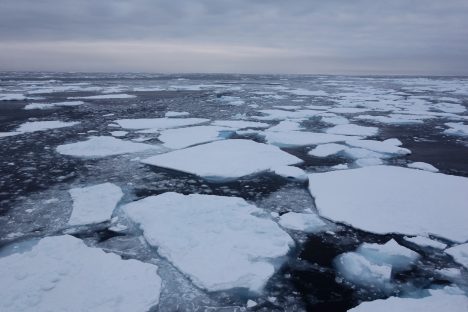
A mix of old and new sea ice floating through the northern Beaufort Sea during one of the last days of the cruise that we observed sea ice.
After 65 Rosette casts, 59 XCTD probes, 61 Bongo tows (nets that collect zooplankton samples), 212 surface water profiles, 40 ocean drifters released, three buoys deployed, one buoy recovered, three deep sea moorings collected and redeployed, eight ice cores collected, and 27 scientists deployed and partially recovered, our expedition around the Beaufort Gyre is finally over! The cruise was a huge success, with virtually all instruments operating successfully. The only downer was the lack of sea ice and our inability to get out onto the ice after Ice Station 1. The lack of ice wasn’t actually a problem for most of the scientists onboard, as they were more focused on measuring the state of the ocean, with the lack of sea ice providing interesting, albeit worrying, context for their measurements compared to previous years.
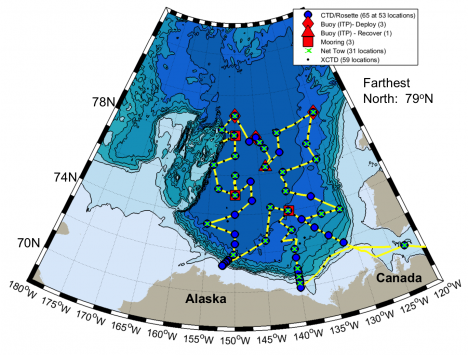
Final Joint Ocean Ice Study 2016 cruise map (Sept. 22-Oct. 18, 2016)”. Courtesy of Chief Scientist Sarah Zimmermann.
As I said back in my first blog entry, one of the key objectives of the expedition was to produce an up-to-date assessment of the freshwater content of the Beaufort Gyre. Based on a preliminary analysis of the data collected on this cruise, my colleagues reckon the total freshwater content of the Gyre could be at a record high. A chemical analysis of the ocean surface suggests that sea ice melt contributed around 20 percent of the fresh water mixed up within the surface waters, compared to around 80 percent from Canadian and Russian rivers flowing into the Arctic. The sea ice contribution was thought to be neutral a few decades ago, but the ice is now melting more than it’s growing, as we clearly witnessed, causing an imbalance. The wind circulation is also important in driving the ocean circulation that sucks in fresher surface waters into the Gyre (see an earlier blog of mine for more details).
Why does this all matter? Well, some scientists posited that the Beaufort Gyre oscillates between periods of spinning up and sucking in freshwater, and spinning down and releasing fresh water. A kind of breathing, if you like. The Gyre has been spinning up and sucking in fresh water for a few decades now (2008 saw a big increase) and we keep waiting, with similarly bated breath, for this trend to reverse. If the Gyre does reverse (breathe out), the Arctic Ocean will likely dump a load of fresh water into the Atlantic Ocean (as we think it did in the 1970s), which could cause some big impacts on weather patterns across the Northern Hemisphere. We’re not expecting a scene out of The Day After Tomorrow, but we’re not entirely sure what could happen either.
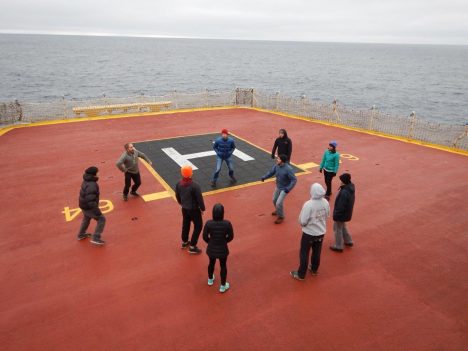
Hacky sack on the helideck. You can spot me by the bright orange hat.
It will take scientists a while to pour through all the data collected on this cruise and place this year’s findings into context. We spent our last few days compiling reports to summarize and document the data collected (in between games of hacky sack on the helideck). I’ve taken a look at some atmospheric data since I got back, and it appears the Beaufort Sea region was experiencing really warm, maybe even record warm, air temperatures throughout October. The data collected this year could therefore offer us a glimpse of what might be a new normal for the Beaufort Gyre and other regions across the Arctic Ocean.
I wasn’t able to cover all the science that happened on the ship during this blog series, but I hope you got a flavor for some of our primary scientific activities and have a better understanding of why it is we keep coming back to profile the Beaufort Gyre. I’m not sure if I will be out again next year, but I’ll be sure to let you know if I do. Thanks for reading, and do get in touch if you have any questions!
The Joint Ocean Ice Study is a collaboration between the Department of Fisheries and Oceans Canada (DFO) researchers with colleagues in the USA from Woods Hole Oceanographic Institution (WHOI). The scientists from WHOI lead the Beaufort Gyre Exploration Project, which maintains the Beaufort Gyre Observing System as part of the Arctic Observing Network. In addition to WHOI and DFO, the 2016 participants (those on board plus those on shore) come from three Japanese, five American, and six Canadian universities and research laboratories. Annual sampling of set oceanographic stations and mooring re-deployments since 2003 aboard the CCGS Louis S St-Laurent have built a time-series of physical and chemical properties of seawater, phytoplankton, zooplankton, and ice observations reaching from shelf waters to 79N across the Beaufort Sea. More information can be found on the Fisheries and Oceans Canada website.
By Alek Petty
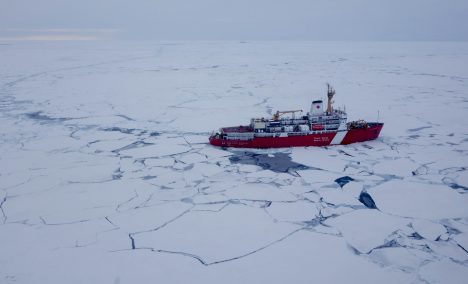
View from a helicopter of our ice breaker, the CCGS Louis S. St. Laurent, taken after Ice Station 1.
The sea ice didn’t last long. We continued the hunt for sea ice suitable enough for another ice station – hoping for something thicker and more stable than last time around. Unfortunately our search was fruitless. The Woods Hole team tried for a quick installation of one of their ice tethered profilers (ITPs) –an ocean surface water profiler- on a thick ice floe that was only around 164 feet (50 meters) in diameter, but the ice was too ridged and porous to be suitable and the operation was quickly abandoned. They instead resorted to deploying two of their ITPs directly into the ocean from the side of the ship (this is less stable than wedging the surface buoy component of the profiler into an ice floe, hence why they’re called ice tethered profilers). Our hopes of getting out onto the ice again quickly vanished.
We were soon back to cruising through the marginal ice edge, which was dominated by newly forming young grey ice with the occasional floe of older, thicker, ice that had survived the summer melt season. We are now back to swaying our way through the high seas – not the kind of scene most people associate with an Arctic expedition. It was with a sense of deep regret that our time within the ice ended with nearly two weeks of the expedition still to go. For me, the expedition just isn’t the same without the sound of ice breaking reverberating around the ship (we’re on an ice breaker after all!)
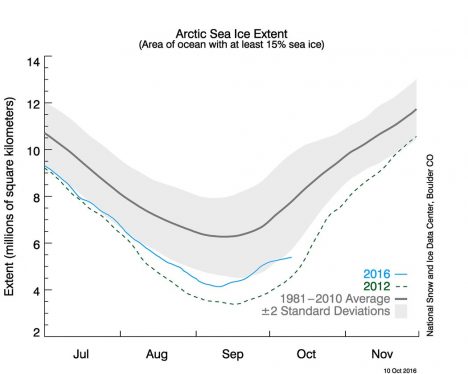
Arctic sea ice extent as of Oct. 10, 2016.
We got a small dose of Internet after leaving the ice (I’m struggling to cope without it!) and I managed to get access to the National Snow and Ice Data Center website, which showed how the Arctic sea ice re-freeze has been really slow this year (see the sea ice extent image above), coinciding with very warm temperatures over much of the Arctic, including the Beaufort Sea. We’ve experienced temperatures only slightly below freezing on this expedition, so my thermals have stayed packed away. In the Beaufort Sea, the ice edge is clearly not heading south at any real speed, although as the temperatures are expected to drop further through the coming weeks and months, a refreeze across the entire Beaufort Sea should be inevitable.
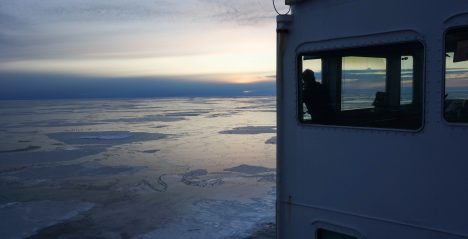
Scientist Adam Monier looks out over Arctic sea ice.
Despite the lack of sea ice (and my associated despondence), the science was still operating at maximum speed. We had a talk from Adam Monier, a French microbiologist from Exeter University (United Kingdom) who talked about his efforts, along with collaborators from Concordia University (Montreal, Canada), to increase our understanding of the microbial communities of the Arctic Ocean. According to Adam, around 90 percent of the global ocean’s biomass is microbial (a mass equivalent to roughly 240 billion elephants!) and this was seriously underestimated as of only a few decades ago. He showed some fascinating results demonstrating how phytoplankton (a micro algae) can cope, and even adapt, to fast changing environmental conditions, like sunlight and access to nutrients – some of which can be linked to the changing Arctic sea ice state. There is still a severe shortage of Arctic data, and this cruise is trying to help fill in those gaps. As phytoplankton are the foundation of the Arctic Ocean’s food webs, understanding how they respond to rapid changes in environmental conditions will be key to understanding how the entire Arctic ecosystem responds to declining sea ice and changes in the Arctic Ocean. The expedition has been a great way for me to learn about the latest developments in Arctic science, and to appreciate how interconnected our various fields of research are.
By Alek Petty
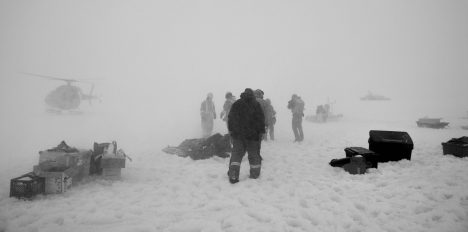
Working on thin Arctic sea ice.
After five days of cruising through open water, it was clear we had to change course and venture further north to find ice. The satellite imagery was showing ice above 76-77 degrees North (we were around 74 degrees North), and the ice edge didn’t seem to be drifting south at any real speed. After another few days voyage northwards, we thus finally found ourselves entering the Arctic sea ice pack. This wasn’t exactly a scene from the Titanic; the transition from water to ice was a gradual one, as the ice cover evolved from millimeters or centimeters of newly forming sea ice (nilas and grease ice), to thicker, consolidated ice floes (maybe a meter or two thick; 3.3 to 6.6 feet), which caused the ship to lurch and shake as it broke its way through.
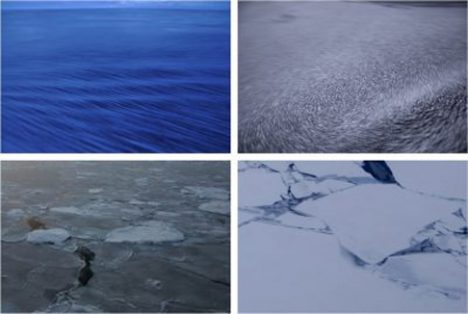
Early stages of sea ice growth: nilas (top left), pancake ice (top right), young grey-white ice (bottom left) and first-year ice (bottom right). The top photos are courtesy of Jean Mensa.
Once we were well within the ice pack, the Woods Hole team was keen to get out onto the ice and deploy some buoys. This would be my chance to get out on the ice too, as I was helping lead efforts to collect ice thickness measurements and ice cores, to better understand the characteristics (like salinity, density and age) of this year’s Beaufort Sea ice pack. The microbial and microplastic scientists were keen to join in and collect their own ice cores, too, enabling them to take a deeper look at what else might be hiding within the ice.
The Woods Hole team leader flew out with the helicopter pilot early the next morning to hunt for thick ice, and seemed to find an ice floe thick and stable enough for us to work on. I joined them on the first science flight out a few hours later to set out our survey lines and coring sites, before our cargo was carried over and the rest of the team members joined us. It was soon apparent that the ice wasn’t as thick as we had hoped.
I drilled a few quick holes and the readings all came in at around half a meter, just above what might be considered safe to work on. Our polar bear guard, Leo, wasn’t too happy with the conditions either and soon found a few good sized holes and cracks circling us. We were under strict orders not to stray from the group and to test the ice for stability as we moved ahead. I’ve previously used data from satellites, planes, and sophisticated computer simulations to estimate the thickness of Arctic sea ice. Yesterday, I estimated ice thickness by hitting it with a stick.
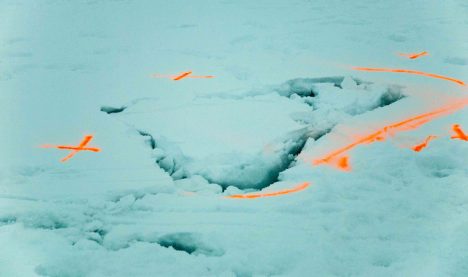
Danger ice!
It wasn’t quite vertical limit, and the group rebuffed my idea of roping together for dramatic effect, but there were still a few hairy moments when the odd leg found its way through the ice. Despite the added element of danger, all operations completed successfully and we hitched a lift back to the ship later that afternoon with our ice cores in tow. The Woods Hole team was working until last light to get their buoys prepped and ready to drift off through the Arctic. It was a fun, adrenaline-filled day of science, but I’d prefer it if we could find some thicker ice to work on next time around.
By Alek Petty
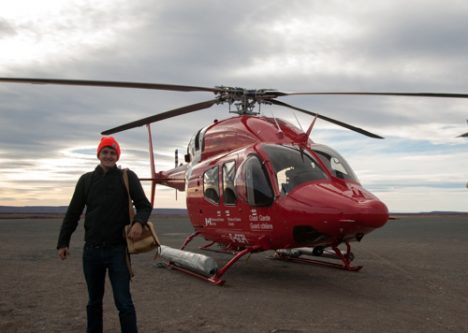
My journey up to the ship went smoothly and I even had time to observe the Northern Lights (Aurora Borealis) in full bloom during our overnight layover in Yellowknife (in the Northwest Territories of Canada). The following day, a Canadian Coast Guard helicopter transferred us from Kugluktuk airport onto the ship, and after another day spent refueling and replenishing the boat, we were finally on our way to the Arctic Ocean.
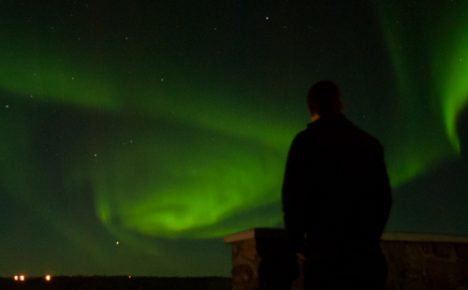
The Northern Lights.
The Louis S. St. Laurent ice breaker.
I actually spent the first two days of our polar expedition sat out on deck, enjoying the sunshine and views over the Amundsen Gulf. In the distance I could just about make out the mouth of the Mackenzie River delta – a key outflow of fresh and mineral rich river runoff into the Arctic. This shelf sea region is rich in wildlife, including beluga whales and even narwhals. We looked out eagerly, but only spotted a couple of lowly seals in the distance. Maybe on our way back we’ll have more joy.
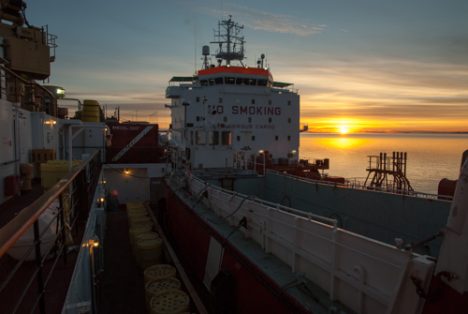
On Saturday morning, we emerged into the Arctic Ocean proper —the Beaufort Sea! — where conditions were a bit less serene. In fact, one of the consequences of the diminished Arctic sea ice cover over the past decades has been an increase in Arctic Ocean waviness, as the lack of sea ice enables winds to more effectively whip up the ocean. Arguably one of the most distressing impacts of climate change for us unhardened scientists.
Despite the continued lack of sea ice, the water sampling exercises have begun in earnest. At each research station (a virtual station if you will, we just stop at a predetermined location in the ocean) a large metal carousel with various water samplers attached —a rosette, as we call it— is released, profiling the water column as it sinks to the bottom of the ocean, before being hauled back up to the ship for analysis.
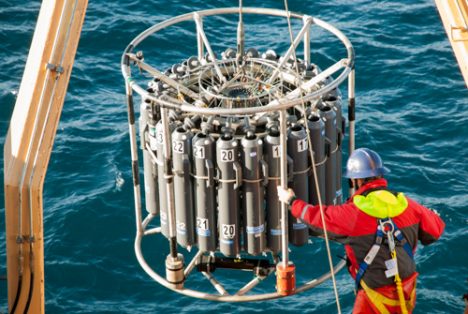
A rosette deployment.
There are around 50 stations in total that we plan on hitting during this expedition. The various scientists on board all have their own things their looking for in the water —plankton, bacteria, alkalinity, dissolved inorganic/organic carbon, micro-plastics (yep, they make it to the Arctic Ocean too), etc. You name it, we’re sampling it.
One of my tasks, along with Japanese scientist Seita Hoshino, is to profile the water column in-between theses stations using XCTD (eXpendable Conductivity Temperature and Density) probes. XCTDs provide a quick and cheap (well, about $800 per probe, so not that cheap) real-time analysis of the temperature and salinity of the water column while the ship is moving. I’ll try and show you an example profile in a later blog post.
We’re hoping to hit some ice soon, as for us ice observers there’s not a whole lot for us to get really excited about yet. It’s quite the contrast to the cold, icy conditions of my 2014 expedition thus far…
By Alek Petty
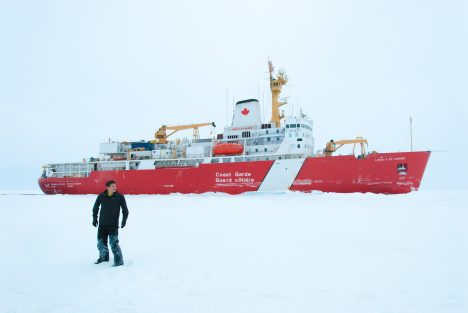
Your blogger, Alek Petty, out on the ice during the 2014 Joint Ocean Ice Study research expedition, with the Louis S. St. Laurent in the background.
Hello and welcome to my new blog. I’m Alek Petty, a sea ice scientist at NASA’s Goddard Space Flight Center, currently making my way to the northern coast of Canada (a small town called Kugluktuk) to embark on the 2016 Joint Ocean Ice Study (JOIS) – a research expedition around the Arctic Ocean’s Beaufort Gyre. The Beaufort Gyre is a slowly-rotating icy body of water north of Alaska (see map), which covers an area roughly ten times the size of Lake Michigan and stores a significant fraction of the Arctic Ocean’s freshwater.
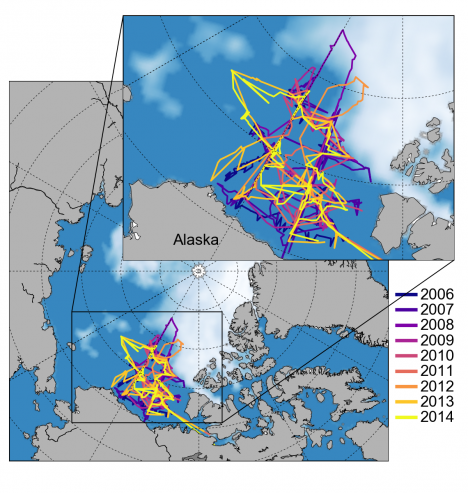
Cruise tracks from previous JOIS expeditions during 2006-2014 and the sea ice concentration around this year’s summertime minimum extent on Sept. 10 (from NSIDC).
The expedition I’m going to be on has occurred every summer since 2003 – coinciding with the Arctic annual sea ice minimum, which typically happens in September – providing us Arctic scientists with a unique opportunity to monitor this harsh, but climatically significant region. The goal of these expeditions is to better understand the Beaufort Gyre’s circulation, freshwater content, water mass properties and biota distributions. I’ve been lucky enough to be invited on my second expedition to support this year’s planned sea ice observations.
We will be taken around the Beaufort Gyre by the Louis S St. Laurent, a Canadian Coast Guard icebreaker specially designed to smash its way through the sea ice covered oceans (sea ice can be several meters thick in places). About a week ago, we observed this year’s sea ice minimum, which tied 2007 for the second lowest on record. The Arctic sea ice declines over the past decades have meant yachts and even a luxury cruise liner (with the aid of an icebreaker, they often leave that bit out in the news stories) are now navigating through the southern Arctic Ocean, including the newly opened Northwest Passage – made famous by Franklin’s failed traverse back in 1845 (when the ice was a lot thicker) and commemorated in this heartfelt tune by Canadian folk singer Stan Rogers.
While the diminished Arctic sea ice cover has made navigation easier than it used to be, especially for icebreakers, one of the primary objectives of our expedition is to deploy buoys into the ice that can collect measurements of the sea ice-atmosphere-ocean system as they drift through the Arctic Ocean (ice-tethered profilers). One of our initial goals will therefore be to search for sea ice thick enough to ensure that the ice isn’t going to melt out any time soon. One of my primary activities over the next few weeks will be to observe the extent and magnitude of sea ice freeze-up as we make our way north, the days begin to shorten, and the temperatures start to drop.
I look forward to giving you a better overview of what the trip is all about in future blog posts (we’re not just scouting for polar bears, promise), including some background to all the various scientific projects being undertaken. Stay tuned!
