By Walt Meier
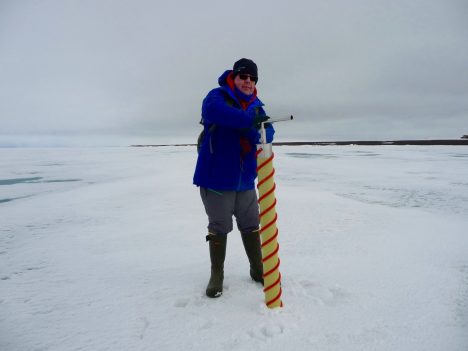
Walt Meier coring sea ice.
May 31, 2016 — The morning sessions this week have been inside in a classroom setting. It’s been like being back in school, which has been quite fun (believe it or not). For the first four days I’ve been a student, but today I got to be the teacher. I gave the class a lab exercise working with satellite data. The “students” went through several days of imagery and calculated sea ice extent, first for the entire Arctic and then for a region around Barrow, Alaska. One of things this showed is that there are different methods to calculate sea ice extent, each with some advantages and limitations, each giving a slightly different answer. No data is perfect, so this variation in the data gives an indication of the uncertainty of the estimate.
One of the reasons for the differences is that the resolution of the satellite data varies, from 25-kilometer (15.5-mile) grid cells down to 1-kilometer (0.6-mile) cells. This makes a big difference in how well we can resolve ice features. The lower resolution data obviously does not provide the detail of the higher resolution, but in turn it has more complete coverage. So there is a trade-off one has to make. For conditions immediately around Barrow, higher resolution is better, but such data is not always available. For the entire Arctic, having complete data is useful, even if the resolution is lower.
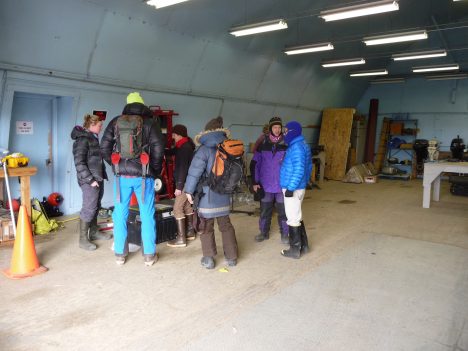
The scientists prep to go on their Grand Challenge.
In the afternoon, we did our last day in the field and it was a “Grand Challenge” activity. Last night, we were challenged by the leaders of the workshop to use what we learned the first four days to come up with a science question and attempt to answer it by collecting data on the ice. We needed to develop a plan and then implement it today. The question we came up with was to try to determine if the ice would break out from the Barrow coast earlier than normal this year. To help answer that question, we realized we needed data from a different site than what we had used the first four days. Field observations are really valuable, but because they are limited to a small area, it’s hard to tell if they are representative of the larger area. During our snow machine morphology activities, the groups noticed that the ice conditions seemed to change as they headed north. The ice seemed more solid and uniform, with fewer ponds.
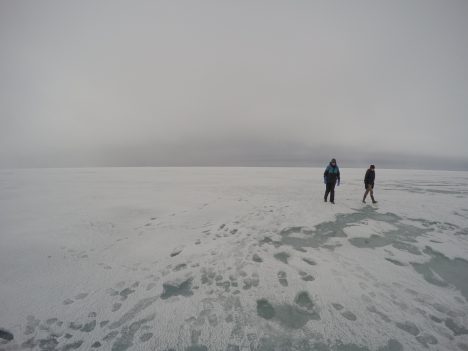
Out on the ice.
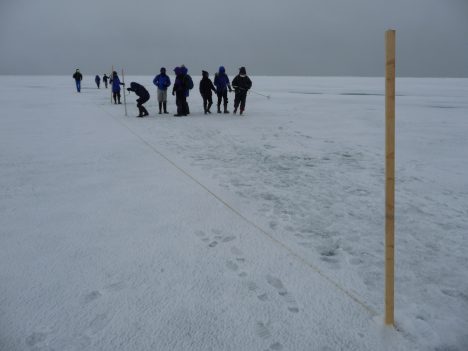
Laying out the sampling line.
So this afternoon we set out a new site a couple miles farther north. The ice was quite different; it was more uniform in appearance, with a white crust of large crystals of crumbly ice on top. We found the ice to be about 10 centimeters (4 inches) thicker than at the southern site and more uniform in thickness. That data and other measurements will be put together tonight and tomorrow. Then we’re going to enter that data into a simple model and run the model with typical weather conditions to see when the ice may become thin enough to break up.
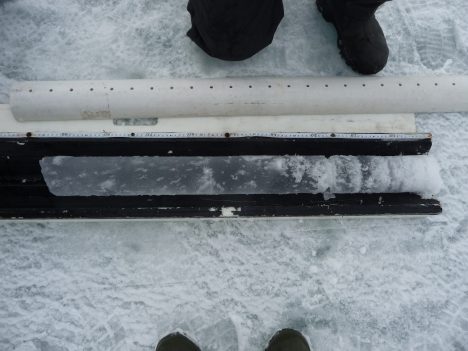
An ice core.
Tonight, the workshop organizers, Don Perovich of CRREL and Marika Holland of NCAR, gave a public talk to the community at the Inupiat Heritage Center in town. Don talked about observations of sea ice and how it has changed over the years, both around Barrow and throughout the Arctic. Then Marika discussed climate models and their projections for the future. The room was full of local residents and the community was quite engaged – there were many questions afterward. The residents here know first hand that the climate is changing because their community is already being affected by the warming: the earlier opening of sea ice is necessitating adaption of their hunting practices, lack of ice is allowing more storm surges and coastal erosion, and warming temperatures are starting to thaw the tundra.


