I’m writing this post on our last day in St. Mary’s, Alaska. This tiny village of about 560 inhabitants had its surroundings ravaged by two large tundra fires in the summer of 2022. The East Fork fire was the second largest tundra fire in Alaska in over 40 years and the biggest in Southwest Alaska. These events were historic, and I could start this post by writing about the intense and productive three weeks of work we had here. However, this whole project started much earlier.
I started this Ph.D. with plans to do field work in Siberia. However, halfway through, due to the pandemic and geopolitical issues, I saw all those plans slip through my fingers. Despite being from a country with among the greatest biodiversity in the world (Brazil), the arctic-boreal environments have always fascinated me. So in the winter of last year, when I came across these fires while analyzing satellite images, I knew this was a unique opportunity to pack my bags and finally be in the tundra. I remember showing the first satellite images and data of these fires to my supervisor, Dr. Sander Veraverbeke, and he confirmed that these fires were indeed scientifically very interesting and logistically feasible for our expedition. From then on, a long process of preparation began.
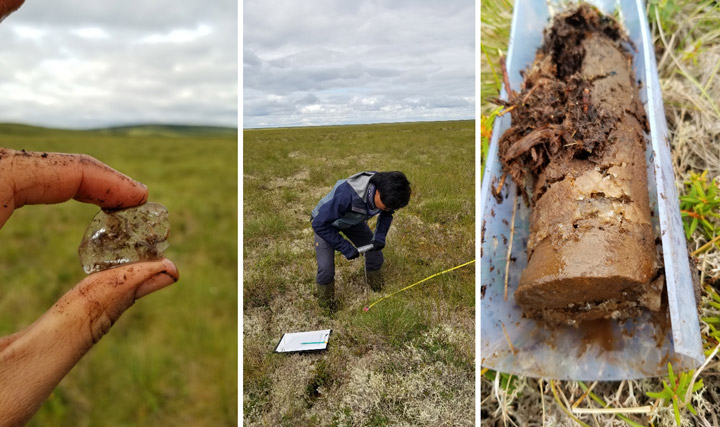
As this field campaign is part of my Ph.D. project, I was responsible for planning both the scientific and logistical aspects. Now, reflecting after the final day of sampling, it is incredibly rewarding to see that the planning has paid off. We sampled 11 days by boat along the Andreafsky River sampling the East Fork fire and another five days by helicopter sampling the Apoon Pass fire. Our main goal was to estimate the carbon combustion from these fires, that is, the area-normalized emissions in grams of carbon per square meter. Field measurements are the prime way to accurately quantify carbon combustion. To do it, we collected soil samples and estimated the burn depth of the soil organic layer. It is crucial to advance the quantification of tundra fire carbon combustion and understanding its environmental drivers.
In addition to carbon emissions, another key point of our expedition is to understand the effects of fires on permafrost. Previous research has shown that fires in the boreal forest increase the thaw depth of the active layer above permafrost, which can lead to permafrost degradation. We are curious to investigate this mechanism in the tundra, even more so now that we have found ice-rich permafrost during our fieldwork.
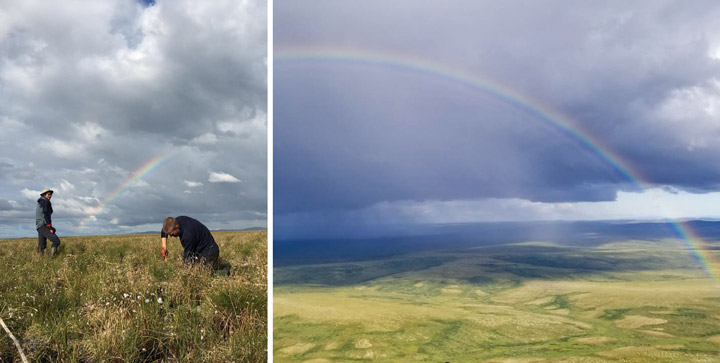
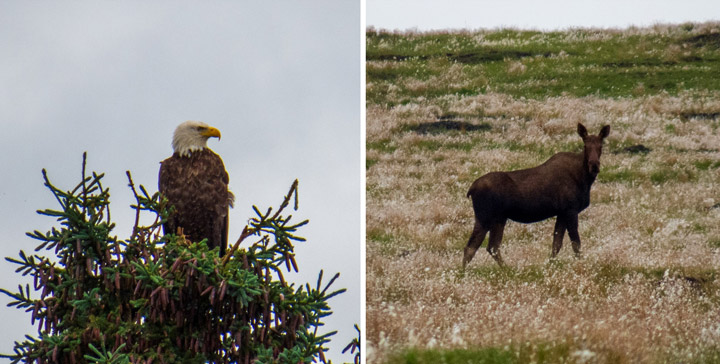
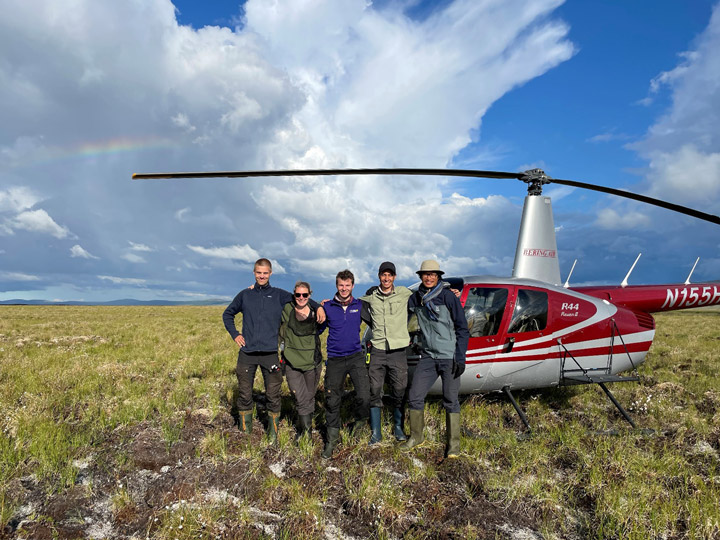
But it was not just the work that was amazing during this campaign. The tundra landscape was always breathtaking. Both from above with the helicopter and along the river from the boat. We were presented with a stunning rainbow on our first day using the helicopter. Wildlife was always around: moose, bears, beavers, eagles, geese, and countless other bird species.
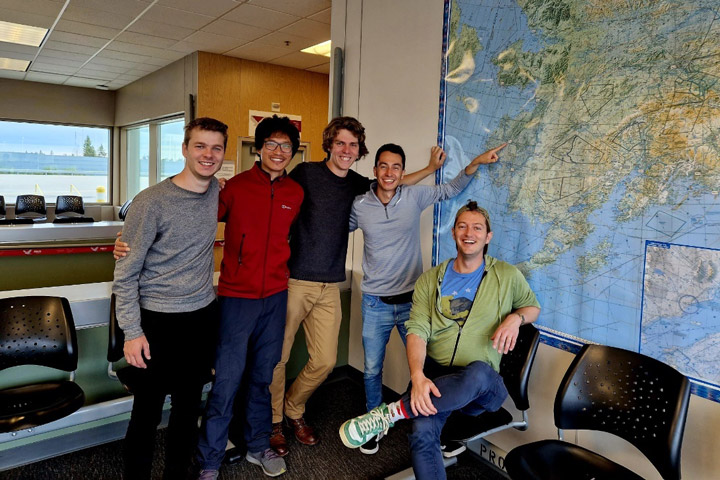
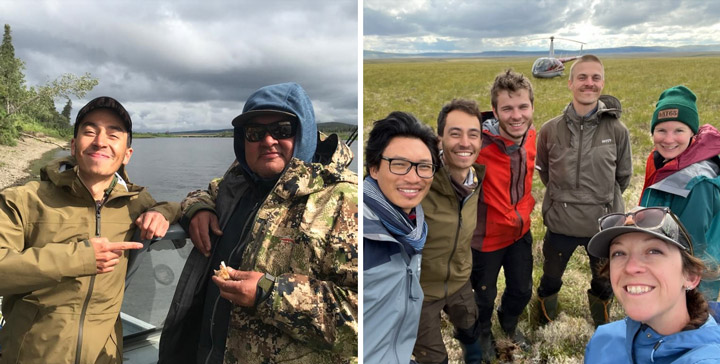
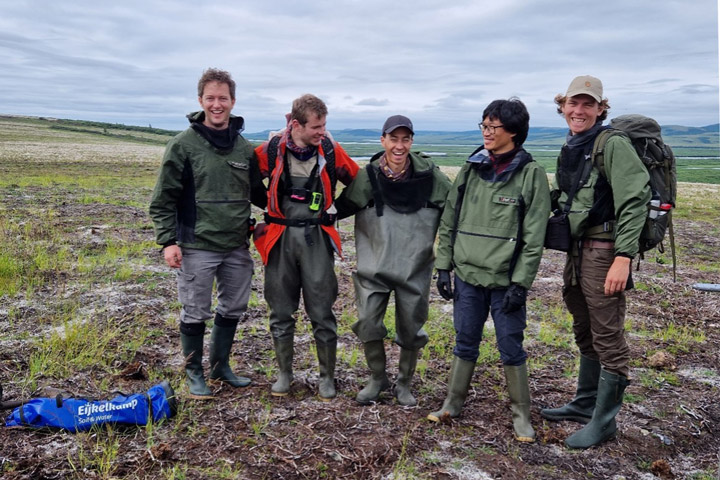
Lucas Ribeiro Diaz, Max van Gerrevink, Rebecca Scholten, Sonam Wangchuk, Thomas Janssen, Thomas Hessilt, and Sander Veraverbeke were part of this field expedition. Our team is part of the Climate & Ecosystems Change research group at the Vrije Universiteit Amsterdam. However, the success of this campaign would not have been possible without the help of our boat driver, David ‘Matty’ Beans, and our helicopter pilot, Savanna Paulsen. We are also grateful to the city of St. Mary’s and its people for warmly welcoming us during these weeks. Finally, Dr. Lisa Saperstein from the U.S. Fish and Wildlife Service in Alaska has provided tremendous help when we were organizing our campaign.
45 plots, 1,383 tussocks measured, 255 soil samples, 495 thaw depth measurements—numbers like these make us believe that we have just concluded a field campaign on some of the most densely sampled tundra fires in the history of science. Now, we have three more weeks of work ahead of us at the USGS soil laboratory in Anchorage. With lots of ideas in my head, I’m excited to see the new findings this valuable data can reveal!
I have just finished writing this post and I realize that perhaps it is too personal. But it could not be otherwise. Our science often blends in with who we are, our dreams and expectations. I leave St. Mary’s feeling fulfilled, I think I have always dreamed of being here. I leave the tundra sure that moments like this are the reason I decided to embark on this journey of doing research.
This tundra fires field expedition is part of FireIce (Fire in the land of ice: climatic drivers & feedbacks). FireIce is a Consolidator project funded by the European Research Council. FireIce is affiliated with NASA ABoVE. This blog post was written by Lucas Ribeiro Diaz, a Ph.D. student at Vrije Universiteit Amsterdam, studying arctic-boreal fires by combining field and remote sensing approaches.
Just like the undulating terrain of the tussocky tundra we traverse, our days also take unexpected twists and turns. After a beautiful last day of sampling the East Fork fire scar along the Andreafsky River, where three moose visited us and delivered a personal goodbye, we were all excited for our first day of sampling the Apoon Pass fire scar via helicopter. But our spirits were momentarily dampened by news of Savanna, our pilot flying in from Nome, getting stuck in a thunderstorm on her way to our base in St. Mary’s, Alaska. Her arrival, delayed until early afternoon, was just the prelude to a challenge-laden morning.
Further issues emerged with our satellite communications device, requiring transatlantic collaboration with our colleagues in Amsterdam (many thanks to Thomas for his unwavering support!) These obstacles left us momentarily uncertain about the feasibility of flying at all that day. Miraculously, by 2 p.m., the looming cumulus of problems and bad weather began to disperse, and by 2:30 p.m., with a renewed sense of purpose, we embarked on our mission to sample the second fire of our field campaign.
The flight itself proved to be a standout experience, treating us to a breathtaking panorama over the hilly tundra that we had sampled along the Andreafsky River in the preceding days. The Apoon Pass fire scar, though not far from the East Fork fire, is geographically quite different, as it is located in very flat lowland terrain. Flying over the last crests of the hill range provided a captivating sight of the vast lowlands extending in all directions.
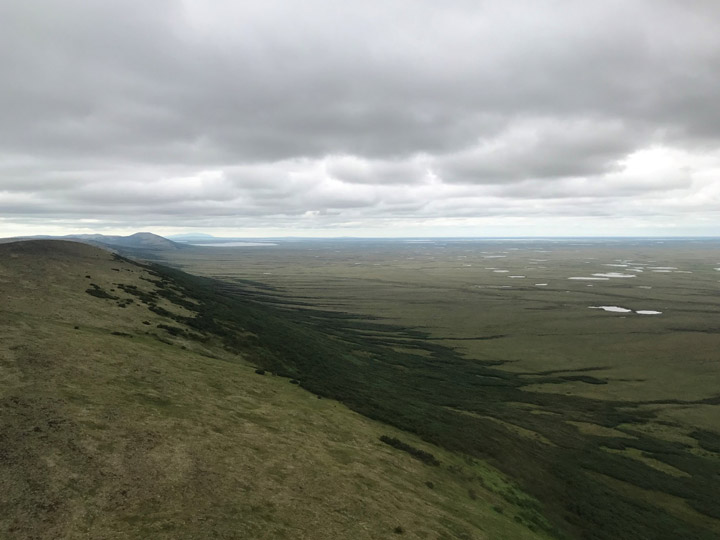
To our surprise, we were only able to spot the difference between burned and unburned tundra when descending to a relatively low altitude. This observation, together with the satellite imagery prepared by our campaign lead Lucas, led us to an initial conjecture that fire severity would be lower than what we had previously seen.
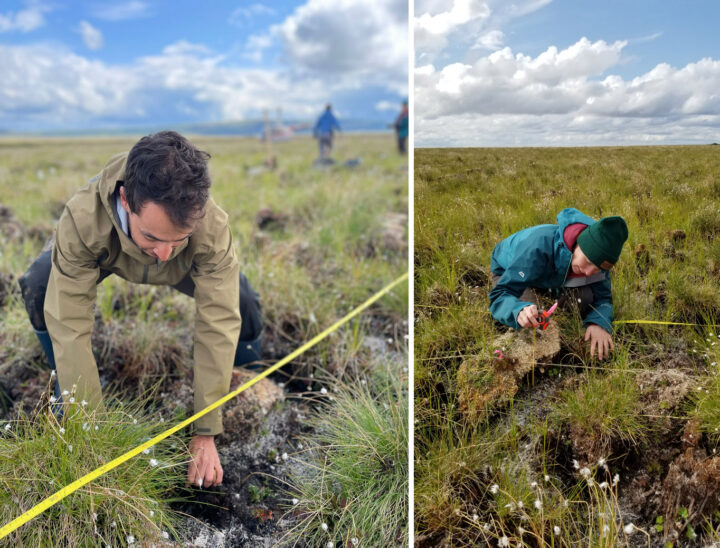
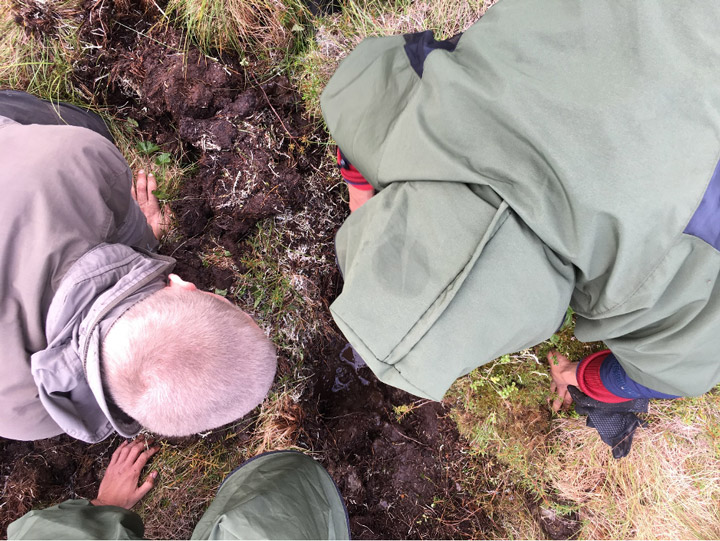
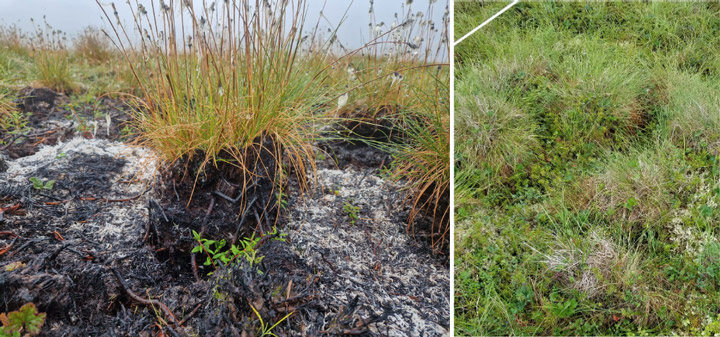
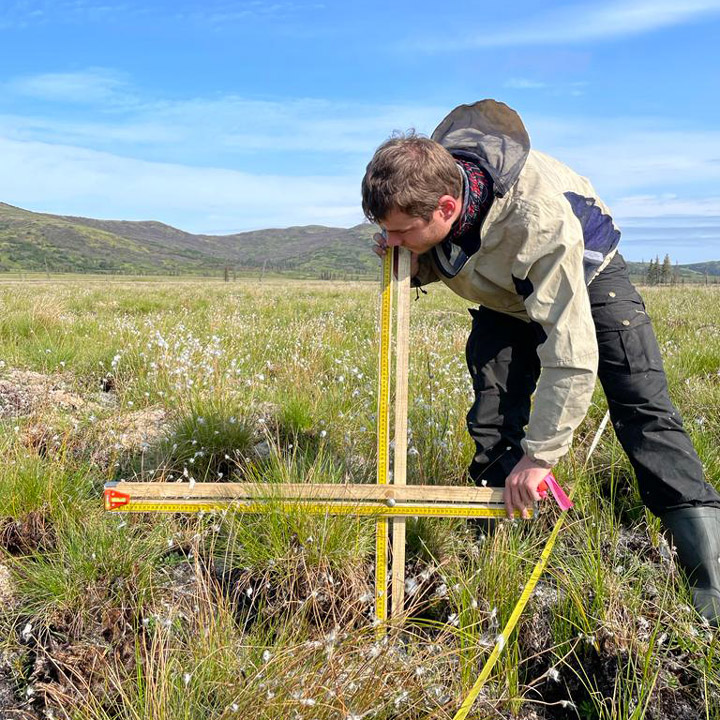
To systematically assess fire severity and carbon emissions in our plots, we are following protocols established by Mack et al. (2011) and Moubarak et al. (2023) for tundra fires in Alaska. We use two independent methods to estimate the burn depth based on the height of tussocks and Sphagnum (peat moss) patches in our plots. For the tussock-based method, we compare the height of tussocks that survived the fire with the height of tussocks in unburned locations. This gives us an estimate how much duff and other organic material has been combusted. For the Sphagnum-based method, we connect different moss patches of similar height with a thread and measure the distance from the thread to the surface at 25-centimeter intervals. This will give us an overview of the variability in burn depth within our sampling locations.
These two measurements will allow us to quantify the amount of carbon combusted per plot, which we can relate to the satellite imagery, as well as to the thickness of the active layer we are measuring at each plot to assess how the fire is affecting the permafrost.
In the end, to our surprise, our first helicopter day turned into one of the best sampling days we had during the campaign so far. We were gifted with beautiful, sunny weather until 9 p.m., and sampled even more plots than we had initially expected. We have now become a well-oiled machine, capable of sampling a plot within a mere hour and a half. Having the helicopter with us at all times offered an invaluable advantage—the ability to swiftly transport parts of our team to nearby sampling sites. After having returned to our base, we are excited for another day in the beautiful tussock tundra of southwestern Alaska—keeping our fingers crossed for another couple of days of good weather!
In 2022, severe lightning ignited many fires in Alaska. Notably, several exceptionally large fires burned in the tundra of Southwest Alaska, an ecosystem that is traditionally less prone to fire. While our understanding of the carbon emissions of boreal forest fires in Alaska and Canada has strongly advanced in recent years thanks to the work of several teams within NASA’s Arctic-boreal Vulnerability Experiment (ABoVE), the impacts of these tundra fires on the ecosystem’s carbon balance and permafrost has remained less well known.
Our Climate and Ecosystems Change research group from the Vrije Universiteit Amsterdam in the Netherlands is currently in Southwest Alaska to fill these critical knowledge gaps. Our team received tremendous help of Dr. Lisa Saperstein from the Alaska Fish and Wildlife Service in organizing the campaign. Lisa will also start a field campaign in the same fires in the next few days and we plan to pool our datasets to maximize synergies between our efforts.
The 2022 East Fork and the Apoon Pass fires together burned more than 100,000 hectares (380 square miles) of primarily tundra landscapes in Southwest Alaska. They were among the largest tundra fires on record for the region.
Our basecamp is the village of St. Mary’s, located just west of the East Fork fire on the Andreafsky River. For the first part of our campaign, we are taking a boat upstream to access the fire scar. We are looking for burned tussock tundra sites, where we can measure the effects of the fire on the vegetation, soils, and permafrost in our plots. We are also sampling unburned tundra sites, which provide us a reference of the conditions without fire disturbance. During the last part of our campaign we will access sites in the remote Apoon Pass fire by helicopter.
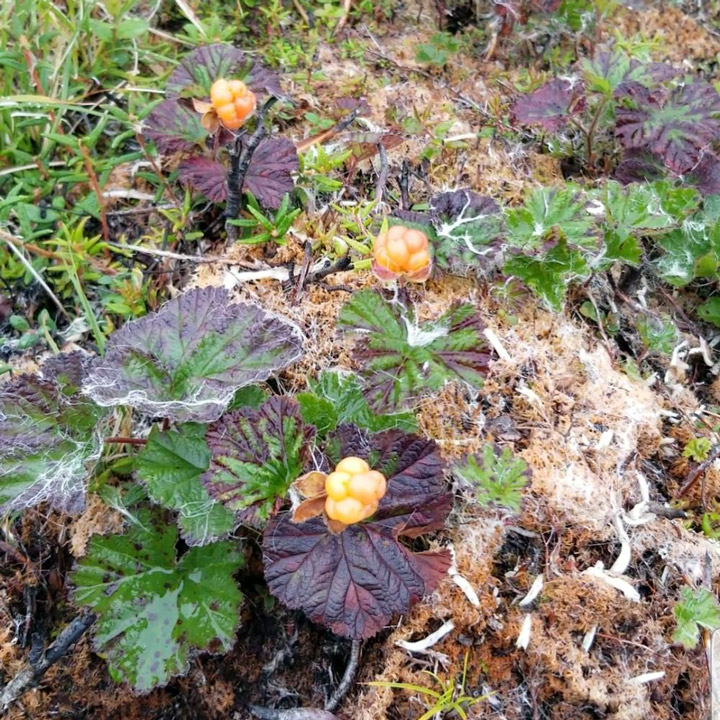
The local community heavily relies on the landscape for subsistence activities, like hunting and berry picking. Our boat driver, Matty Beans, is native to the area and is extremely helpful in bringing us to the right places. A large concern of the community is how the fire has effected the abundance of berries in the burned tundra. Our preliminary observations indicate that the cloudberries, locally also called salmonberries, were abundantly present in the burned sites. However, this was not the case yet for blueberries.
So far, we have been extremely lucky with mostly dry weather and only a little bit of rain. However, the dry weather has affected the water levels in the Andreafsky River. We came across collapsed river banks and exposed sand banks in the river. Our boat driver has switched to his jet boat so that we can continue on, even in more shallow parts of the river. The weather is changing though, with rain coming in for several days. This is good for the water levels, but the colder and rainy weather may make our sampling efforts more challenging.
After seven days and 19 plots of sampling, we are now taking a well-deserved rest day. I used this rest day to write this blog and digitize some datasheets. Over the next four days, we will continue sampling along the river and then use a helicopter to access the Apoon Pass fire site for more sampling.
This field expedition is part of FireIce (Fire in the land of ice: climatic drivers & feedbacks). FireIce is a Consolidator project funded by the European Research Council. FireIce is affiliated with NASA ABoVE.
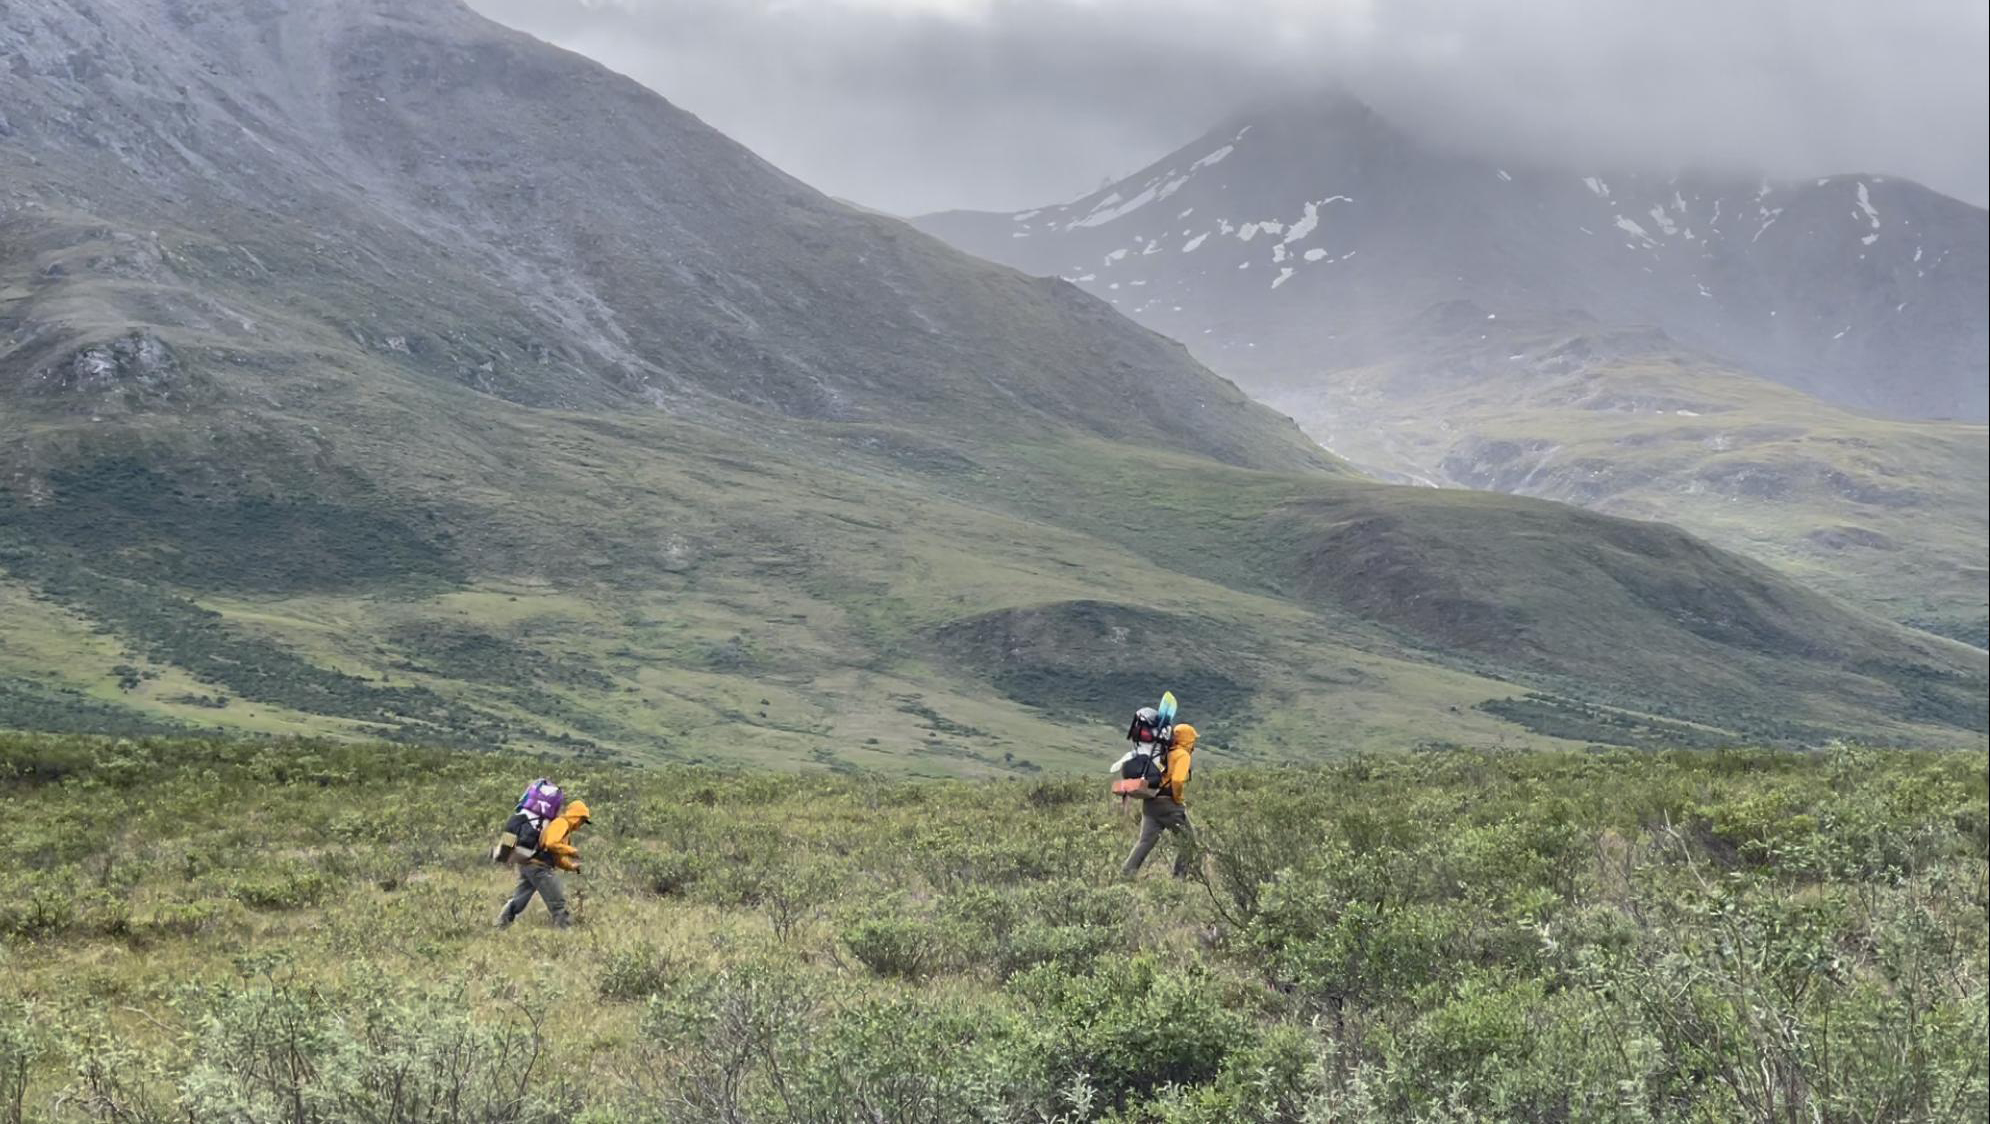
Following caribou and brown bear trails when possible, a small NASA-supported research team trekked 800 miles across Alaska’s Brooks Range last summer. With additional support from NSF, the Alaska Space Grant Program, and the Explorers Club/Discover, the research team is collecting extensive ecological field data that will be linked with satellite observations to better understand long-term changes in vegetation, including impacts of climate warming. The Arctic is warming nearly twice as rapidly as the rest of the planet and the impacts are becoming increasingly evident as glaciers melt, permafrost thaws, and tundra greens.
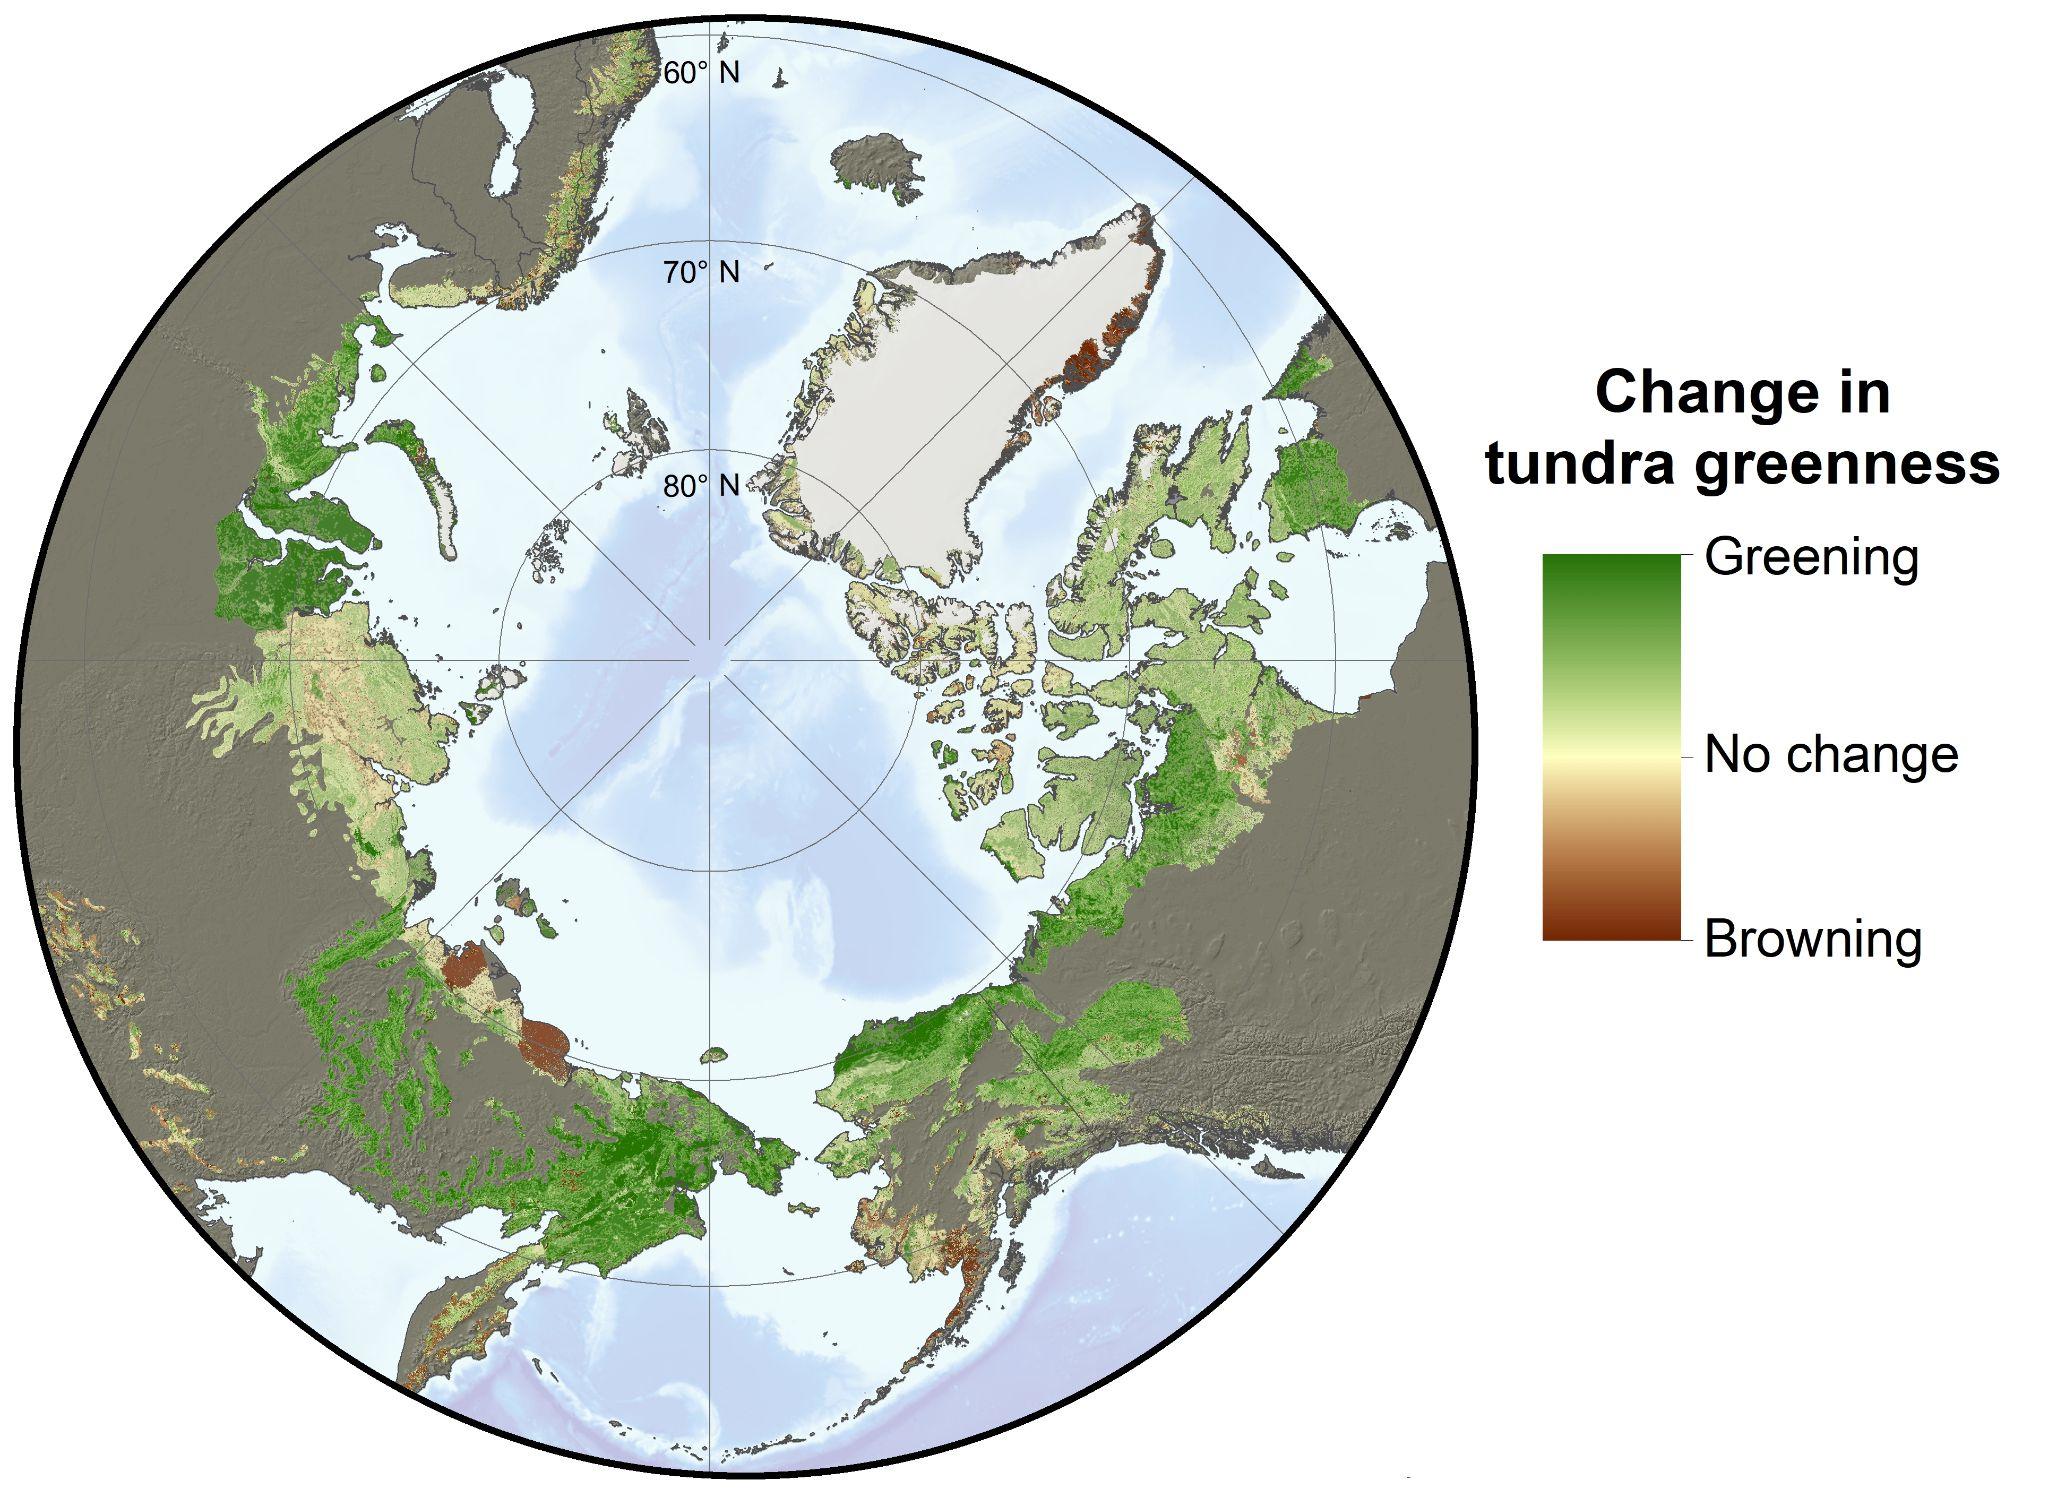
Earth-observing satellites have detected widespread increases in tundra greenness in the Arctic over the last four decades. The phenomena is caused, in part, by increases in vegetation growth as summers have become warmer and longer, and has been termed “Arctic greening.” On the other hand, satellite observations have also detected localized declines in tundra greenness attributed to surface flooding, extreme weather, and other disturbances. This has been termed “Arctic browning.” Satellite observations of greening and browning show that extensive changes are occurring in the Arctic, but much remains unclear about why specific regions have greened or browned in recent decades.
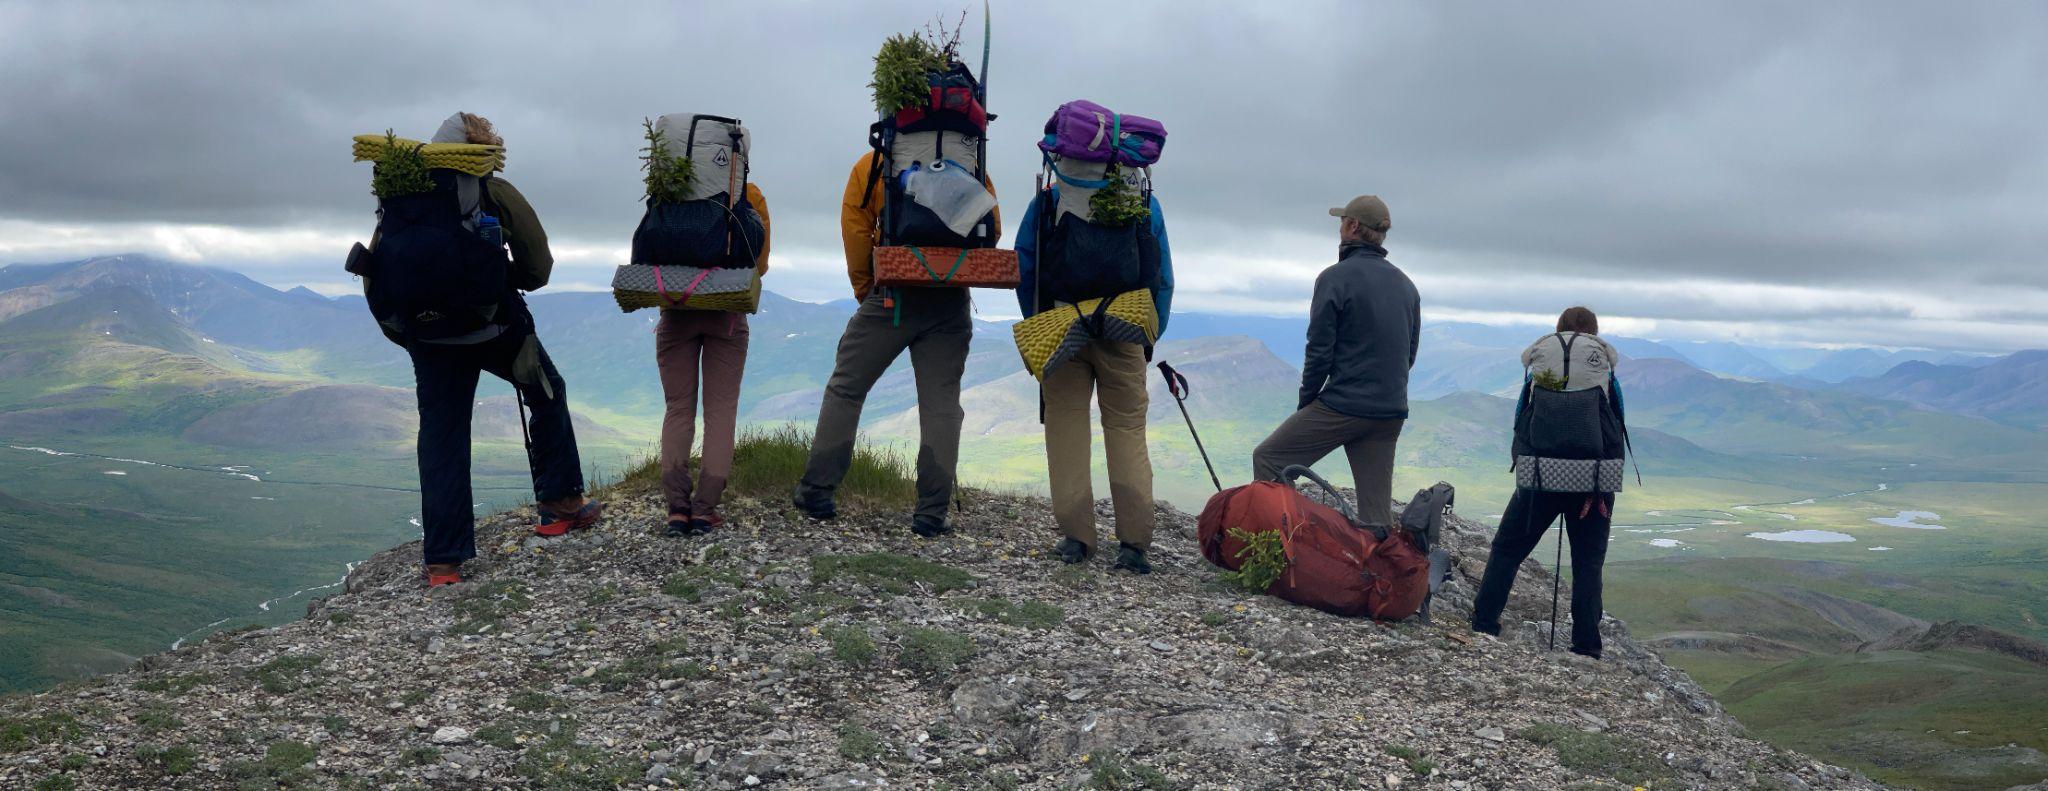
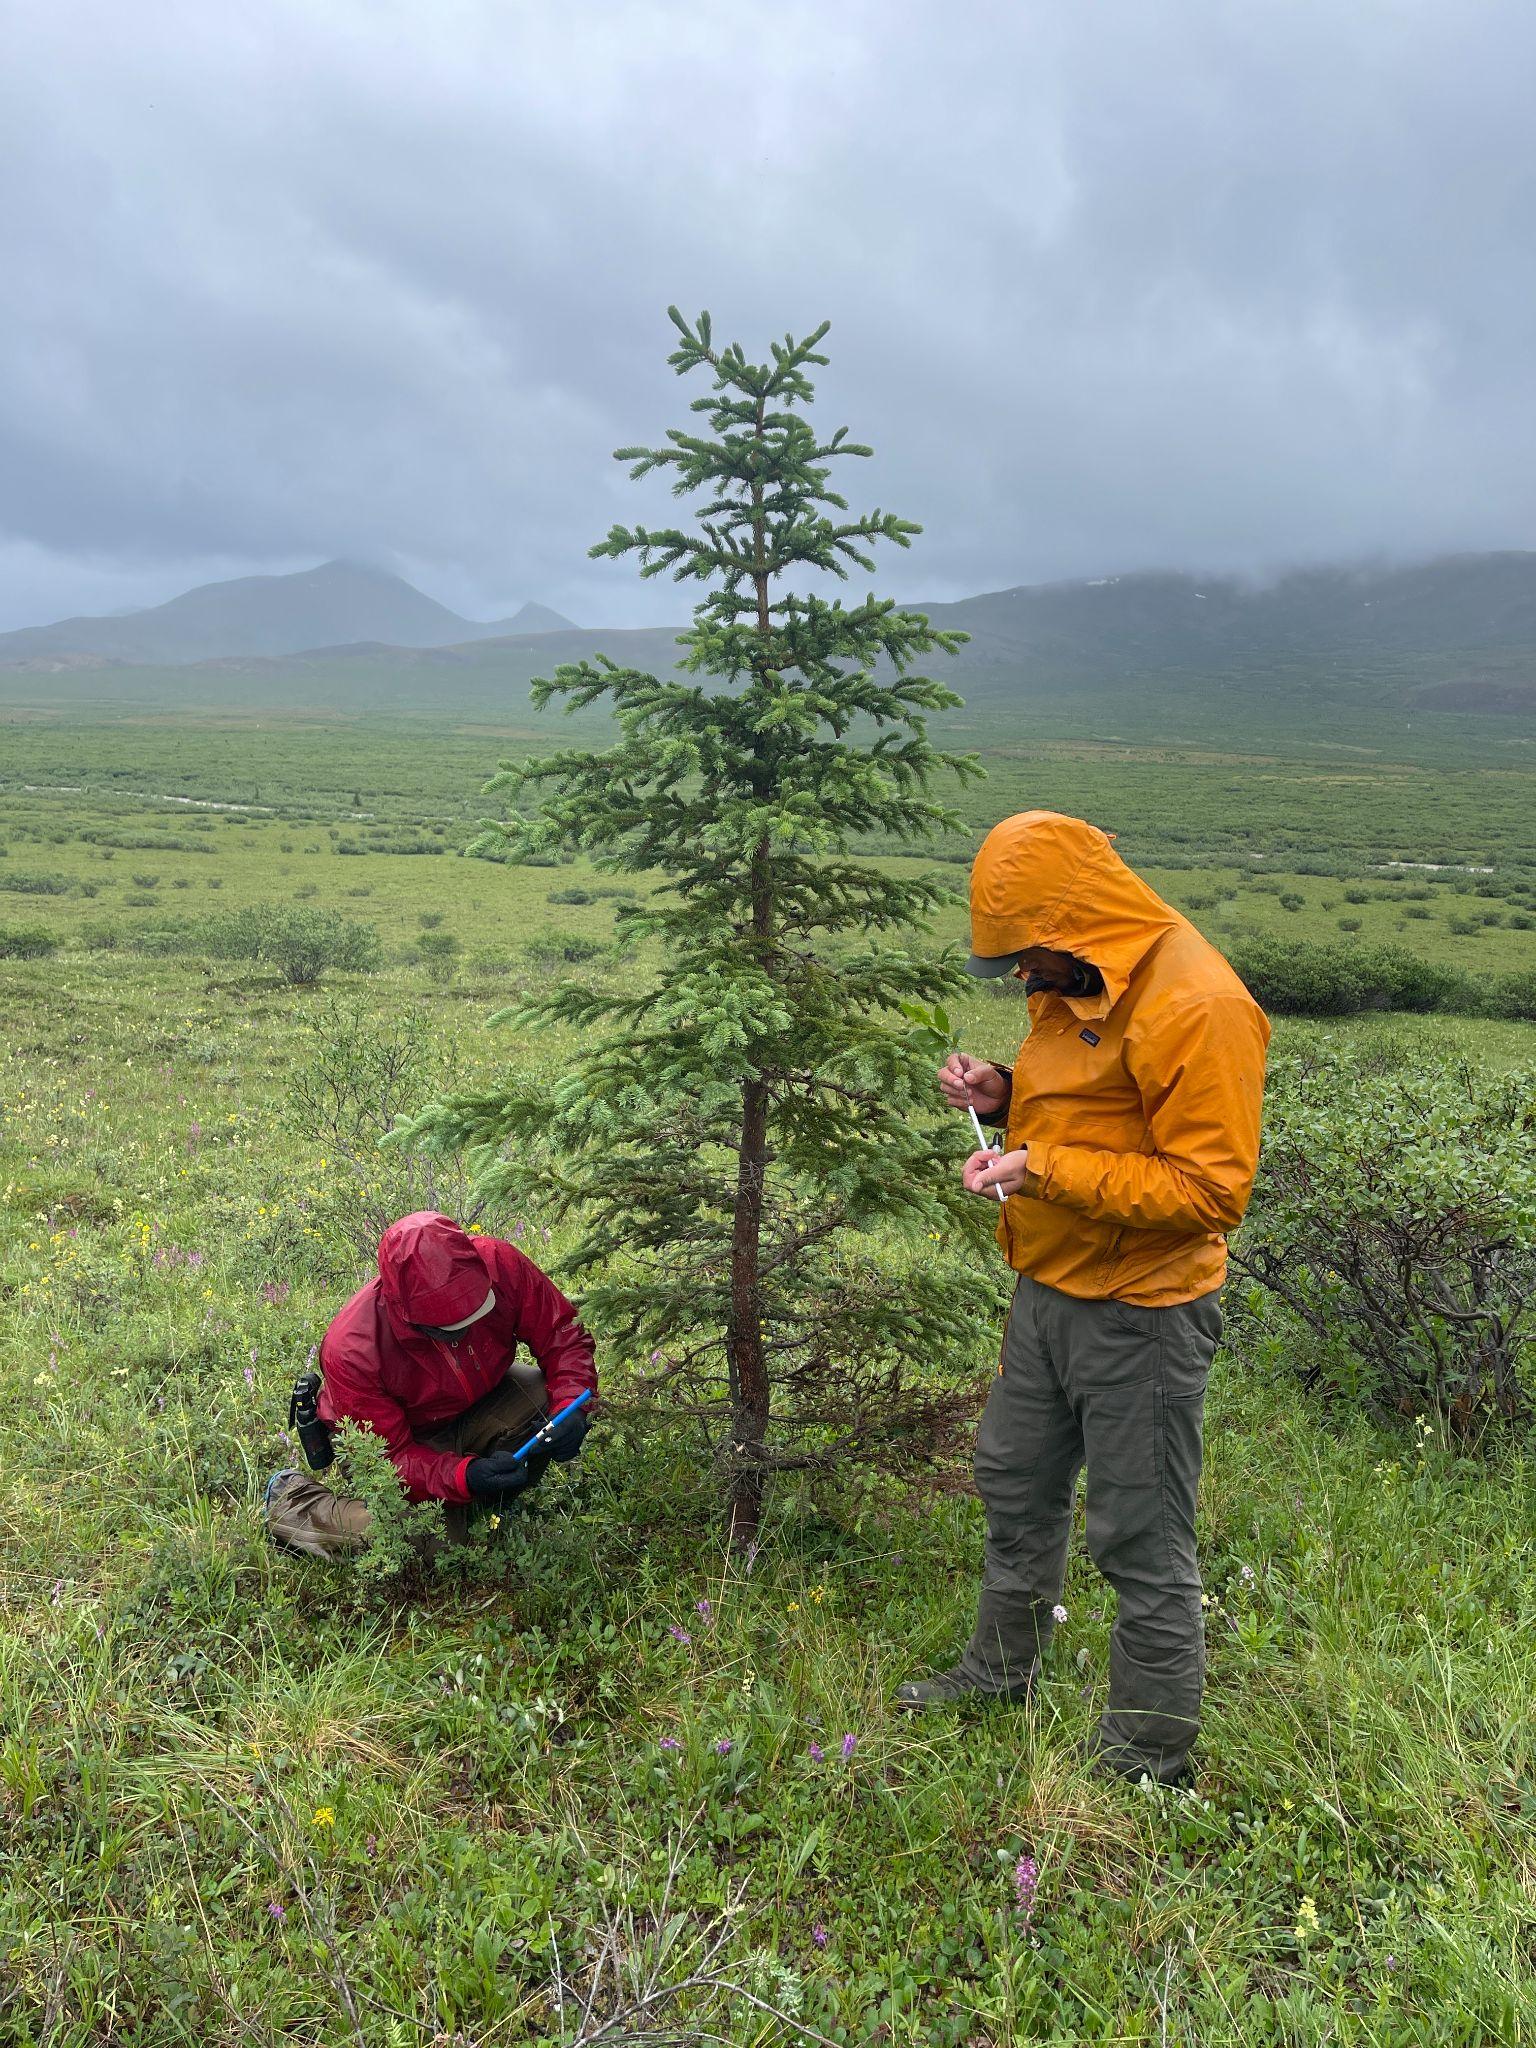
To better understand recent greening and browning in northern Alaska, Professor Roman Dial’s team from Alaska Pacific University (APU) has been collecting extensive ecological observations while trekking throughout Alaska’s Brooks Range. For nearly forty years, Dial has studied and traversed the Alaskan wilderness, including nearly 2,000 miles by foot and packraft throughout the Brooks Range during the last three field seasons. For 11 days last summer, Dial’s team was joined by Dr. Logan Berner and Patrick Burns who are research ecologists from Northern Arizona University (NAU) and members of NASA’s Arctic-Boreal Vulnerability Experiment (ABoVE). While Dial is an expert in field ecology and wilderness travel, Berner and Burns are experts in satellite remote sensing and ecological informatics. By combining their expertise, these researchers hope to shed light on the extent, nature, and causes of vegetation changes during recent decades in the Brooks Range.
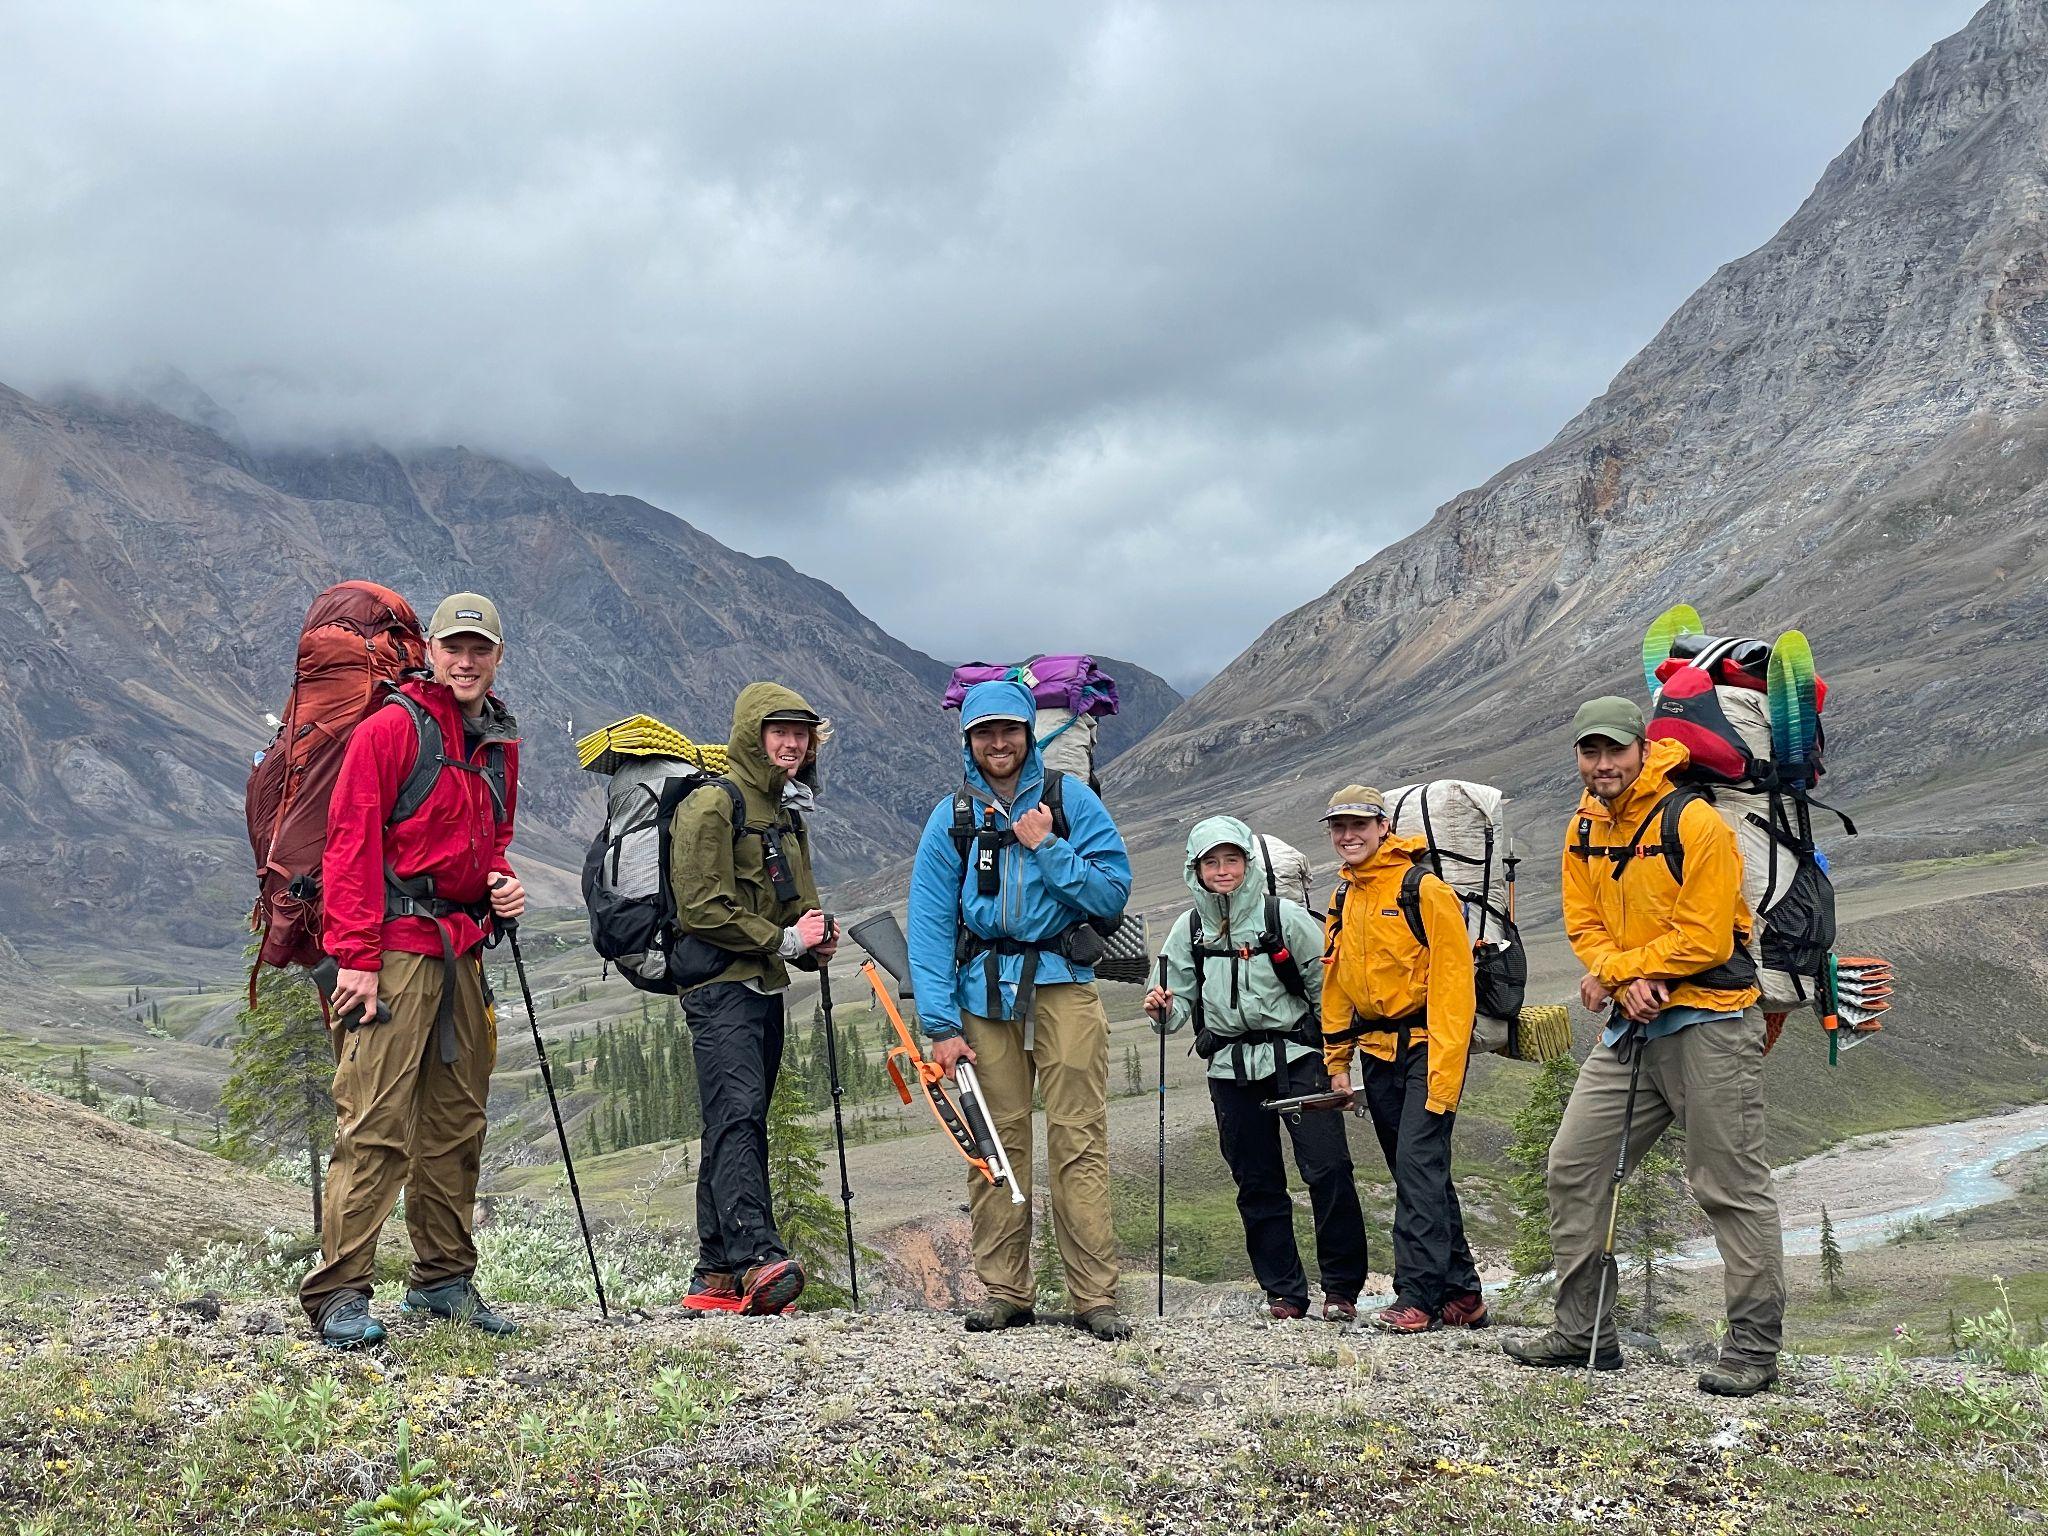
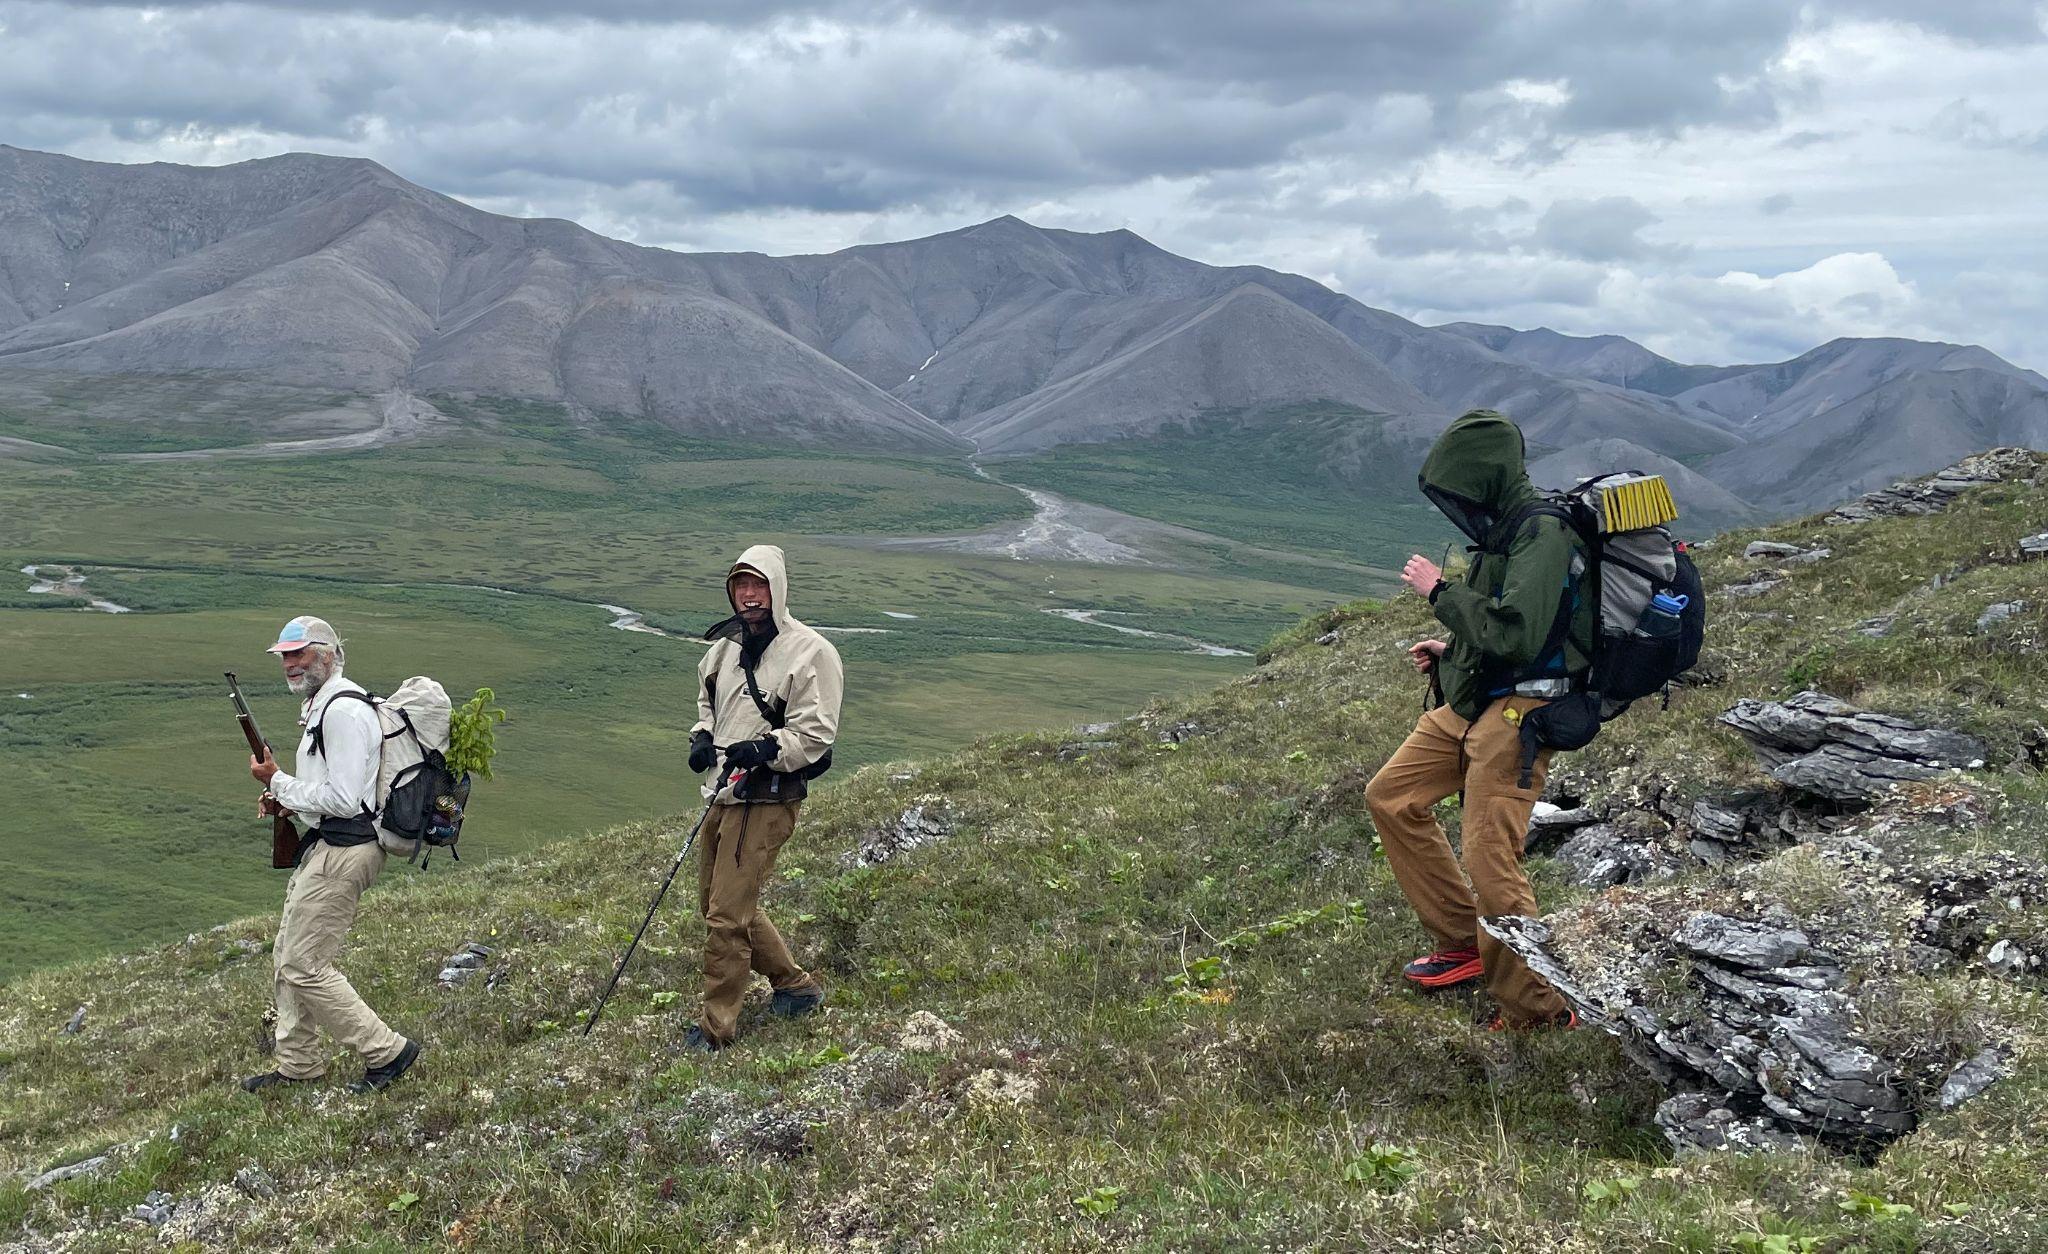
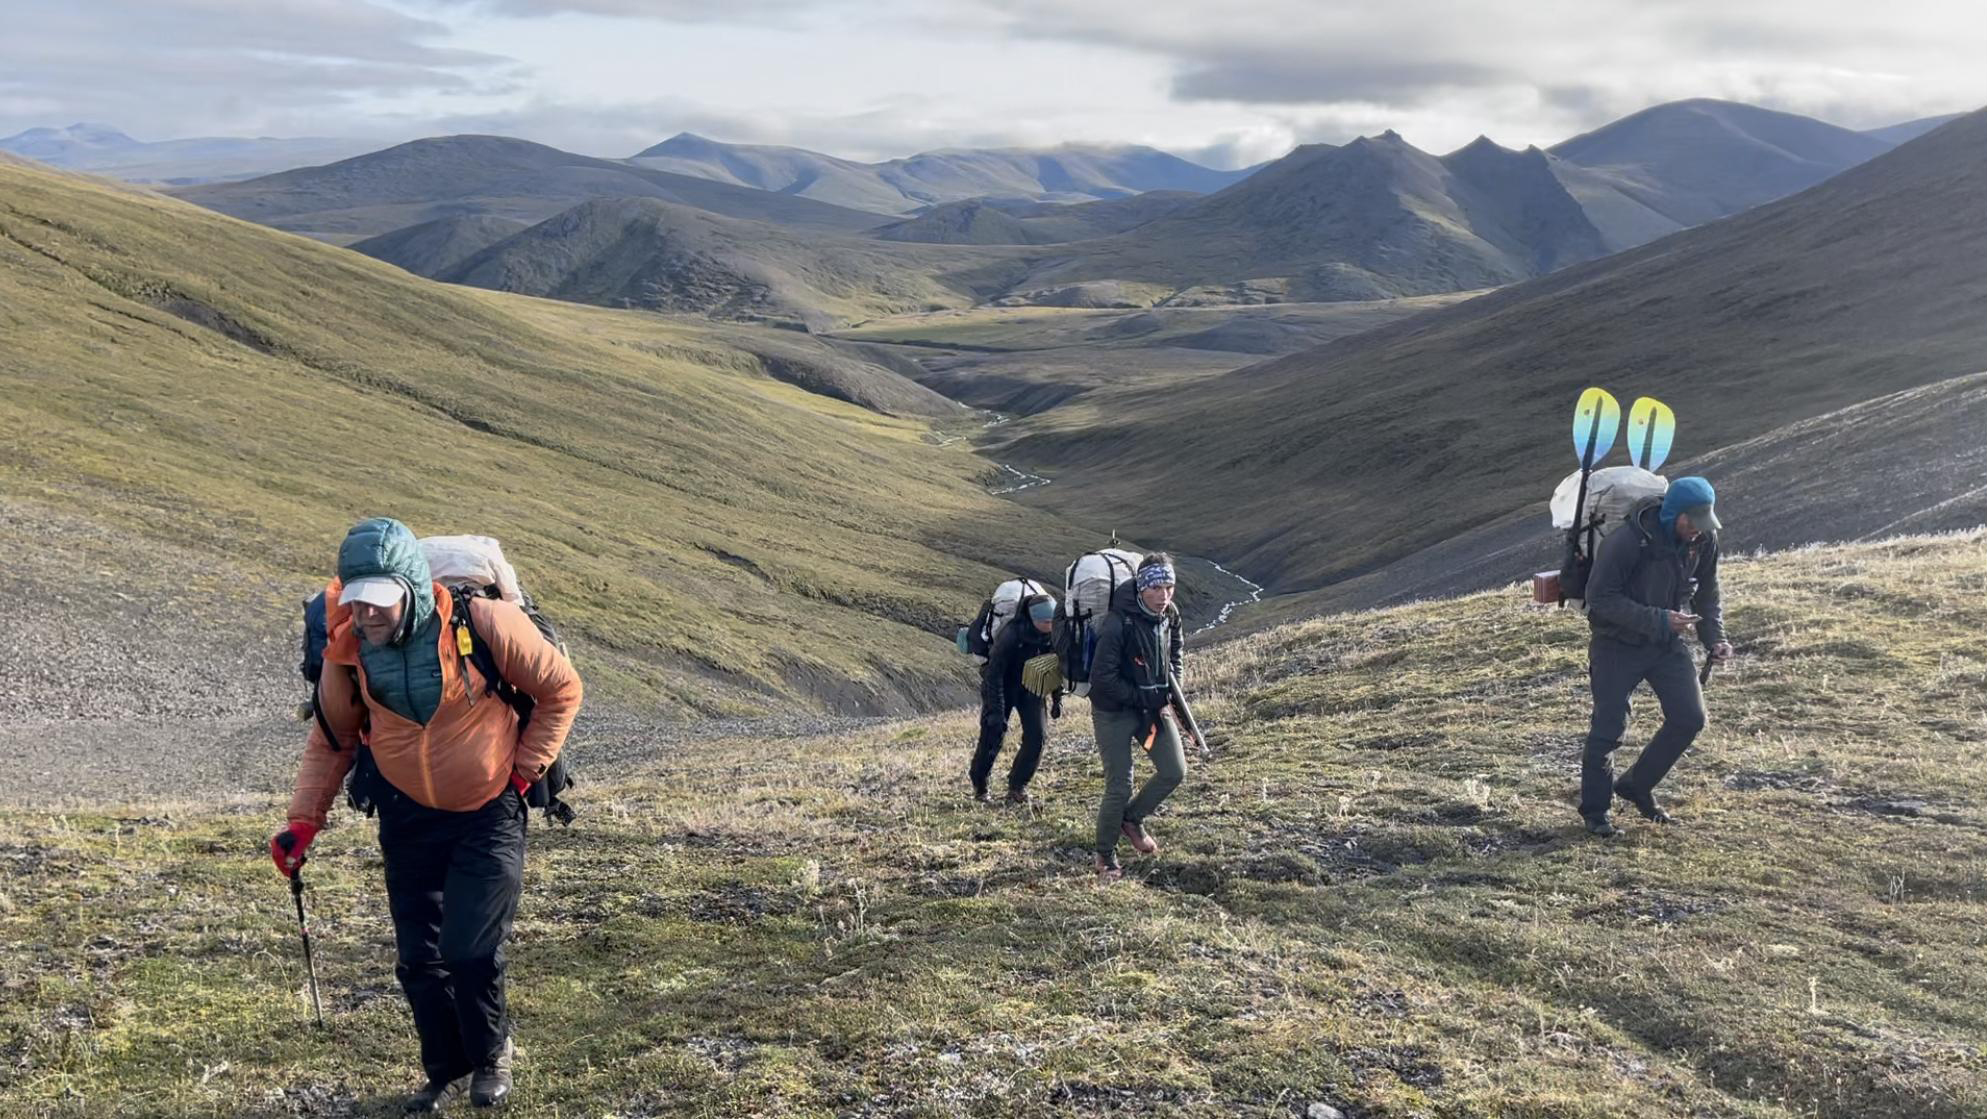
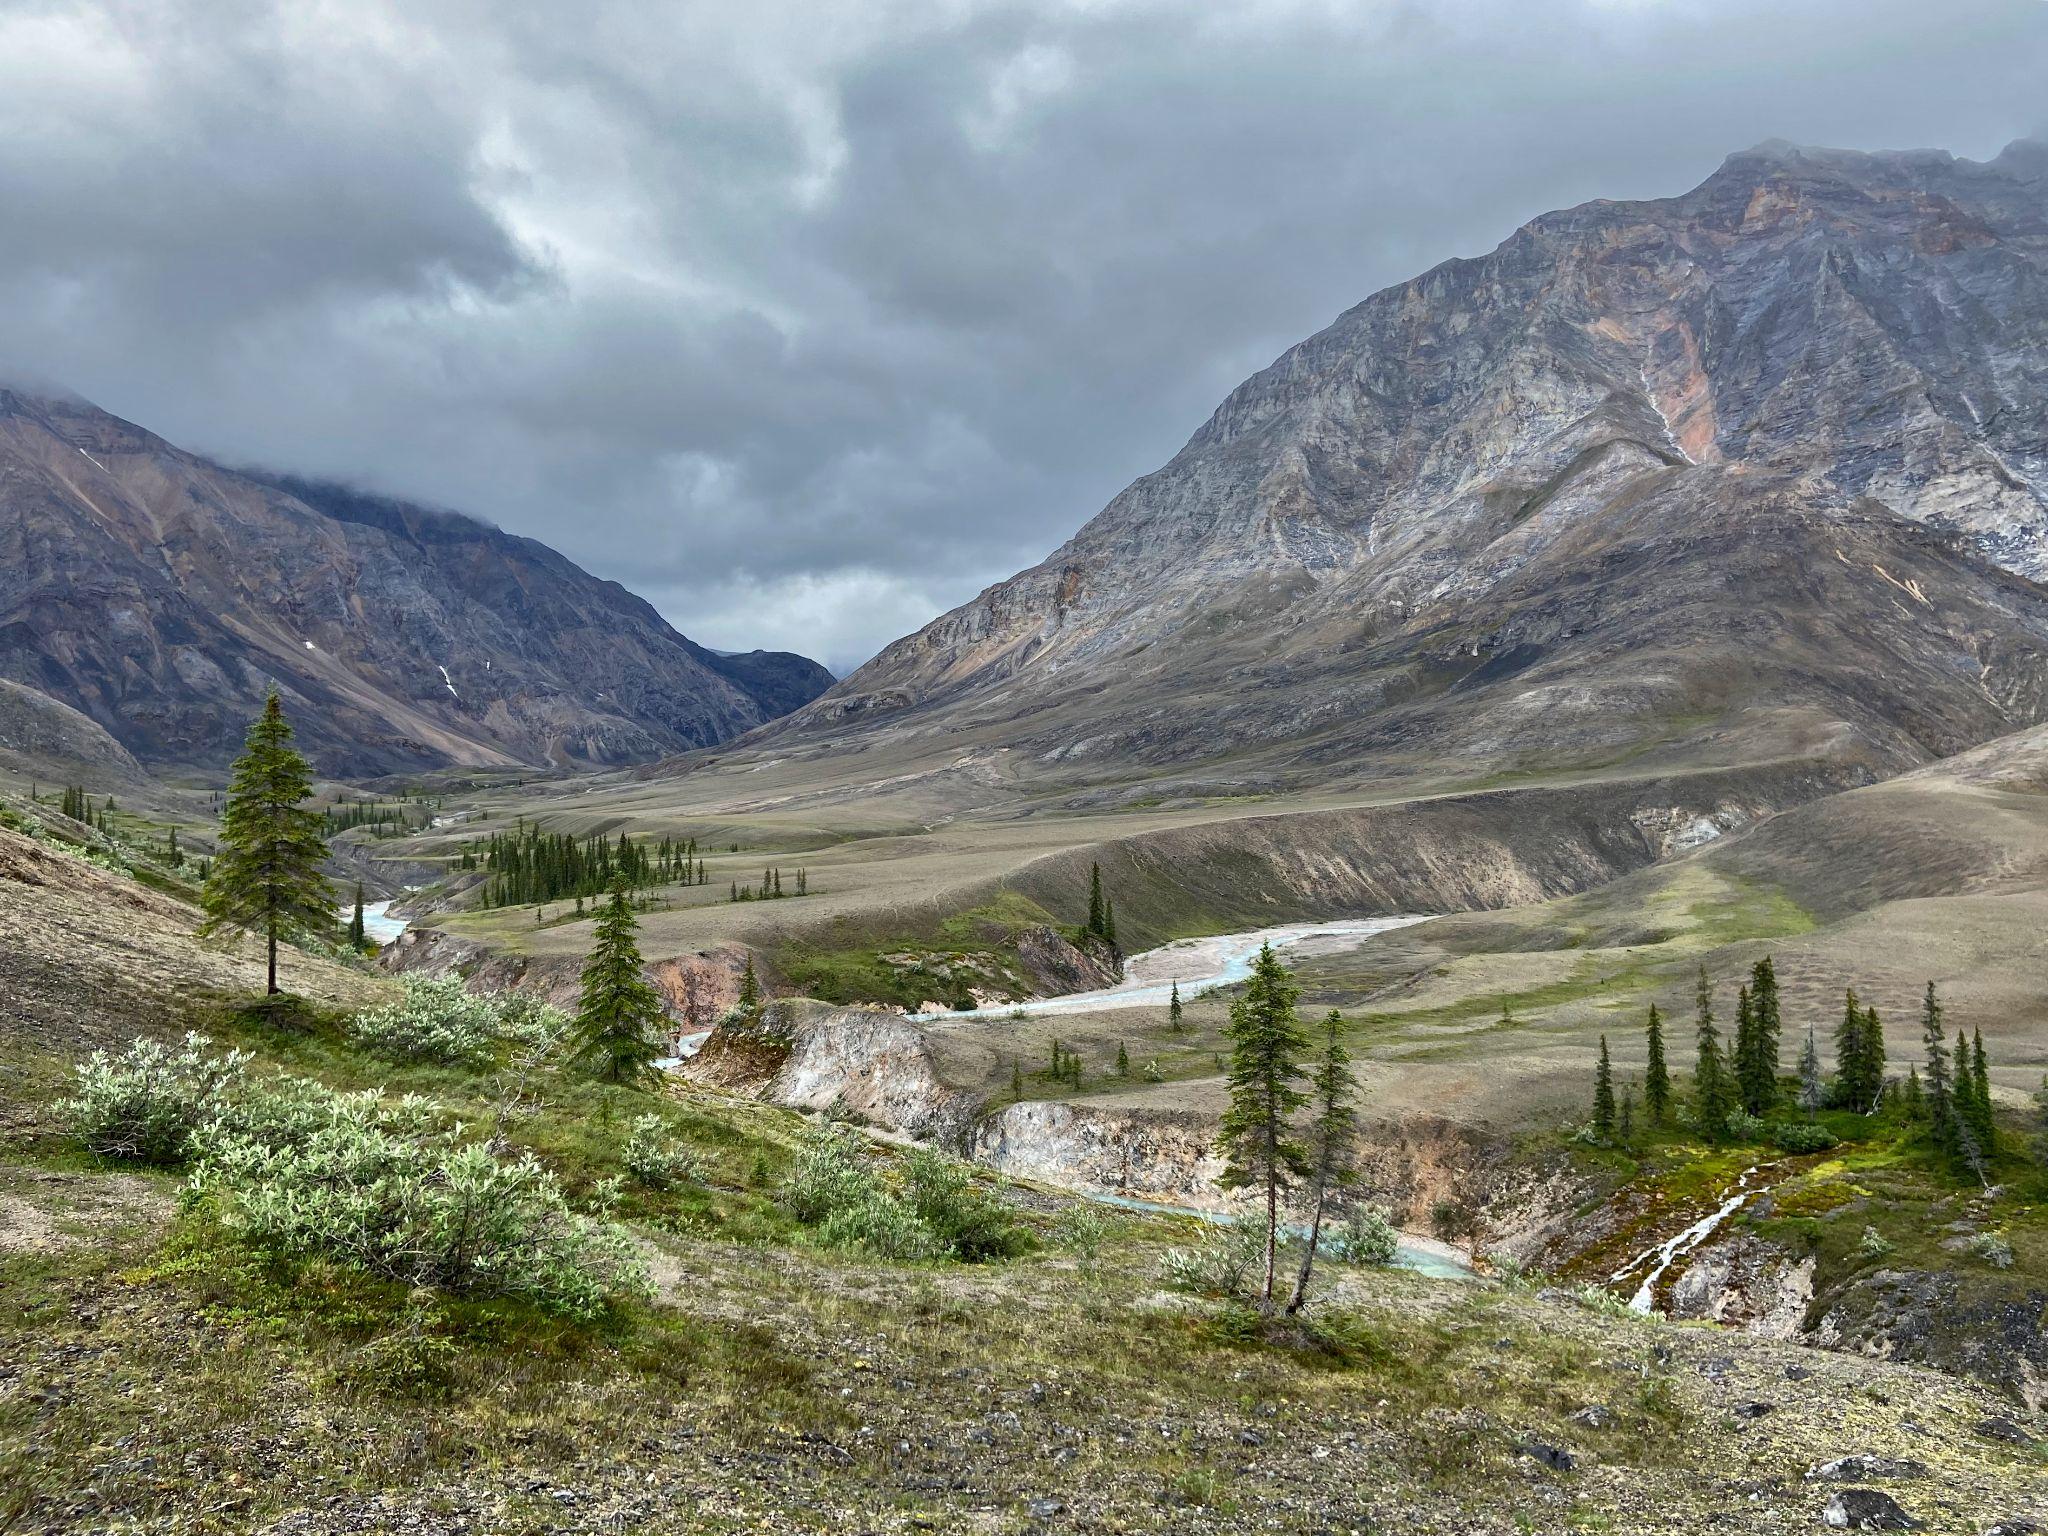
The Brooks Range forms a natural barrier that separates the boreal forest of Alaska’s interior from the arctic tundra of Alaska’s North Slope. This mountain range includes the largest complex of protected wilderness in the United States, including 21,000,000 acres among the Arctic National Wildlife Refuge, Noatak National Preserve, and Gates of the Arctic National Park. Berner and Burns joined Dial’s research team as they trekked from the northern edge of boreal forest into the Noatak Wilderness where trees give way to thickets of shrubs, wetlands, and barren rocky ridges. During the course of 11 rain-soaked days, the team followed caribou and brown bear trails through verdant valley bottoms and over cloud-choked mountain passes as they traversed about 80 miles from the Ambler River to the Cutler River. While trekking, the researchers collected ecological field data to be linked with measurements of vegetation greenness from NASA Earth-observing satellites.
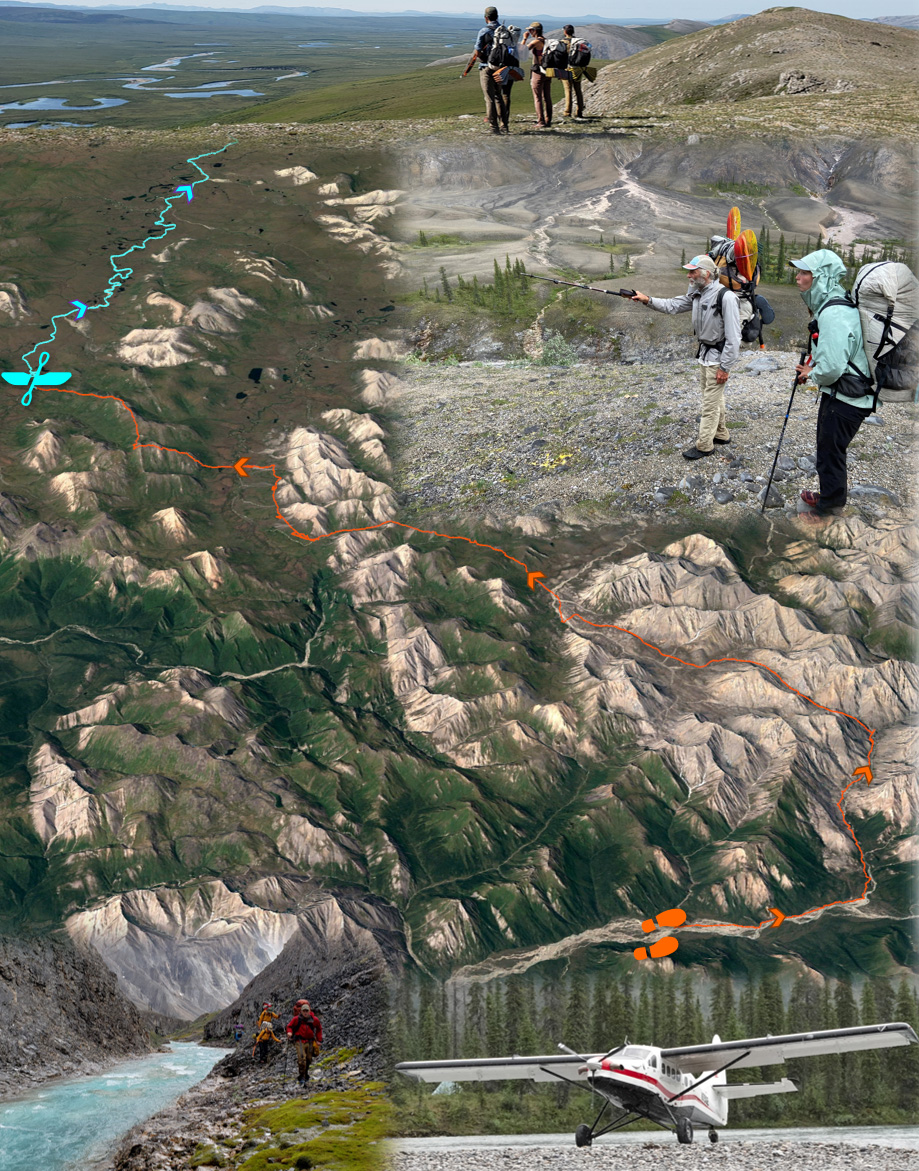
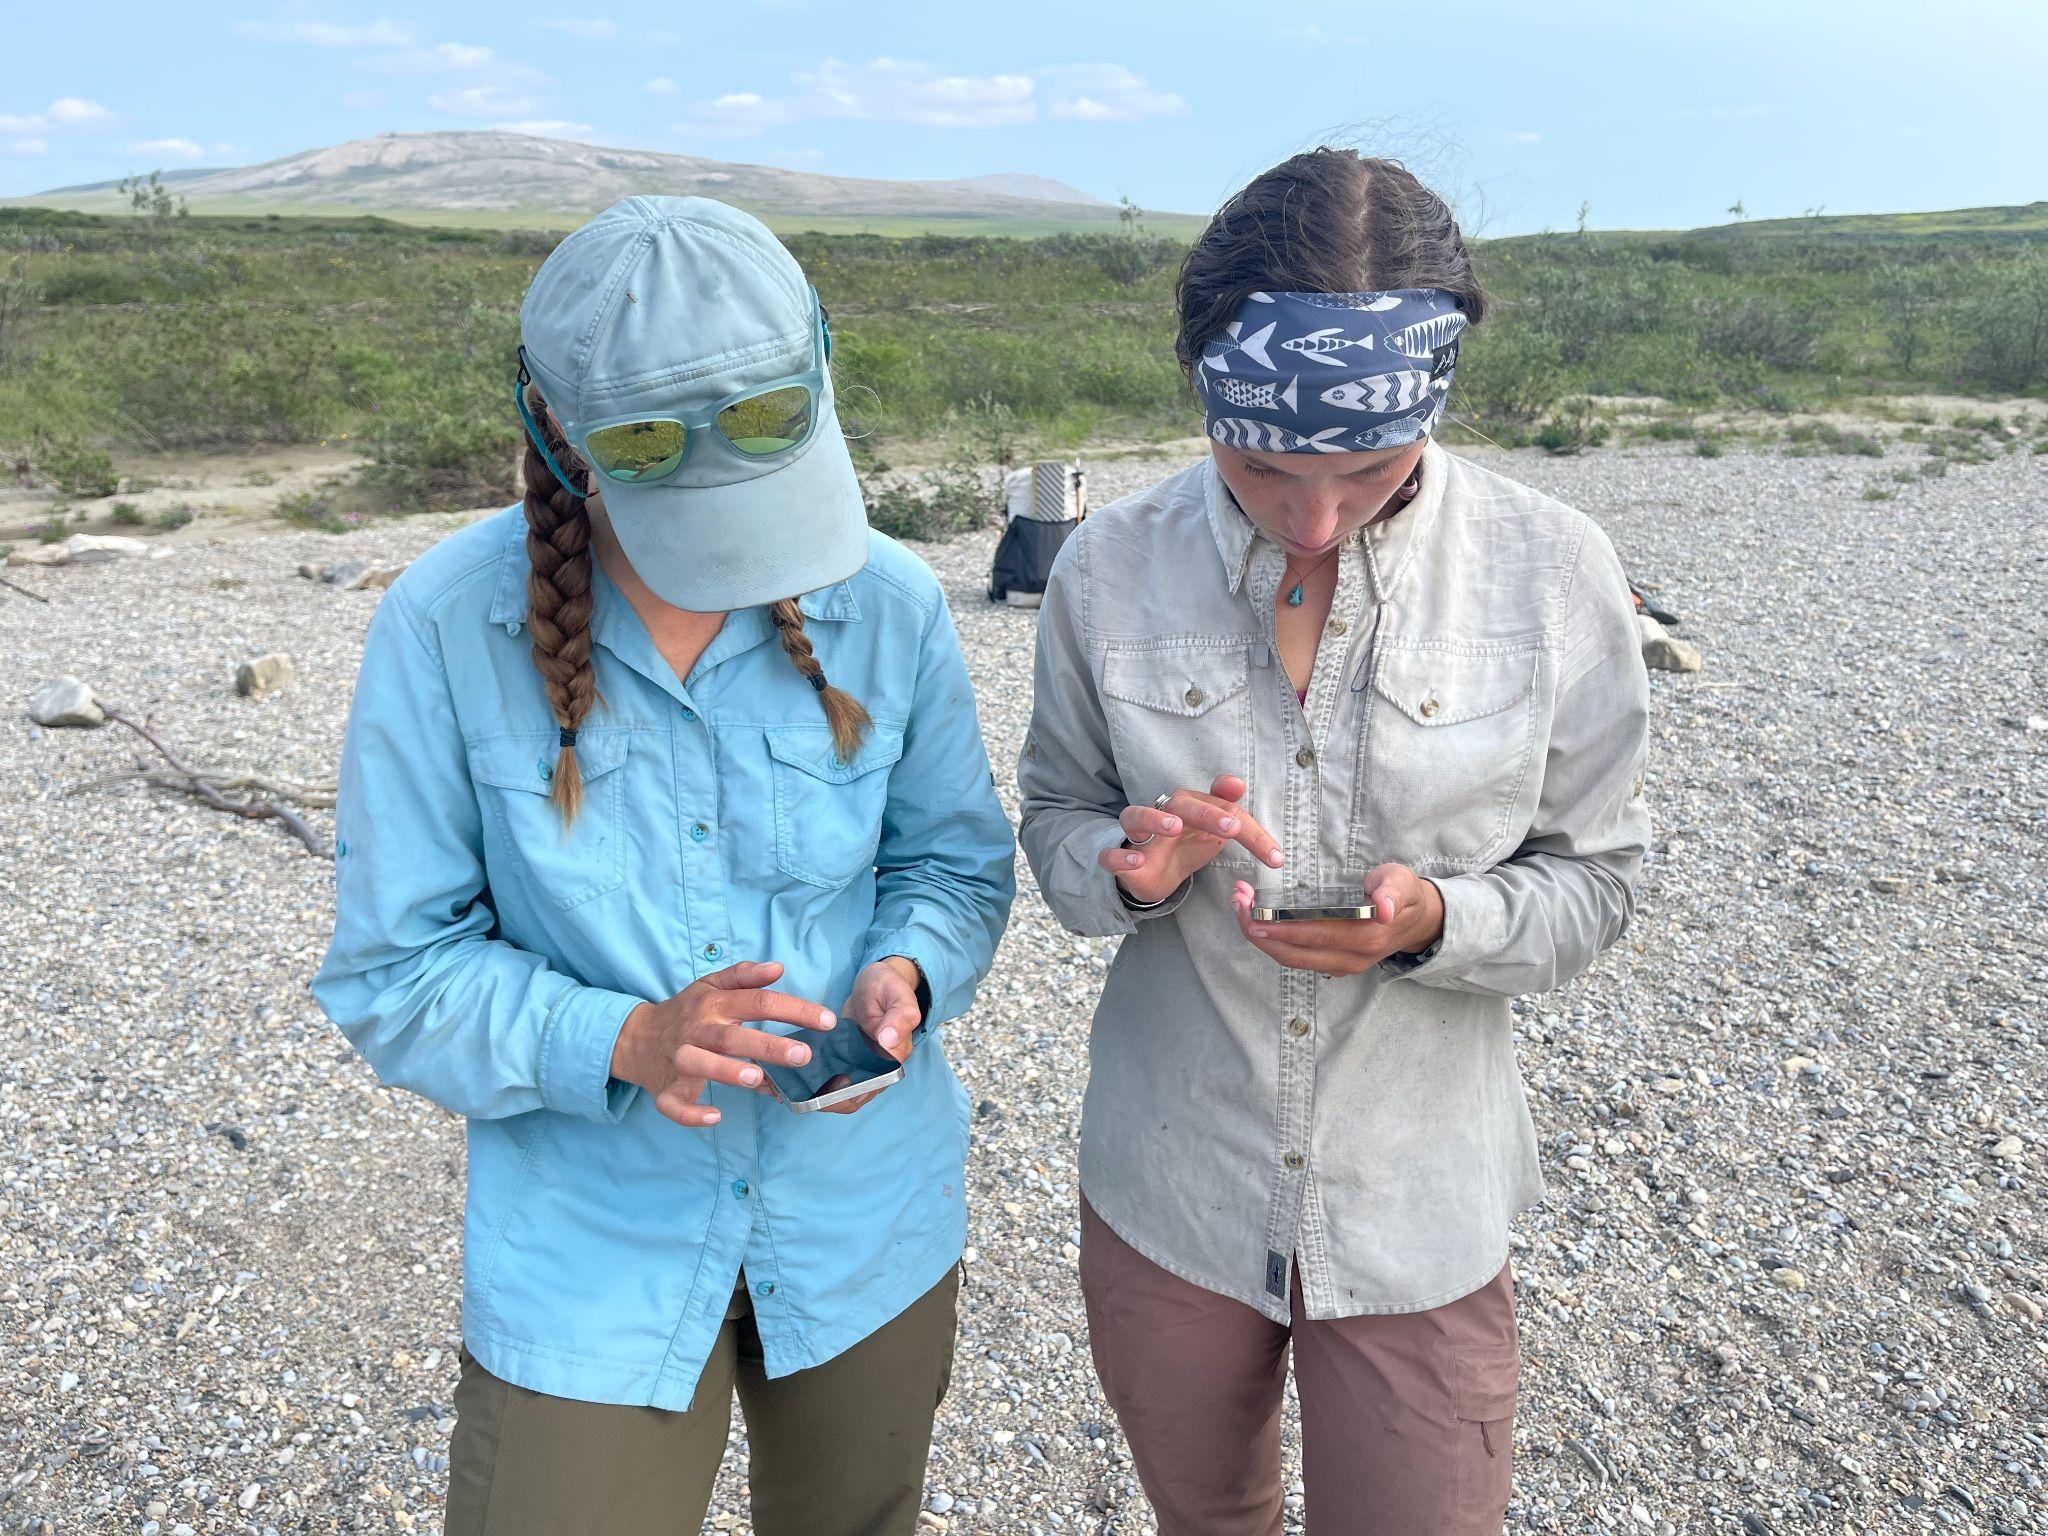
Ecological research often involves establishing field plots and then meticulously characterizing the composition and other attributes of the plant community in each field plot. Plot sampling provides valuable information, but the time consuming nature of the approach limits the spatial extent over which measurements can be made. Dial recognized that to better understand recent greening and browning, there is a need for more spatially extensive information on plant community composition than can be provided by field plots alone. He thus has pioneered an alternative approach that involves continuously documenting plant community composition and other attributes while trekking across the landscape. Termed “pixel-walking”, this approach harnesses the multifunctionality of smartphones to record and geolocate visual observations of vegetation composition and density for the overstory, midstory, and understory. While pixel-walking, researchers record a new observation every time they visually detect a change in vegetation composition or density at about a 30 meter spatial scale, corresponding to one pixel from the Landsat satellites. These spatially extensive field observations are thus collected with the explicit goal of being linked to decades of Landsat satellite observations.
During summer 2021, Dial’s research team pixel-walked over 800 miles from east to west through the Brooks Range, collecting data on vegetation composition for about 100,000 Landsat pixels. Over the coming year, Dial’s team will work with Berner, Burns, and Professor Scott Goetz (ABoVE Science Team Lead) at NAU to link these extensive field data with several decades of Landsat satellite observations provided by NASA. This collaboration will help unravel the mysteries of Arctic greening and browning by shedding light on where, how, and why plant communities changed in recent decades. NASA’s Earth-observing satellites provide long-term observations that are crucial for monitoring and understanding ongoing environmental changes in the rapidly-warming Arctic, especially when complemented by field data collected across large regions.
By Walt Meier
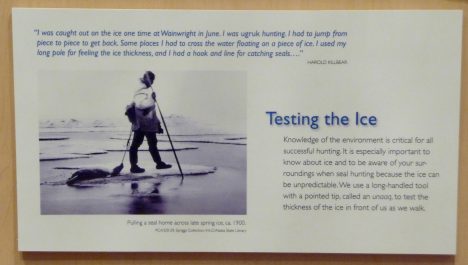
A sign at the the Inupiat Heritage Center in Barrow, AK.
Jun. 1, 2016 — We started our last day of the camp with a morning visit to the Inupiat Heritage Center to learn more about the indigenous local culture. Many of the Inupiat in Barrow still live their traditional subsistence lifestyle – hunting, trapping, and fishing for food. They do however take advantage of modern technology to make their way of life a bit easier and safer. For example, now machines have replaced dogsleds and rifles have replaced harpoons. But for some things, the old ways did not need to be modernized: the sealskin umiaq kayaks are lighter (easier to carry across the ice) and more navigable in the narrow leads of open water common to the area than anything manufactured today. And the fur-lined coats, pants, and boots are lighter, warmer, and repel moisture better than any modern outdoor gear.
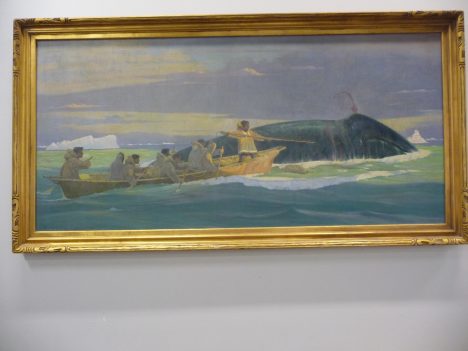
A painting of whale hunting at the Inupiat Heritage Center.
The Inupiat way of life is governed by the seasons. There is a season for whale hunting, for seal hunting, for polar bear hunting. The dark, cold winter season is a time to stay indoors and sew new clothes or repair old clothes. Festivals mark the seasons where the community comes together to celebrate and reinforce the bonds between families.
After visiting the heritage center, we headed back to our base for a final meal. Several times during the week, our field leader, Don Perovich, said that the key for a successful field expedition is “to eat as much as you can as often as you can.” And we were certainly well fed throughout, with plentiful sandwiches, instant soups, chips and crackers, and all-important chocolate for our typical mid-day meals. But our final meal in Barrow was a step above, thanks to Elizabeth Hunke at Los Alamos National Laboratory. She proved herself not only a top-notch sea ice modeler but also a great chef, putting together a delicious meal of spaghetti, garlic bread, and salad.
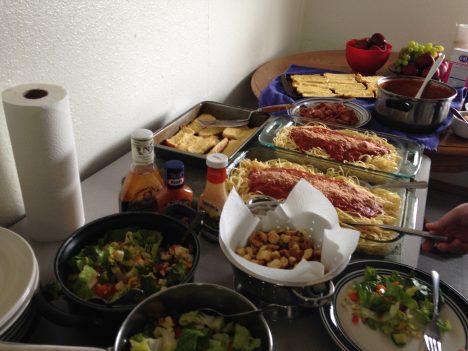
Last meal in Barrow.
Then it was time for our final sessions, presenting the data we collected and discussing our Grand Challenge efforts. Unfortunately, the data collection the previous day did not go as smoothly as we had hoped. We couldn’t collect albedo measurements because the instrument didn’t work yesterday. But this type of things is not at all unusual in field work. As Don said: “In Arctic field research, it’s important to make a plan; it’s also important to not become too enamored of that plan” because something inevitably will go awry and you have be prepared to adapt.
So we couldn’t directly compare one of the key surface features between the two sites. However, we had other data we could look at. The new site to the north was 10-20 centimeters (4-8 inches) thicker than the original southern site. So there was less melt there and the ice was likely to last longer there. And while we lacked some data, we had models we could use. Many people think of modeling simply as predicting the future – and indeed models are used for that purpose (e.g., weather forecasts), but models, particularly climate ones, are also used to investigate processes and learn how climate responds to different parameters. Though we didn’t have albedo data, we could adjust albedo in the model and see how that affected how the modeled sea ice evolves in the future.
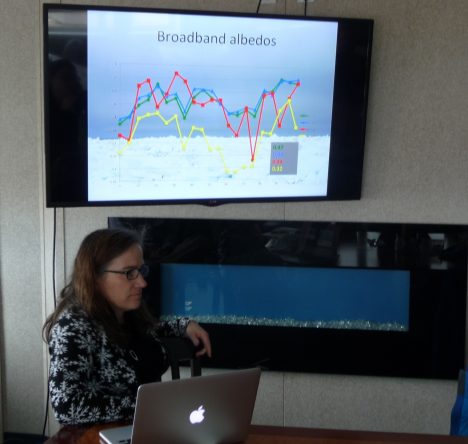
Grand Challenge results.
Several folks worked late into the previous night to process data and run the sea ice model. We obtained climatological weather data, input the data into the model and run it for the first two weeks in June. The results showed that the melt was strongly affected by the albedo of the surface and the amount of incoming sunlight, and that there will likely be substantial differences between the two sites. In a sense this isn’t terribly surprising, but to see such variation over such a small distance (the two sites were separated by only a couple miles) and within such short time periods (two weeks) is sobering. Large-scale complex models and satellite data cannot (yet) resolve such variability. There is still much research to do, and those of us at the camp have come away a greater appreciation for the challenge.
We finished up by discussing future plans. The goal of this camp wasn’t simply to get everyone together for one week, but to start new collaborations between modelers, satellite folks, and field researchers. We discussed several ideas to build upon the start we’ve made, keep momentum going, and convey what we learned to the broader sea ice research community. With that, it was time to head to the airport and begin our long journeys home.
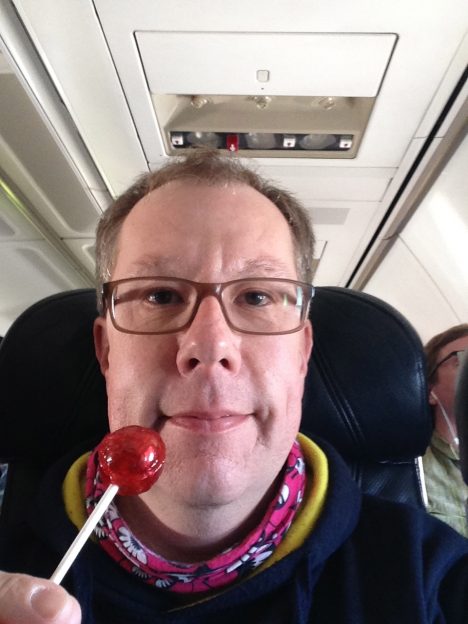
Another tradition Don has is to bring a lollipop to each field expedition. When the expedition is done, he pulls it out as a reward for a job well done. At the beginning of our camp, he gave each of us a lollipop. It was up to us to decide when we were done. Some pulled theirs out after we wrapped up the meeting; some enjoyed theirs at the airport. I waited until the plane left the ground.
And so my adventure on the ice has come to an end. I can’t say I’m an expert in the field or ever will be. But it has been a rewarding week for me. I’ve gained a lot of knowledge about what it takes to do field work. I’ve gained an even greater appreciation of the value of field observations, as well as modeling studies. Hopefully I was able to give participants a greater understanding of satellite data. And finally, now when someone asks me if I’ve been on the sea ice, I can say “Indeed I have!” I still have the taste of the lollipop in my mouth to prove it.
Until the next time, Walt.
