
By Eric Lindstrom
On September 6, a bunch of NASA-funded scientists, and me among them, will depart on an expedition across the North Atlantic Ocean to study salt concentration levels of seawater. But why do we want to spend six weeks at sea measuring ocean saltiness? Hopefully, over the coming months you will come to understand the motivation and get caught up in the action through this blog.
My name’s Eric Lindstrom and I am a program scientist for NASA’s Physical Oceanography program. My normal work involves developing and managing NASA’s Physical Oceanography research program. I gave up my career as a seagoing oceanographer to become a manager in our offices in Washington, D.C. However, marrying satellite observations with sea-going oceanography has been a long-term goal of NASA and that’s why I am about to go back to sea, to participate in a research project that merges both fields.
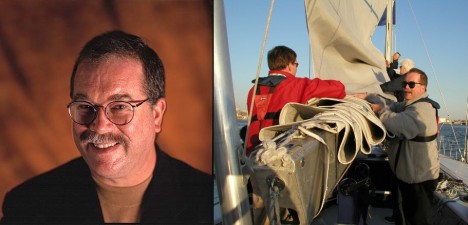
Eric Lindstrom, NASA’s Physical Oceanography program scientist and SPURS blogger.
In September I’ll embark on the Research Vessel Knorr, leaving from Woods Hole Oceanographic Institution in Massachusetts toward Punta Delgada, Azores (Portugal), where we plan to arrive on October 9. This cruise is part of a multi-year research project called Salinity Processes in the Upper Ocean Regional Study (SPURS for short) and, in the U.S., it’s a collaboration of NASA’s Earth Science Division and partners funded by the National Science Foundation Division of Ocean Sciences and the National Oceanic and Atmospheric Administration.
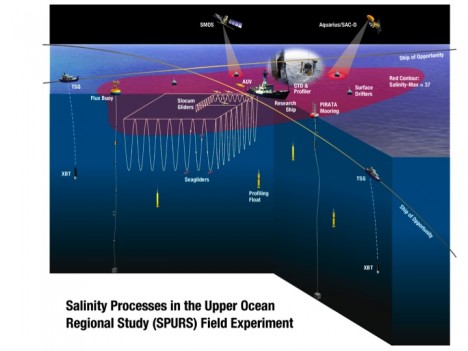
An illustration depicting the instruments SPURS will deploy in the saltiest spot of the Atlantic Ocean.
I plan, over the coming weeks, to introduce the science, the scientists and technicians headed to sea, their individual contributions to the field campaign, and the amazing technology that makes it all possible. But first you need to know some background and what to expect in future posts.
Oceanographers are keenly interested in the smallest variations of the salinity of seawater. How salty the water is from one place to another is one of several key factors in determining the density of seawater – and it’s density variations and wind what drives ocean circulation. Density is determined by the water’s temperature, salinity, and depth in the ocean. We’ll discuss the processes that change temperature and salinity in later posts (as they are at the core of the SPURS field work). In general, the effects of the sun and the atmosphere on the surface of the ocean lead to variations in the temperature and salinity that drive the ocean circulation, which in turn provides energy back to the atmosphere in the form of water vapor, impacting weather (i.e., changes in rainfall frequency and distribution) and climate. I intend to delve into many of the details of this interaction with my posts from R/V Knorr.
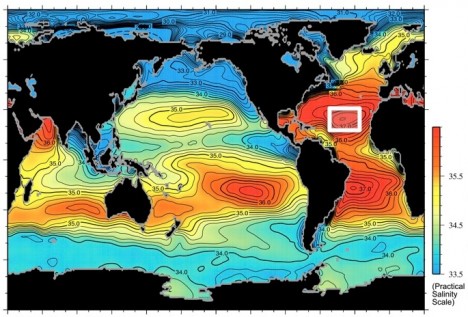
A global map of the salinity, or saltiness, of Earth’s ocean surface, showing the spot in the North Atlantic Ocean where the SPURS research cruise is headed to.
In June 2011, NASA launched a new Earth-observing instrument to measure the surface salinity of the ocean from space. The instrument, called Aquarius, is flying on the Argentine satellite SAC-D and delivers a global map of ocean surface salinity on a weekly basis. This data give unprecedented insight into the variations of the surface salinity of the ocean. While, sea surface temperature has been regularly measured from space for over 30 years, salinity has been a much more difficult measurement to make from space. The question of how do we measure salinity from space is a great subject for later in this blog – I plan on writing about it when we have a quiet day at sea!
A primary objective of SPURS is careful examination of the processes that change salinity in the upper ocean – so we can better interpret the variations in salinity seen globally from space. This year’s focus is on a high-salinity region – as is characteristic of the mid-latitude open oceans around the globe. These are relative “ocean deserts,” where there is much more evaporation than precipitation leading to saltier surface waters. In the future (circa ~2015), a second SPURS campaign hopes to examine processes in one of the “wet” sectors of the ocean, where rain far exceeds evaporation, freshening surface waters. Other processes affect salinity including advection (water circulation) and vertical mixing. I will discuss these in some detail during the cruise, because they are the subject of specialized measurements and have a big impact on our interpretation of salinity variations.
The study of salinity variations in the ocean from all the accumulated ship-board measurements of surface salinity over the last 50 years has revealed interesting trends. It turns out that the high salinity regions of the subtropics have been tending saltier and the low salinity regions of the rain belts have been tending fresher. This can be interpreted a “fingerprint” of an accelerating water cycle – something we expect in a warmer world where the atmosphere holds more water vapor. Models show that this state, roughly speaking, leads to drier dry places and wetter wet places – just what the salinity of the ocean seems to suggest. Unless there is an alternative explanation: that’s where oceanography comes in – the conclusion about the water cycle is only true if purely oceanographic explanations for the trends in surface salinity are ruled out. In other words, is there some other combination of oceanographic processes that could explain why salty places appear to be getting saltier and fresher places fresher? SPURS is ultimately about answering such questions, so we can use global salinity data and ongoing monitoring of salinity as a powerful tool in diagnosing global environmental changes.
And that’s all for today. In my next post, I’ll explain more about the scientists involved in SPURS and more about the posts you will receive from sea during September and October.
Tags: Aquarius, Atlantic Ocean, salinity, SPURS, SPURS1, water cycle
Wow !! that is an interesting project – interesting enough for some one practicing applied Oceanography for almost three( 3) decades to return to Physical Oceanography.
Is there any plan to extend this study to other Oceans ??
If so What is the scope ??
Please inform where progress on this will be reported .
Thanks .
Thanks for your interest! We are now at sea headed toward our primary study location (25N, 38W). Dodging Hurricane Leslie to get there!
SPURS results will be more widely applicable to the high salinity regions which exist in other subtropical oceans (S.Atlantic, N&S Pacific, and Indian Oceans). In the future we would also like to examine in detail a low-salinity, high precipitation region (the other extreme) to bracket the range of conditions occurring over the ocean. Better accounting of salinity processes in global models will improve understanding the water cycle on the planet (for which the ocean is the central player).
Interestin to determine how far below salinity stage is fresh water found to be transfered to the surface to be used on land.
water vapor
ocean surface salinity
leads to drier dry places and wetter wet places
“ocean deserts,”
they are the subject of specialized measurements and have a big impact on our interpretation of salinity variations.
if you mix all of this
what do you get ???
something is boiling that water in that place where salinity and vapor is taking effect
but since its making a global impact dont you think its coming from under water
i think i believe it might be a volcano (that still hasnt been discovered
i mean thats what it looks like to me
just an opinion
Edwin,
Thanks for your interest in SPURS. The cause of the high salinity area is primarily evaporation (dry air coming off the Sahara picks up moisture in this area of the Atlantic). There is no need to invoke undersea volcanos in this instance and no evidence that they are a factor. We are working over the mid-atlantic ridge and it has volcanism is some localized vents. Signatures of such features have been seen and are largely confined to the deep ocean. If we do discover a volcano out there, I’ll be email you right away!
Regards
Eric (on R/V Knorr @ http://www.knorr.whoi.edu/n_index.shtml )
im starting to believe that
that might been the caused of the tsunami in japan
The press conference today at Woods Hole Oceanographic Institution and subsequent tour of the Knorr made the purpose of the upcoming expedition clear and understandable. The students at Will Rogers Middle School in Fair Oaks, California will be following your blog with anticipation and excitement. Your blog will bring the ocean right into our classroom.
Dear Naomi,
it was great to meet you in Woods Hole and thanks for seeing us off at the wharf on Thursday morning. I am looking forward to interaction with your class. Its probably easiest to respond to questions via this blog. Also, if you have ideas for content (writing and photos) that would interest you, I can try to work your ideas into daily postings.
Kindest regards,
Eric
This is a great opportunity to teach numerous facets of Earth-Space Science in my class. Are the salinity profiles to depth at the mooring site available? I am also having difficulty downloading the student and teacher resources, but hoping this will be soon resolved.
thank you
We are now enroute to the SPURS study area and the mooring will be deployed in about one week. From that point we begin to obtain many salinity profiles with a host of different instruments we plan to deploy over the ensuing weeks. Hope you have solved any issues with downloading educational materials.
Regards
Eric Lindstrom