By Eric Lindstrom
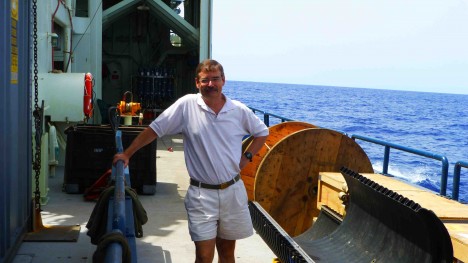
SPURS Chief Scientist Ray Schmitt.
SPURS Chief Scientist Ray Schmitt has been thinking about the salt in the ocean for a long time. He did his PhD thesis on an unusual form of mixing called “salt fingers,” which we will discuss in a later post. This small scale mixing process led him to consider the origins of the ocean salinity contrasts that we see around the world.
It’s fairly obvious that salty waters arise from high evaporation regions and fresher waters originate from high rainfall areas or river flows into the ocean. But it turns out that accurate estimates of evaporation and rainfall over the ocean were hard to come by. For a long time, it was a relatively neglected research topic. Many meteorologists were only concerned about how much it rained on land and few seemed to care if it rained on the ocean. Pulling together the best data he could, Ray found that, in fact, the ocean completely dominated the global water cycle. The terrestrial part, so important to us on a daily basis, is a much smaller piece. The oceans hold 97 percent of the Earths free water, the atmosphere only 0.001 percent. The oceans provide 86 percent of global evaporation and receive 78 percent of all rainfall. The total of all river flows into the ocean sums to less than 10 percent of global ocean evaporation. Clearly, if one wants to find out what the water cycle is doing, one should be looking at the oceans. The traditional fixation on the terrestrial water cycle is understandable, but risks missing the big picture. It seems that the tail is wagging the dog in terms of research on the global water cycle!
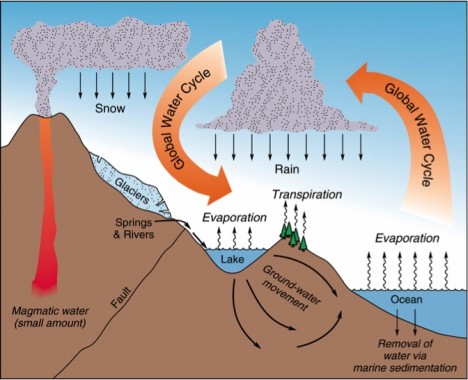
A traditional view of the water cycle.
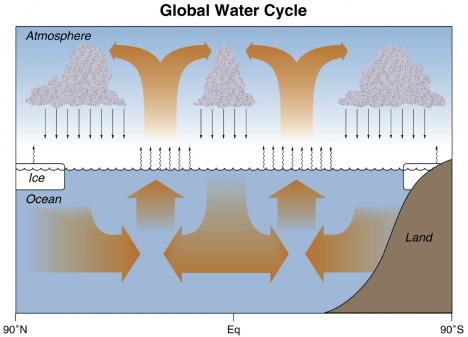
The oceanographers’ view of the water cycle.
Of course, one of the most important questions for climate change is what the water cycle will do with continued warming. Basic physics tells us that a warmer atmosphere will hold more water vapor, so an intensified water cycle is expected. Oceanographers should be able to assess any trend in the water cycle if we do a good job in monitoring ocean salinity. On land, man has altered every watershed with dams, groundwater irrigation, deforestation and human consumption. But the ocean’s mostly unaltered and its salinity field provides insight into the vast majority of the pristine natural water cycle. The ocean has its own rain gauge in the form of salinity, and our task in SPURS is to learn how to read it.
The combination of the global coverage from Aquarius for surface salinity, detailed process studies in the ocean like SPURS, and sophisticated high-resolution computer models working in concert open up the oceanic water cycle to careful scientific examination.
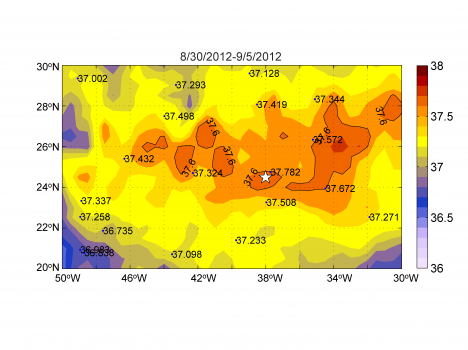
Aquarius salinity data from the first week of September 2012. (Credit: Oleg Melnichenko at University of Hawaii IPRC.)
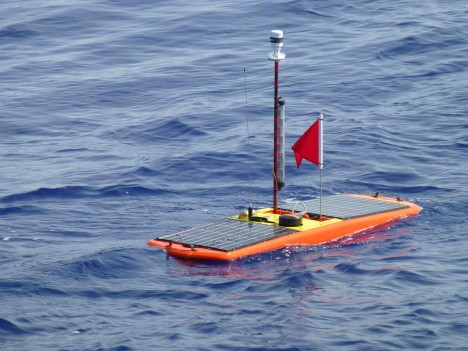
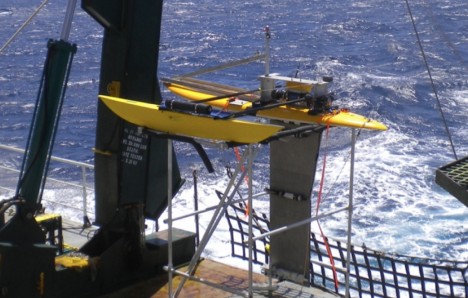
A SPURS Waveglider begins its journey to study upper ocean salinity.
We are beginning to deploy the array of instruments on the ship and they are starting their year-long mission to examine the ocean salinity variations. Our challenge is to understand the detailed picture of salinity that will be painted by the various sensors and to make sense of this in the larger picture of the global water cycle.
By Eric Lindstrom
If you all are waiting to see some action at sea, I am sorry it is taking a bit to unfold. It takes about a week from Woods Hole to reach our study site at 25N, 38W. It’s good for us to have the time to check and re-check the instruments, get people trained in various procedures and ready to stand watch for 24/7 operations, and get to know our work mates. However, everyone that has prepared for more than a year for the expedition finds this week a long one. We want to be getting gear in the water and a flood of data passing through our computers. We want to be up all night, busy with deployments, water sampling, and scientific analysis. Everyday on the research site will be brimming with new data and constant planning for the next event.
All eyes in CTD operations.
The chief scientist has his hands full keeping the entire show operating smoothly. We have mooring, Argo float, and drifter deployments, glider operation, underway profiling, station profiling, autonomous profilers, and more meteorological sensors than can be easily counted. Everything needs to be working, providing good data, calibrated, checked and re-checked, and while many things can happen simultaneously, nothing should interfere with anything else.
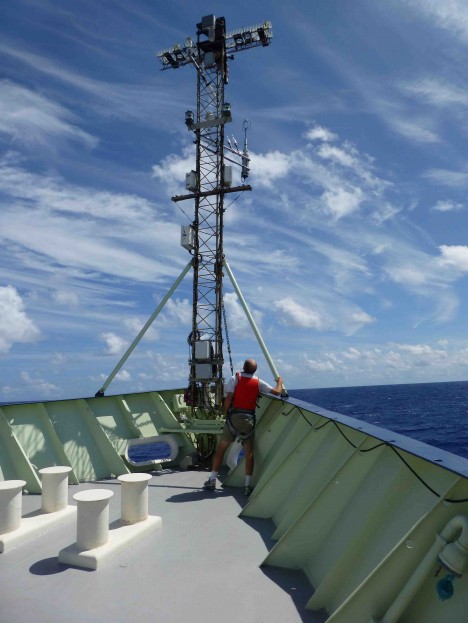
Meteorological tower on the bow of the R/V Knorr.
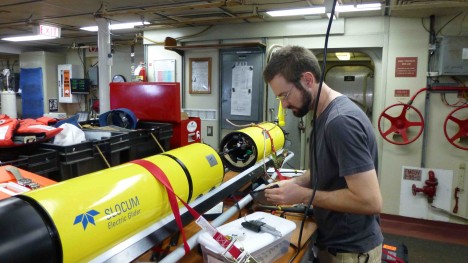
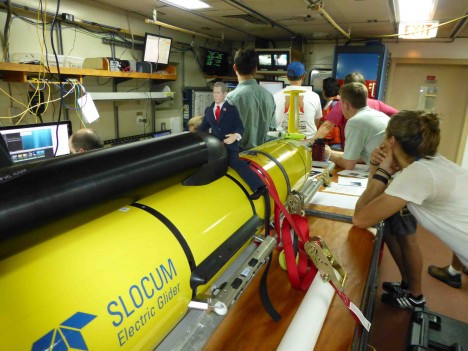
Preparing a slocum glider.
The order of business is, very roughly, to get the sensors we want in the water (to supplement what the research vessel can do), off the ship and doing their job. The moorings and Argo floats take a lot of space and only serve us when deployed, so we will spend much of the first days on site getting these in the water. While we move from one site to another deploying equipment, we will also be mapping the ocean with instruments we lower from the ship on station or tow behind the boat while underway. During just about every moment, we try to gather data from the upper 1300 feet (400 meters), to characterize the salinity field and ocean circulation.
Once we have all our assets in the water, we can focus on using them in conjunction with the ship to characterize the ocean environment on time scales from minutes to weeks and from inches to a hundred miles. Over about three weeks we will do our best to map and understand how salinity varies at this spot in the ocean and why it does what it does. When the ship leaves, we leave many of these instruments in the water, to continue our work for the next 12 months. Expeditions in six months and 12 months from now will maintain and eventually recover many of the instruments we deploy in the coming week. We think of it as deploying a sensor web in the ocean.
This kind of intense study is the basic work that helps us understand and interpret the weekly global maps of salinity we get from Aquarius. There are more esoteric and nerdy scientific questions that get answered along the way (making it very satisfying to all the scientists involved), but everyone is highly motivated by the opportunity Aquarius offers to study the global salinity field. SPURS is realizing that opportunity.
By Eric Lindstrom
Recent years have seen significant developments in satellites for oceanographers. The European Space Agency launched the Soil Moisture and Ocean Salinity (SMOS) mission and NASA launched the Aquarius instrument on the Argentine SAC-D mission.

Artist’s concept of the Aquarius/SAC-D spacecraft. (Credit: NASA)
Salinity has always been a challenging but critically important measurement for oceanographers. The small changes in salinity that we sea in the ocean are important in determining the density of seawater and density differences are partly responsible for ocean circulation (direct forcing by the wind being another big factor). It’s a challenging measurement because we estimate salinity by simultaneously measuring the temperature and conductivity of seawater and using a well-established formula to calculate salt concentration. The salinity of the open ocean ranges from about 33 to 38 parts per thousand and the target accuracy of satellites is to measure differences of 0.2 parts per thousand. That is like measuring the change in salinity from adding a pinch of salt to a gallon of waters. I challenge you to taste the difference!
It’s the relationship between conductivity and salinity that allows for its remote sensing of salinity from space. As the conductivity of ocean surface waters change (with salinity) there are minute detectable changes in the “brightness” of the surface in microwave emissions. So, in theory, if we have a sensitive enough microwave radiometer we should be able to detect these variations from low earth orbit and translate them into salinity. In fact, the scientific and technical complexity of this task is enormous (and luckily space agencies feast on such challenges!)
SMOS and Aquarius are two very different solutions to the technical problem of measuring a small microwave signal from Earth orbit. But they both face the daunting task of making adjustments for the sea surface temperature and roughness, the intervening atmosphere and ionosphere, and galactic signals reflected off the sea surface (there are strong sources for the microwaves that astronomers have mapped for decades: in fact we measure salinity at a frequency band 1.4 Ghz that is “protected” for astronomical research.)
Well, you can surf the web sites if you want to go into all the details… but let’s get back to the ocean, since I am out here! The advent of SMOS and Aquarius has renewed interest in the details of surface salinity properties of the ocean. Never before had oceanographers had weekly maps of the global salinity field. We have been looking at temperature maps for decades, but salinity is new. It’s worth a whole posting on what it means to know both the temperature and salinity maps of the surface of the ocean year-round, and I’ll do that another day.
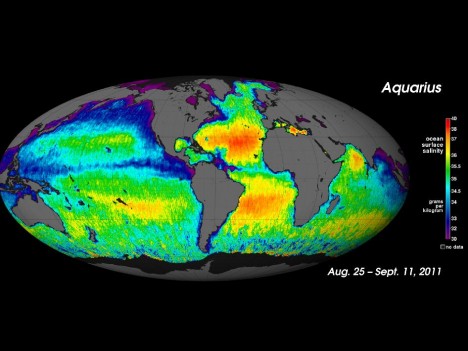
Aquarius’s first map of global ocean surface salinity, released in September 2011. (Credit: NASA)
SMOS and Aquarius drive scientists to wonder exactly how the variations of salinity seen from space come to be the way they are. That’s where detailed study of a few key ocean sites is so important.
Meanwhile, we are continuing to enjoy beautiful weather despite the hurricanes out and about in the Atlantic. The blue waters of the Sargasso Sea are delightful!
By Eric Lindstrom
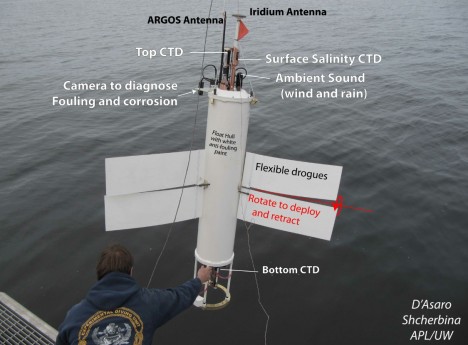
The Surface Salinity Profiler from University of Washington’s Applied Physics Lab, shown here while it was being tested at sea, is now deployed on R/V Thalassa.
The SPURS experiment involves not only sea-going oceanographers but modelers, and of course, remote sensing scientists using satellite data. As part of the daily posts from R/V Knorr I will go into more detail on the role of the models and satellite data in the overall scientific enterprise. I will profile the modeling teams and their interaction with the ship-based team during the voyage.
Numerical models of the ocean, run on supercomputers, can provide high-resolution animations of the physical environment for us sea-going scientists. In order to actually simulate the environment, the models need to take in data from the expedition and make sure the model solution is one that best fits the available data. This process is called data assimilation. (You are more familiar with data assimilation in models than you think – daily weather maps are the result of models and forecasts are done using data assimilation into sophisticated models of atmospheric physics.)
An objective of SPURS is to provide a high-resolution, near-real-time stream of data that can be assimilated into ocean models. Because the ocean is so big and complex, and our at-sea capacity to measure it so puny, we rely on ocean modeling and data assimilation to help us interpret the environment. The model results can be used in planning work at sea and to diagnose the balance of salinity in the upper ocean. The observations are essential to locking model results into the real oceanographic environment. The model is essential to estimating things we cannot measure directly and expanding upon the interpretations provided by the observations.
In SPURS, we hope that we scientists at sea and those ashore can collaborate through the exchange of data and model results. This was not possible as late as a decade ago. Now we have Internet at sea and can exchange information and results for daily planning and analysis.
I will discuss the synergy of models and data much more during posts from the ship in September.
SPURS as an International Enterprise
The SPURS experiment involves a number of expeditions and nations working in cooperation at the single location in the North Atlantic.
The French R/V Thalassa is in the SPURS region now with one U.S. team aboard from University of Washington’s Applied Physics Laboratory. I will give more details in future posts.
Follow-on U.S. expeditions will use R/V Endeavor from University of Rhode Island to follow-up the measurements of R/V Knorr. The first of these two expeditions is in the spring of 2013 and will service SPURS equipment that requires maintenance after 6 months at sea. That expedition will also do more of the “feature” characterization. A second expedition in the fall of 2013 will recover all the moored equipment and gliders, among other duties.
A Spanish cruise is also planned for next spring. The details of this expedition will be subject of a post.
What’s up next?
Next up will be the loading of R/V Knorr on 5 September and a media event at 10 am that day. We set sail on 9/6 at 10 am.
By Eric Lindstrom
As I mentioned in my previous post, our cruise will depart from Woods Hole, MA on September 6. Roughly, it will take eight days for our ship, R/V Knorr, to transit from Woods Hole to the SPURS central mooring site at 25N, 38W, the saltiest spot in the subtropical North Atlantic. Then we will spend several days planning for and deploying sophisticated moorings bristling with instrumentation, which will remain in place for 12 months and provide a broader view of the mooring area’s physical properties, which will be our starting point for future, more localized ship-borne measurements. Details of moored instrumentation and how the approximately 5-kilometer (3-mile) long moorings are deployed will be the subject of my shipboard posts.
Testing of a SPURS Langrangian float in Puget Sound in August 2012.
With moorings successfully in place, we will deploy an extensive array of Lagrangian (free-floating) instruments. There will be Argo floats that park at 1 km (0.6 mi) depth and periodically measure temperature and salinity measurements in the upper 2 km (1.2 mi) of the water column. We’ll also use surface drifters that measure surface temperature and salinity and the velocity of the upper ocean. We’ll deploy several kinds of gliders that collect upper ocean temperature and salinity data along pre-programmed tracks. There will also be specialized profilers for measuring the temperature and salinity fine structure to help us understand mixing processes. We will deploy and use these during the middle weeks of the expedition, while leaving many instruments that will continue to collect data for six months to a year.
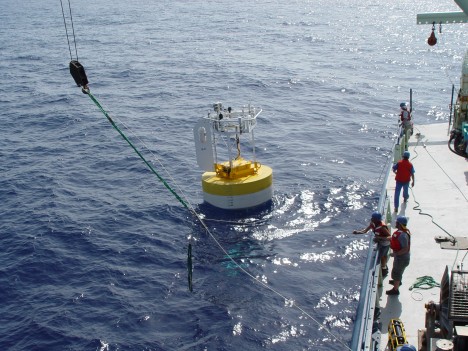
A SPURS mooring being tested.
Another aspect of the cruise is devoted to understanding the role of eddies (the swirls of ocean waters) in the circulation and the distribution of salinity. The cruise plan calls for finding and mapping an interesting front or eddy feature in some detail. My posts from the ship during that time will highlight the identification of the feature and how we chase it and measure it, and I will also describe the implications of our observations.
The expedition will wrap up with final checks of the instrumentation to be left behind, recovery of temporary deployments, profiles of temperature and salinity for cross-calibration of instruments and other duties that may arise.
We will use many of the kinds of instruments that are already deployed in a sustained, basin-wide observing system (surface drifters, Argo floats, moorings, and volunteer observing ships). What we will do with SPURS is expand the area we study, observe it for a longer time, and dig into the details. NOAA will be a strong partner throughout the SPURS mission, and I will tell you how we collaborate in future posts.
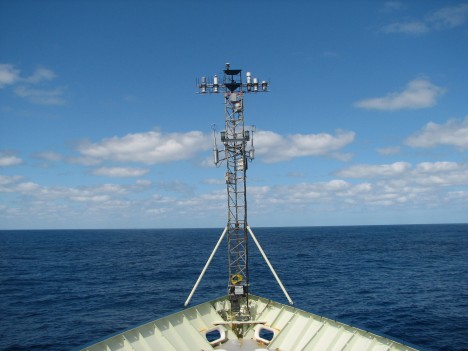
This mast measures ocean surface fluxes.
The chief scientist for the R/V Knorr leg of the SPURS experiment is Ray Schmitt from Woods Hole. Ray is funded by the National Science Foundation to examine salinity processes. NSF is an exceptional partner in SPURS – sharing the burden of ship support and helping to provide the scientists and equipment to study the smallest scales of variation of salinity. Their role is SPURS will also be detailed during the expedition posts.
All of the scientists and technicians involved in SPURS on R/V Knorr have numerous and specialized roles to play for the entire expedition to be successful. I plan on describing their personalities, work at sea, and motivations in future posts.
After approximately three weeks on site at the salinity maximum in the subtropical North Atlantic, R/V Knorr will make for Punta Delgada in the Azores Islands to turn over the ship to the next scientific party (not related to SPURS). It will take about 3 days at full speed to reach the Azores, where the ship is due on 9 October.
In my next post I will describe some of the shore-based and international collaborations that support SPURS.
Until then, smooth seas!
